Ethereum’s devs successfully launch Pectra upgrade on the Sepolia testnet

Source Cryptopolitan

On Wednesday, Ethereum’s developers successfully deployed the Pectra upgrade on the Sepolia test network. The upgrade will reportedly introduce 11 Ethereum Improvement Proposals (EIPs) and could improve staking, wallet functionality, and overall network efficiency.

According to Ether developer Terence Tsao, Pectra went live on Sepolia at 7:29 a.m. UTC today, completing the second test phase with a perfect proposal rate. This deployment came against the backdrop of a failed attempt on Ethereum’s Holesky testnet last week, where a misconfiguration among validators led to a chain split, temporarily rendering Holesky unusable. 

Testnets serve as experimental environments for developers to test upgrades without risking real assets. Holesky, with its validator structure closely resembling Ethereum’s mainnet, was expected to be the mainnet-equivalent testing ground for Pectra. 

Still, with only Sepolia’s successful deployment so far, developers are in discussions of whether additional testing is required before moving forward with a mainnet release. 

Responding to several queries about the failed testnet attempts, developer Tsao said it could take at least 18 more days to finalize the Holesky upgrade because issues related to “correlation penalties” and “validator balance drains” are still under investigation.

Ethereum developers debate on Pectra mainnet deployment timeline

Ethereum developers are scheduled to meet on March 6 at the All Core Developers (ACD) call to discuss the timeline for Pectra’s full integration on the blockchain network’s mainnet. 

The Ethereum Foundation had previously stated that both the Holesky and Sepolia testnets needed to be successfully upgraded before determining a mainnet activation epoch. But Pectra-Holesky’s hiccups have ignited talks about developers delaying the upgrade to ensure network stability.

One of the proposals included in Pectra is EIP-7251, which significantly increases the maximum staking limit from 32 ETH to 2,048 ETH. The change will effectively help Ethereum’s staking system reduce the need for large validators to split their stakes across multiple nodes. 

Currently, those staking more than 32 ETH must distribute their holdings among multiple validator instances, which makes the whole process a tall order.

Another proposal set for changes is the EIP-7702, which allows standard Ethereum wallets to temporarily function as smart contract wallets. It enables users to batch multiple transactions into one through gasless transactions and set up custom security rules.

For layer-2 solutions, Pectra brings lower fees through improved data storage. Rollups, which rely on “blobs” to store transaction data, will benefit from a doubling of blob storage capacity. The change, introduced through EIP-7691, will supposedy improve transaction processing by lowering costs and increasing speeds for users operating on layer-2 networks.

In an X post today, Former WazirX vice president Sandesh Suvarna said Pectra will help devs access new cryptographic tools designed to lower the cost of verifying signatures and transactions. 

Survana brought up the EIP-2537 proposal. If passed, it would lower the gas costs for BLS signature verification and zkSNARK proofs. This would allow for more advanced cryptographic applications on Ethereum.

Ethereum’s market consolidation continues

At the same time, there are still a lot of sellers in the Ethereum market, which is keeping its price in the same 3-month-long consolidation phase. Coingecko updates say that the crypto is now selling at $2,241, which is an increase of 7.3% in the last 24 hours. However, its momentum is still slightly negative at -2.86%.

ETH/USDT trading chart tracking Ethereum's price
ETH/USDT trading chart tracking Ethereum’s price. Source: TradingView

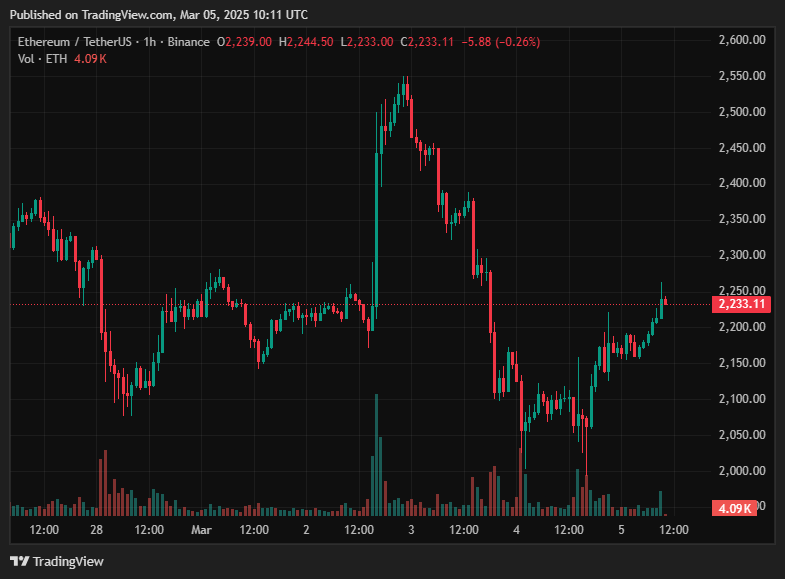
The current market structure suggests there’s an ongoing accumulation of tokens, evident from the declining volatility and moderate selling exhaustion visible on technical indicators, per TradingView’s analysis.

The Relative Strength Index (RSI) sits at 34.77, indicating oversold conditions but lacking a clear divergence signal. The Moving Average Convergence Divergence (MACD) shows bearish momentum weakening, though sellers still maintain control. 

Moreover, the Directional Movement Index (DMI) suggests a non-trending, consolidative phase, with a low Average Directional Index (ADX) reading of 10.5.

Ethereum’s primary support level is at $2,082, a price market analysts have coined as a strong demand zone. On the upside, resistance is set at $2,300, which is a level that needs to be breached for a bullish momentum to start. A close below $2,057 on high volume would invalidate the current support structure, potentially creating a path to more downside movement.

Cryptopolitan Academy: Tired of market swings? Learn how DeFi can help you build steady passive income. Register Now

Disclaimer: For information purposes only. Past performance is not indicative of future results.
placeholder
Gold Price Forecast: XAU/USD drifts higher above $4,200 as Fed delivers expected cutGold price (XAU/USD) gains momentum to around $4,235 during the early Asian session on Thursday. The precious metal extends its upside after the US Federal Reserve (Fed) delivered an expected third consecutive interest rate cut and maintained its outlook for just one cut in 2026.
Author  FXStreet
Dec 11, Thu
Gold price (XAU/USD) gains momentum to around $4,235 during the early Asian session on Thursday. The precious metal extends its upside after the US Federal Reserve (Fed) delivered an expected third consecutive interest rate cut and maintained its outlook for just one cut in 2026.
placeholder
Gold remains bid as lack of Fed clarity and geopolitical frictions persistGold (XAU/USD) advances modestly on Friday as traders seem to book profits ahead of the weekend, yet clings to gains of over 0.51% after reaching a seven-week high of $4,353. At the time of writing, XAU/USD trades at $4,302 as traders digest comments from Federal Reserve (Fed) officials.
Author  FXStreet
Yesterday 01: 34
Gold (XAU/USD) advances modestly on Friday as traders seem to book profits ahead of the weekend, yet clings to gains of over 0.51% after reaching a seven-week high of $4,353. At the time of writing, XAU/USD trades at $4,302 as traders digest comments from Federal Reserve (Fed) officials.
placeholder
Ethereum Price Slips Lower — $3,000 Looms as the Key BattlegroundEthereum is attempting to recover from a $3,026 low but remains below $3,200 and the 100-hour SMA, with a bearish trend line near $3,175 capping rebounds as bulls need a clean break above $3,200 to target $3,250–$3,400, while a drop below $3,050 risks a retest of $3,000 and $2,940.
Author  Mitrade
Yesterday 03: 25
Ethereum is attempting to recover from a $3,026 low but remains below $3,200 and the 100-hour SMA, with a bearish trend line near $3,175 capping rebounds as bulls need a clean break above $3,200 to target $3,250–$3,400, while a drop below $3,050 risks a retest of $3,000 and $2,940.
placeholder
Macro Analysts: Hawkish Japan Could Push Bitcoin Below $70KAnalysts predict Bitcoin may face further declines towards the $70,000 mark if the Bank of Japan raises interest rates as expected.
Author  Mitrade
Yesterday 05: 48
Analysts predict Bitcoin may face further declines towards the $70,000 mark if the Bank of Japan raises interest rates as expected.
placeholder
Bitcoin Slides 5% as Sellers Lean In — Can BTC Reclaim $88,000?Bitcoin has dropped back below $88,000 after rolling over from $90,500, with price still trading under the 100-hour Simple Moving Average. The sell-off found a floor at $85,151, and BTC is now consolidating near that base, but rebounds are facing pressure from a bearish trend line around $89,000. Bulls need to retake $88,000–$89,000 to ease downside risk; failure to do so keeps $85,500–$85,000 and then $83,500 in play, with $80,000 as the deeper “line in the sand.” Bitcoin (BTC) is back in damage-control mode after a sharp pullback wiped out recent gains. The price failed to reclaim the $90,000–$90,500 band, rolled over, and slid through $88,500 before briefly dipping under $87,000. Buyers did show up around $85,000, but the rebound so far looks more like stabilization than a clear trend reversal. Bitcoin dips hard, finds a bid near $85,000(h3) BTC’s latest move lower began when it couldn’t build follow-through above $90,000 and $90,500. Once that upside stalled, sellers took control and pushed price down through $88,500. The slide accelerated enough to spike below $87,000, but the market didn’t free-fall. Bulls defended the $85,000 zone, printing a low at $85,151. Since then, Bitcoin has been consolidating below the 23.6% Fibonacci retracement of the drop from the $93,560 swing high to the $85,151 low — a clue that the bounce is still shallow and that sellers haven’t fully backed off yet. Structurally, BTC is still on the back foot: It’s trading below $88,000, and It remains below the 100-hour Simple Moving Average, keeping short-term trend pressure pointed downward. Resistance is layered, and $89,000 is the problem area(h3) If bulls try to turn this into a recovery, they’ll have to climb through multiple ceilings in quick succession. First, BTC faces resistance around $87,150, followed by a more meaningful barrier near $87,500. From there, the market’s attention snaps back to $88,000 — the level BTC just lost and now needs to reclaim. A close back above $88,000 would improve the tone, but it doesn’t solve the bigger issue: there’s a bearish trend line on the hourly BTC/USD chart (Kraken feed) with resistance near $89,000, which also lines up with the next technical hurdle. If BTC can push through $89,000 and hold, the rebound could extend toward $90,000, with follow-through targets at $91,000 and $91,500. But until price clears that $88,000–$89,000 zone, rallies are at risk of being sold rather than chased. If BTC fails to reclaim resistance, the downside path is clear(h3) The near-term bear case is simple: if Bitcoin can’t climb back above the $87,000 area and keep traction, sellers may attempt another leg lower. Support levels line up like this: Immediate support: $85,500 First major support: $85,000 Next support: $83,500 Then $82,500 in the near term Below that, the major “don’t break this” level is still $80,000. If BTC slips under $80,000, the risk of acceleration to the downside increases significantly — not because it’s magic, but because it’s the kind of psychological and structural level that tends to trigger forced de-risking. Indicators: momentum still leans bearish(h3) The intraday indicators aren’t offering much comfort yet: Hourly MACD is losing pace in the bearish zone. Hourly RSI remains below 50, suggesting sellers still have the upper hand on short timeframes. So while the $85,000 defense held for now, the market hasn’t flipped bullish — it’s just stopped bleeding.
Author  Mitrade
9 hours ago
Bitcoin has dropped back below $88,000 after rolling over from $90,500, with price still trading under the 100-hour Simple Moving Average. The sell-off found a floor at $85,151, and BTC is now consolidating near that base, but rebounds are facing pressure from a bearish trend line around $89,000. Bulls need to retake $88,000–$89,000 to ease downside risk; failure to do so keeps $85,500–$85,000 and then $83,500 in play, with $80,000 as the deeper “line in the sand.” Bitcoin (BTC) is back in damage-control mode after a sharp pullback wiped out recent gains. The price failed to reclaim the $90,000–$90,500 band, rolled over, and slid through $88,500 before briefly dipping under $87,000. Buyers did show up around $85,000, but the rebound so far looks more like stabilization than a clear trend reversal. Bitcoin dips hard, finds a bid near $85,000(h3) BTC’s latest move lower began when it couldn’t build follow-through above $90,000 and $90,500. Once that upside stalled, sellers took control and pushed price down through $88,500. The slide accelerated enough to spike below $87,000, but the market didn’t free-fall. Bulls defended the $85,000 zone, printing a low at $85,151. Since then, Bitcoin has been consolidating below the 23.6% Fibonacci retracement of the drop from the $93,560 swing high to the $85,151 low — a clue that the bounce is still shallow and that sellers haven’t fully backed off yet. Structurally, BTC is still on the back foot: It’s trading below $88,000, and It remains below the 100-hour Simple Moving Average, keeping short-term trend pressure pointed downward. Resistance is layered, and $89,000 is the problem area(h3) If bulls try to turn this into a recovery, they’ll have to climb through multiple ceilings in quick succession. First, BTC faces resistance around $87,150, followed by a more meaningful barrier near $87,500. From there, the market’s attention snaps back to $88,000 — the level BTC just lost and now needs to reclaim. A close back above $88,000 would improve the tone, but it doesn’t solve the bigger issue: there’s a bearish trend line on the hourly BTC/USD chart (Kraken feed) with resistance near $89,000, which also lines up with the next technical hurdle. If BTC can push through $89,000 and hold, the rebound could extend toward $90,000, with follow-through targets at $91,000 and $91,500. But until price clears that $88,000–$89,000 zone, rallies are at risk of being sold rather than chased. If BTC fails to reclaim resistance, the downside path is clear(h3) The near-term bear case is simple: if Bitcoin can’t climb back above the $87,000 area and keep traction, sellers may attempt another leg lower. Support levels line up like this: Immediate support: $85,500 First major support: $85,000 Next support: $83,500 Then $82,500 in the near term Below that, the major “don’t break this” level is still $80,000. If BTC slips under $80,000, the risk of acceleration to the downside increases significantly — not because it’s magic, but because it’s the kind of psychological and structural level that tends to trigger forced de-risking. Indicators: momentum still leans bearish(h3) The intraday indicators aren’t offering much comfort yet: Hourly MACD is losing pace in the bearish zone. Hourly RSI remains below 50, suggesting sellers still have the upper hand on short timeframes. So while the $85,000 defense held for now, the market hasn’t flipped bullish — it’s just stopped bleeding.
goTop
quote