

Solana (SOL) Plunges 20%—Key Support Levels Now in Focus

Source Newsbtc

Solana started a fresh decline from the $180 zone. SOL price is down over 20% and might struggle to recover above the $150 resistance.

  • SOL price started a fresh decline below the $162 and $150 levels against the US Dollar.
  • The price is now trading below $150 and the 100-hourly simple moving average.
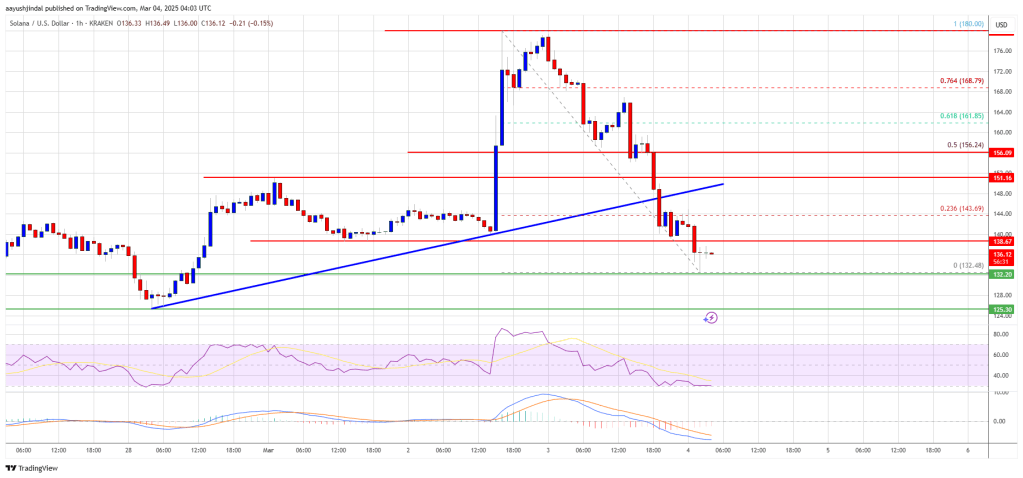
  • There was a break below a connecting bullish trend line with support at $148 on the hourly chart of the SOL/USD pair (data source from Kraken).
  • The pair could start a fresh increase if the bulls clear the $150 zone.

Solana Price Dips Heavily

Solana price struggled to clear the $180 resistance and started a fresh decline, like Bitcoin and Ethereum. SOL declined below the $165 and $155 support levels.

It even dived below the $150 level. There was a break below a connecting bullish trend line with support at $148 on the hourly chart of the SOL/USD pair. The recent low was formed at $132 and the price is now consolidating losses with a bearish angle.

Solana is now trading below $140 and the 100-hourly simple moving average. On the upside, the price is facing resistance near the $140 level. The next major resistance is near the $144 level or the 23.6% Fib retracement level of the downward move from the $180 swing high to the $132 swing low.
Solana Price

The main resistance could be $156 and the 50% Fib retracement level of the downward move from the $180 swing high to the $132 swing low. A successful close above the $156 resistance zone could set the pace for another steady increase. The next key resistance is $165. Any more gains might send the price toward the $180 level.

More Losses in SOL?

If SOL fails to rise above the $148 resistance, it could start another decline. Initial support on the downside is near the $132 zone. The first major support is near the $125 level.

A break below the $125 level might send the price toward the $120 zone. If there is a close below the $120 support, the price could decline toward the $102 support in the near term.

Technical Indicators

Hourly MACD – The MACD for SOL/USD is gaining pace in the bearish zone.

Hourly Hours RSI (Relative Strength Index) – The RSI for SOL/USD is below the 50 level.

Major Support Levels – $132 and $125.

Major Resistance Levels – $148 and $156.

Disclaimer: For information purposes only. Past performance is not indicative of future results.
placeholder
My Top 5 Stock Market Predictions for 2026Five 2026 market predictions written in a native, news-style voice: AI’s winners and losers, broader sector leadership, dividend demand, valuation cooling as the Shiller CAPE sits at 39 (Dec. 31, 2025), and quantum-computing bursts—while keeping all original facts and numbers unchanged.
Author  Mitrade
Jan 06, Tue
Five 2026 market predictions written in a native, news-style voice: AI’s winners and losers, broader sector leadership, dividend demand, valuation cooling as the Shiller CAPE sits at 39 (Dec. 31, 2025), and quantum-computing bursts—while keeping all original facts and numbers unchanged.
placeholder
Financial Markets 2026: Volatility Catalysts in Gold, Silver, Oil, and Blue-Chip Stocks—A CFD Trader's OutlookGet a comprehensive financial market 2026 outlook exploring key economic drivers, volatility catalysts in gold, oil and stocks, and what the evolving economic outlook means for cfd trading strategies and risk management on global markets.
Author  Rachel Weiss
May 15, Fri
Get a comprehensive financial market 2026 outlook exploring key economic drivers, volatility catalysts in gold, oil and stocks, and what the evolving economic outlook means for cfd trading strategies and risk management on global markets.
placeholder
Gold Price Forecast: Can Gold Keep Rising After Reclaiming $4,400 as Markets Await Upcoming CPI Data?During Wednesday's Asian trading session, spot gold (XAUUSD) extended its rebound, reclaiming $4,400/oz. As of 11:08 Beijing time on August 12, spot gold was trading at $4,414.705/oz, up
Author  TradingKey
Aug 12, Wed
During Wednesday's Asian trading session, spot gold (XAUUSD) extended its rebound, reclaiming $4,400/oz. As of 11:08 Beijing time on August 12, spot gold was trading at $4,414.705/oz, up
placeholder
WTI declines below $82.50 as oil inventories rise far more than expectedWest Texas Intermediate (WTI), the US crude oil benchmark, is trading around $82.45 during the early Asian trading hours on Thursday. WTI declines on a larger-than-expected build in US crude oil inventories. Traders will closely monitor the developments surrounding US-Iran talks for fresh impetus. 
Author  FXStreet
Aug 13, Thu
West Texas Intermediate (WTI), the US crude oil benchmark, is trading around $82.45 during the early Asian trading hours on Thursday. WTI declines on a larger-than-expected build in US crude oil inventories. Traders will closely monitor the developments surrounding US-Iran talks for fresh impetus. 
placeholder
WTI remains below $80.50 as traders monitor diplomatic efforts to reopen HormuzWest Texas Intermediate (WTI) oil price remains subdued for the third successive day, trading around $80.30 per barrel during the Asian hours on Friday. Crude oil prices edge lower as investors adopt a wait-and-see approach, closely monitoring diplomatic attempts to reopen the Strait of Hormuz.
Author  FXStreet
23 hours ago
West Texas Intermediate (WTI) oil price remains subdued for the third successive day, trading around $80.30 per barrel during the Asian hours on Friday. Crude oil prices edge lower as investors adopt a wait-and-see approach, closely monitoring diplomatic attempts to reopen the Strait of Hormuz.
goTop
quote