

Ethereum Price Consolidation In Progress—Uptrend Resuming Soon?

Source Newsbtc

Ethereum price is showing positive signs above the $2,680 zone. ETH is gaining pace and an upside break above $2,755 could trigger bullish moves.

  • Ethereum is still showing positive signs above the $2,650 zone.
  • The price is trading above $2,720 and the 100-hourly Simple Moving Average.
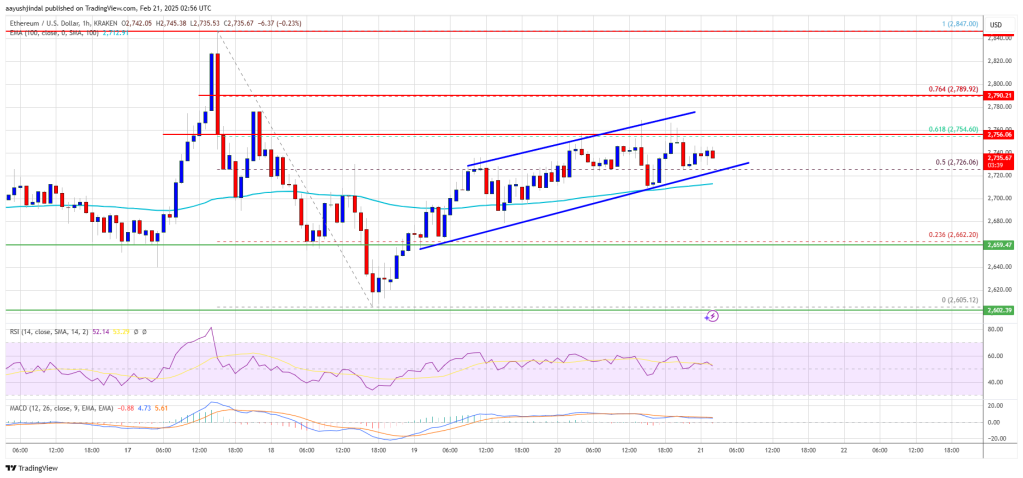
  • There is following a key rising channel with support at $2,725 on the hourly chart of ETH/USD (data feed via Kraken).
  • The pair could start a decent upward move if it settles above $2,755 and $2,800.

Ethereum Price Eyes Upside Break

Ethereum price remained supported above the $2,550 level and recently started a decent upward move, but it underperformed Bitcoin. ETH gained pace above the $2,650 and $2,660 resistance levels.

The price even cleared the 50% Fib retracement level of the downward wave from the $2,845 swing high to the $2,604 low. There was also a move above the $2,720 resistance level. Besides, the price is following a key rising channel with support at $2,725 on the hourly chart of ETH/USD.

Ethereum price is now trading above $2,720 and the 100-hourly Simple Moving Average. On the upside, the price seems to be facing hurdles near the $2,755 level. It is close to the 61.8% Fib retracement level of the downward wave from the $2,845 swing high to the $2,604 low.
Ethereum Price

The first major resistance is near the $2,790 level. The main resistance is now forming near $2,800 or $2,820. A clear move above the $2,820 resistance might send the price toward the $2,880 resistance. An upside break above the $2,880 resistance might call for more gains in the coming sessions. In the stated case, Ether could rise toward the $2,920 resistance zone or even $3,000 in the near term.

Another Decline In ETH?

If Ethereum fails to clear the $2,755 resistance, it could start another decline. Initial support on the downside is near the $2,720 level. The first major support sits near the $2,665 zone.

A clear move below the $2,665 support might push the price toward the $2,620 support. Any more losses might send the price toward the $2,550 support level in the near term. The next key support sits at $2,500.

Technical Indicators

Hourly MACDThe MACD for ETH/USD is gaining momentum in the bullish zone.

Hourly RSIThe RSI for ETH/USD is now above the 50 zone.

Major Support Level – $2,720

Major Resistance Level – $2,755

Disclaimer: For information purposes only. Past performance is not indicative of future results.
placeholder
Japanese Yen rallies to February 18 high as upbeat wage data and GDP lift BoJ hike betsThe USD/JPY pair declines for the second straight day – also marking the fourth day of a fall in the previous five – and sinks to its lowest level since February 18, around mid-153.00s during the Asian session on Tuesday.
Author  FXStreet
Sep 08, Tue
The USD/JPY pair declines for the second straight day – also marking the fourth day of a fall in the previous five – and sinks to its lowest level since February 18, around mid-153.00s during the Asian session on Tuesday.
placeholder
Brent holds above $100 as tanker attacks tighten supply — but four forces are capping the rallyBrent crude is holding above $100 a barrel for a second session, its first close above the level since late July, as tanker attacks near the Strait of Hormuz squeeze an already tight physical market. Yet the rally has been gradual: 8.3 mb/d of Gulf output is still shut in, diesel is at a record, and forecasts now range from $74 to $100.
Author  Irene Q.
Sep 10, Thu
Brent crude is holding above $100 a barrel for a second session, its first close above the level since late July, as tanker attacks near the Strait of Hormuz squeeze an already tight physical market. Yet the rally has been gradual: 8.3 mb/d of Gulf output is still shut in, diesel is at a record, and forecasts now range from $74 to $100.
placeholder
US August CPI Preview: Will Inflation Reaccelerate? US Stocks, Dollar and Gold Face Key Test On Friday, September 11 (ET), the U.S. Bureau of Labor Statistics will release the Consumer Price Index (CPI) for August, the final major inflation report before the Federal Reserve's Sep
Author  TradingKey
Sep 10, Thu
On Friday, September 11 (ET), the U.S. Bureau of Labor Statistics will release the Consumer Price Index (CPI) for August, the final major inflation report before the Federal Reserve's Sep
placeholder
US August CPI lands tonight: after a 5.4% PPI shock, will the Fed hike on September 16?US August PPI came in at 5.4% year-on-year, above the 5.3% consensus, with core PPI at 4.6%. Traders have pushed the odds of a 25bp Fed hike on September 15-16 to around 70%. Tonight's CPI is the last major inflation print before the decision — here is the full calendar, the consensus numbers, and what a hot versus cool reading would mean for the dollar, yields, gold and stocks.
Author  Irene Q.
22 hours ago
US August PPI came in at 5.4% year-on-year, above the 5.3% consensus, with core PPI at 4.6%. Traders have pushed the odds of a 25bp Fed hike on September 15-16 to around 70%. Tonight's CPI is the last major inflation print before the decision — here is the full calendar, the consensus numbers, and what a hot versus cool reading would mean for the dollar, yields, gold and stocks.
placeholder
Gold Price Forecast: PPI and Oil Prices Fuel Inflation Concerns, Can CPI Change Gold's Direction?As of the Asian session on September 11, gold prices (XAUUSD) remained in weak consolidation today after dropping sharply to near $4,300 on Thursday, with the latest price trading around
Author  TradingKey
20 hours ago
As of the Asian session on September 11, gold prices (XAUUSD) remained in weak consolidation today after dropping sharply to near $4,300 on Thursday, with the latest price trading around
goTop
quote