


Ethereum Price Forecast: ETH eyes recovery after market crash saw investors realizing $1.2 billion losses
Ethereum price today: $2,730
- Ethereum investors realized losses worth over $1.2 billion in the past three days after the general crypto market decline.
- Ethereum could see a recovery as whales buy the dip following Donald Trump and the Mexican President's tariff resolution.
- ETH eyes a move above $2,800 after bouncing near a historically high demand zone between $2,200 and $2,600.
Ethereum (ETH) is down 5% on Monday following the wider crypto market decline sparked by United States (US) President Donald Trump's tariffs on Mexico, Canada and China. Despite the bearish sentiments, ETH could stage a comeback as bulls are looking to recover the $2,817 key support level.
Ethereum leads crypto market losses, whales could stage a comeback
Ethereum experienced one of its largest single-day drawdowns in the current cycle in the past 24 hours, declining nearly 25% in the early hours of Monday before seeing a rebound.
The price crash saw Ethereum traders sustaining the highest liquidation in the crypto market, with over $620 million in liquidated futures positions in the past 24 hours, per Coinglass data. The total amount of liquidated long and short positions accounted for $464 million and $157 million, respectively.
Notably, crypto exchange Bybit CEO Ben Zhou noted in an X post on Monday that the market liquidations are higher than what was captured in crypto data providers due to API limitations.
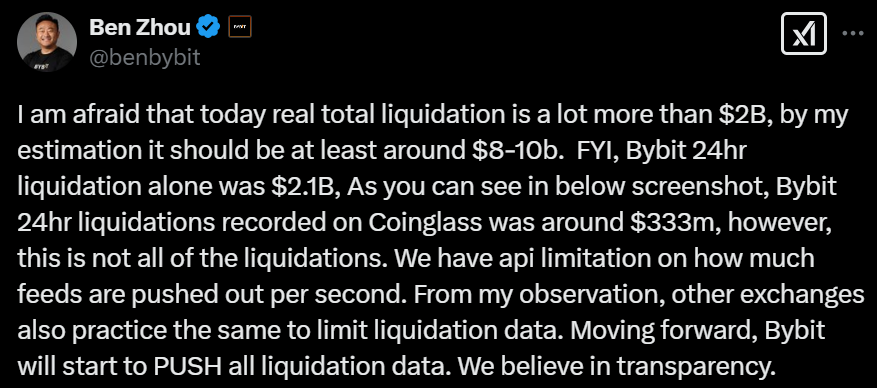
Ben Zhou in a Monday X post
On the spot market, both long-term and short-term holders contributed to the selling pressure, realizing over $1.2 billion in losses in the past three days — the highest since September 2023.
 [20.13.29, 03 Feb, 2025]-638742106526230957.png)
ETH Network Realized Profit/Loss. Source: Santiment
Similar to the general crypto market, ETH's decline was sparked by speculations of a global trade war after President Donald Trump slapped tariffs on imported goods from Mexico and Canada, with an additional 10% levy on China on top of existing tariffs.
With dominant bearish sentiment in the market, Nick Forster, founder of crypto derivatives exchange Derive, highlighted in a note to FXStreet that the exchange's options market is "currently pricing in a 14% chance of ETH reaching $2,000 before March 28."
He added that ETH is likely to stagnate for the next 1-2 quarters due to its declining market dominance and transaction volume.
"ETH has seen its dominance drop to just 10.9% from 17.3% at the start of 2024. Additionally, ETH's daily transaction volume has remained fairly flat over the past 4 years, hovering around 1.25 million transactions per day despite the Merge," wrote Forster.
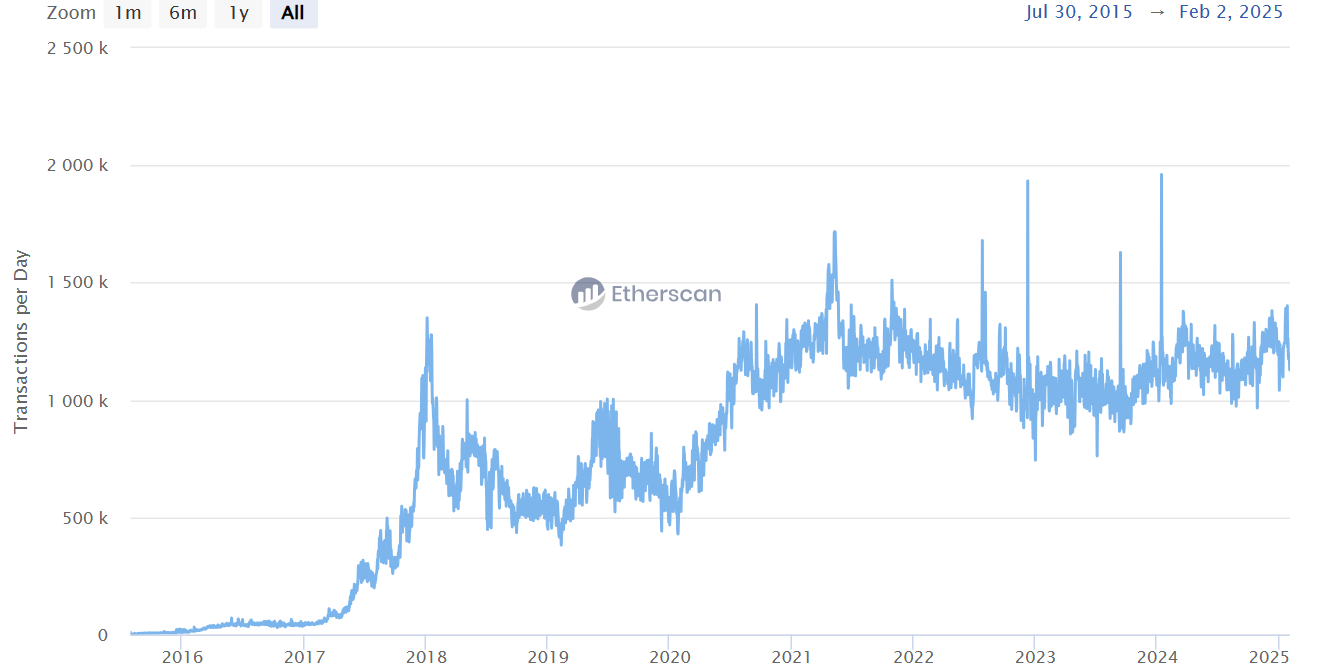
Ethereum Daily Transactions. Source: Etherscan
However, with Mexican President Claudia Sheinbaum reaching an agreement with Trump to pause the country's tariff for one month, Ethereum could see a recovery alongside the wider crypto market.
On-chain data shows whales are already buying the dip as a whale wallet tagged "7 Siblings" bought 50,429 ETH for an average price of $126 million after the market crash, per Lookonchain data.
Meanwhile US spot Ethereum exchange-traded funds (ETFs) saw $45.3 millioin in outflows last week, per Coinglass data.
Ethereum Price Forecast: ETH could reclaim $2,817 support
Ethereum declined over 30% between Friday and Monday, bouncing near the $2,110 support level after it validated a Head-and-Shoulders (H&S) pattern when it breached the $3,000 psychological level on Sunday. This aligned with an earlier FXStreet analysis that predicted the top altcoin declining toward $2,200.
ETH is looking to reclaim the $2,817 key support level after bouncing near $2,110. A firm move above this level could see ETH reclaim the $3,000 psychological level.
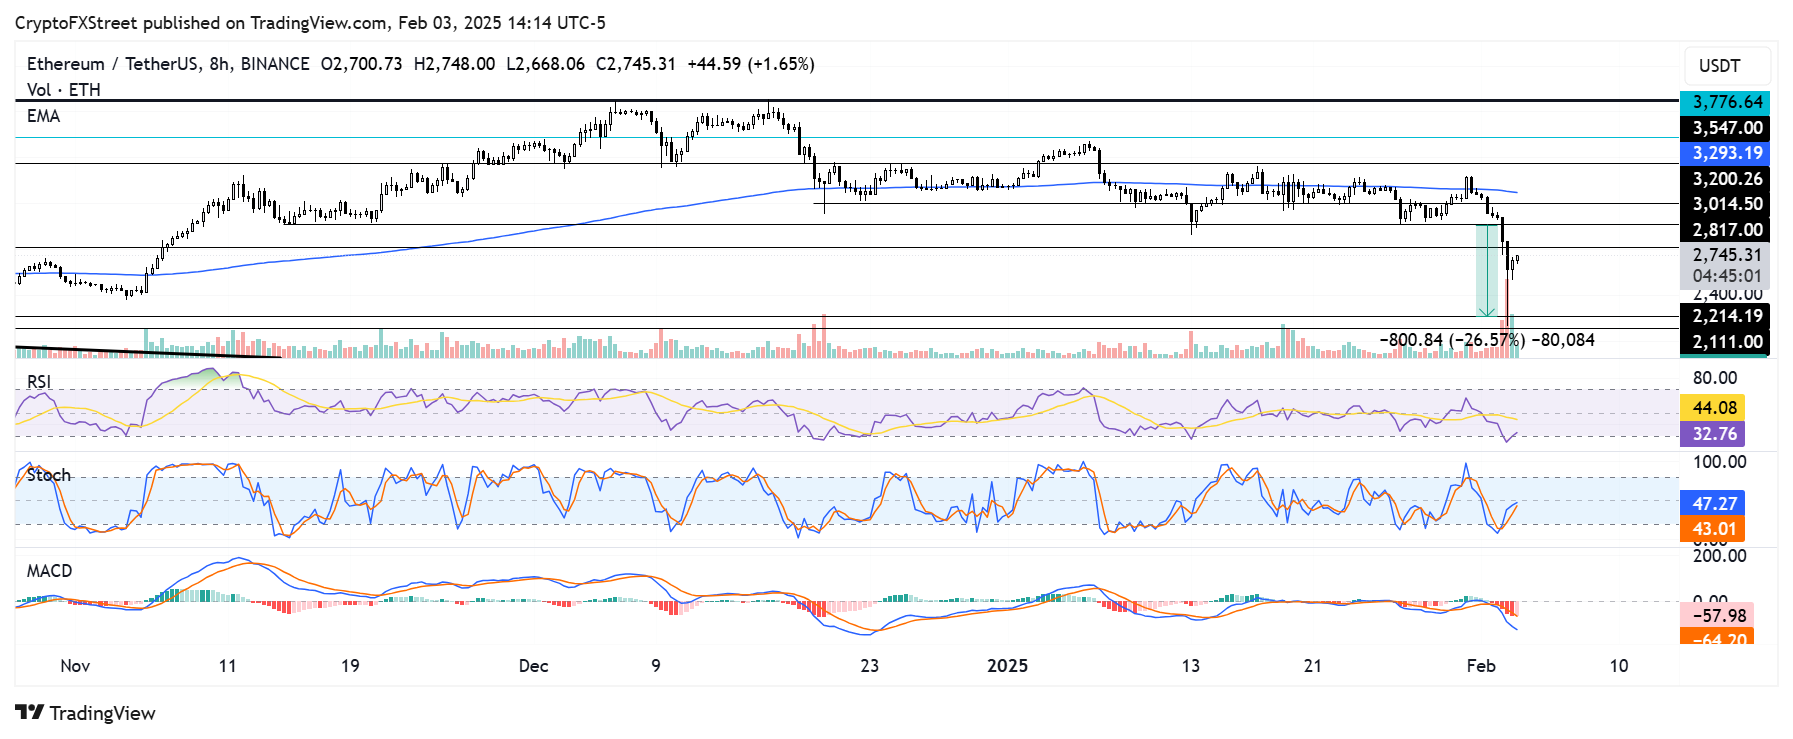
ETH/USDT 8-hour chart
On the downside, ETH could find support between $2,200 and $2,600, a historically high-demand zone. Investors purchased over 50% of the entire ETH in circulation within this range, per IntoTheBlock's data.
The Relative Strength Index (RSI) and Stochastic Oscillator (Stoch) momentum indicators have recovered from their oversold regions and are trending upward, indicating rising buying pressure.
A daily candlestick close below $2,200 will invalidate the thesis.
Ethereum FAQs
Ethereum is a decentralized open-source blockchain with smart contracts functionality. Its native currency Ether (ETH), is the second-largest cryptocurrency and number one altcoin by market capitalization. The Ethereum network is tailored for building crypto solutions like decentralized finance (DeFi), GameFi, non-fungible tokens (NFTs), decentralized autonomous organizations (DAOs), etc.
Ethereum is a public decentralized blockchain technology, where developers can build and deploy applications that function without the need for a central authority. To make this easier, the network leverages the Solidity programming language and Ethereum virtual machine which helps developers create and launch applications with smart contract functionality.
Smart contracts are publicly verifiable codes that automates agreements between two or more parties. Basically, these codes self-execute encoded actions when predetermined conditions are met.
Staking is a process of earning yield on your idle crypto assets by locking them in a crypto protocol for a specified duration as a means of contributing to its security. Ethereum transitioned from a Proof-of-Work (PoW) to a Proof-of-Stake (PoS) consensus mechanism on September 15, 2022, in an event christened “The Merge.” The Merge was a key part of Ethereum's roadmap to achieve high-level scalability, decentralization and security while remaining sustainable. Unlike PoW, which requires the use of expensive hardware, PoS reduces the barrier of entry for validators by leveraging the use of crypto tokens as the core foundation of its consensus process.
Gas is the unit for measuring transaction fees that users pay for conducting transactions on Ethereum. During periods of network congestion, gas can be extremely high, causing validators to prioritize transactions based on their fees.
Recommended Articles


