Ethereum MVRV Forms Signal That Last Led To 40% Price Crash

Source Newsbtc

On-chain data shows the Ethereum Market Value to Realized Value (MVRV) Ratio has just seen a signal that could prove to be bearish for ETH’s price.

Ethereum MVRV Momentum Has Witnessed A Bearish Crossover

As pointed out by analyst Ali Martinez in a new post on X, the Ethereum MVRV Ratio has declined under its 160-day moving average (MA) recently. The “MVRV Ratio” refers to an on-chain indicator that keeps track of the ratio between the Ethereum market cap and the realized cap.

The realized cap here is a capitalization model that calculates ETH’s total valuation by assuming that the ‘real’ value of each token in circulation is equal to the spot price at which it was last transferred on the blockchain.

Since the last transaction of any coin is likely to correspond to the last point at which it changed hands, the Realized Cap essentially measures the sum of the cost basis of the circulating supply. This model could also be looked at as a representation of the amount of capital the investors as whole have put into Ethereum. In contrast, the market cap is the value that the holders are carrying right now.

When the value of the MVRV Ratio is greater than 1, it means the market cap is greater than the realized cap. Such a trend implies the investors as a whole are sitting on unrealized gains. On the other hand, the metric being under the mark suggests the holders are carrying a lower value than they initially put in, so the average investor could be considered underwater.

Now, here is the chart shared by the analyst that shows the trend in the Ethereum MVRV Ratio, as well as its 160-day MA, over the past year:

Bitcoin MVRV Ratio

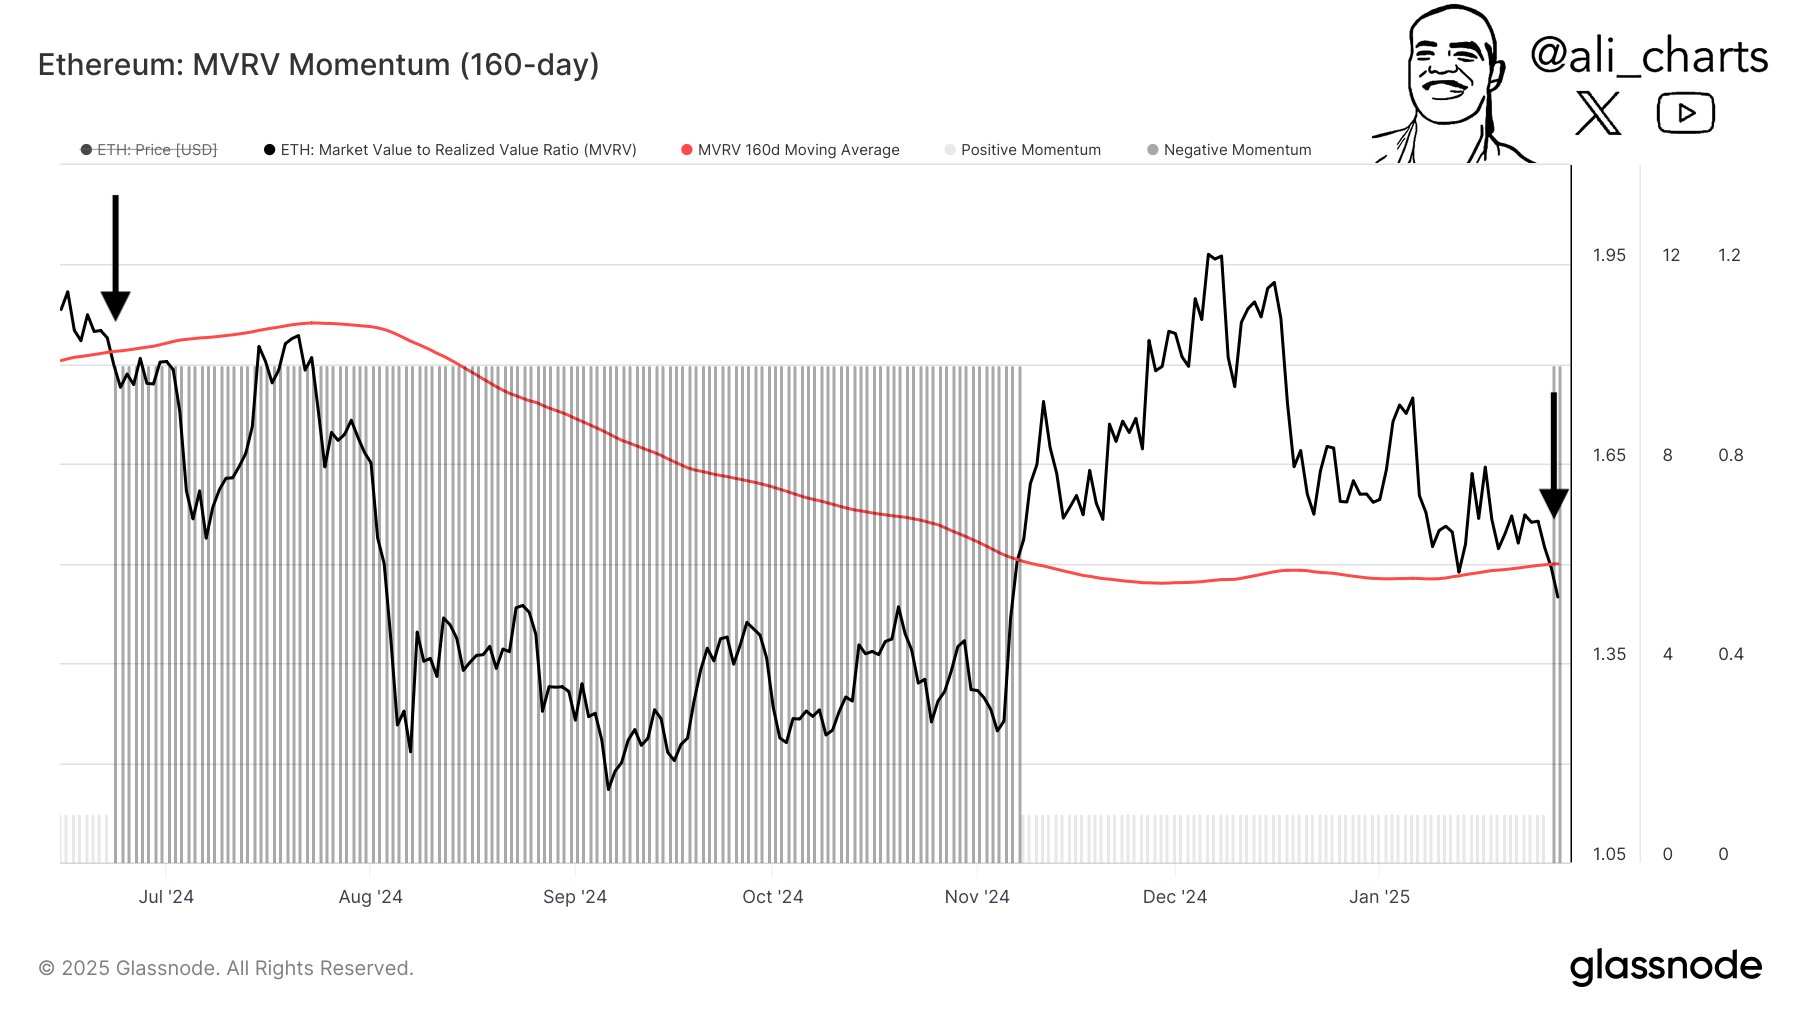
As is visible in the above graph, the Ethereum MVRV Ratio has registered a decline recently as ETH’s price has followed a bearish trajectory. The indicator is still above the 1 mark after this drawdown, suggesting the overall market remains in the green.

The metric’s fall, however, has meant that it has slipped under its 160-day MA. The combination of the indicator’s daily value and its 160-day is known as the MVRV Momentum. In the chart, Martinez has highlighted what happened the last time the MVRV Momentum showed a similar pattern as recently.

It would appear that the MVRV Ratio crossing under its 160-day MA led to a 40% price correction for Ethereum last year. It now remains to be seen whether the negative momentum in the indicator would also prove to be bearish for the cryptocurrency this time as well or not.

ETH Price

At the time of writing, Ethereum is floating around $3,200, up more than 2% over the last seven days.

Ethereum Price Chart
Disclaimer: For information purposes only. Past performance is not indicative of future results.
placeholder
Top 3 Price Prediction: Bitcoin, Ethereum, Ripple – BTC, ETH and XRP Look for a Foothold After a Sharp ShakeoutBitcoin trades near $92,600 after a dip below $90,000, while Ethereum around $3,118 and XRP near $2.21–$2.23 sit on key support zones, as BTC, ETH and XRP all try to turn a sharp correction into a tradable rebound rather than a deeper slide.
Author  Mitrade
Nov 19, Wed
Bitcoin trades near $92,600 after a dip below $90,000, while Ethereum around $3,118 and XRP near $2.21–$2.23 sit on key support zones, as BTC, ETH and XRP all try to turn a sharp correction into a tradable rebound rather than a deeper slide.
placeholder
Bitcoin Volatility Spikes: Is Options-Driven Pricing Making a Comeback?Bitcoin's volatility is surging, suggesting a shift back to options-driven price action seen before Bitcoin ETFs were launched.
Author  Mitrade
Nov 24, Mon
Bitcoin's volatility is surging, suggesting a shift back to options-driven price action seen before Bitcoin ETFs were launched.
placeholder
2025 Black Friday is coming! Which stocks may see volatility?Coming on the day right after Thanksgiving in the United States, Back Friday marks the start of the holiday shopping season. Sales data from this shopping frenzy day reflects investor confidence and consumer trends. The National Retail Federation (NRF) predicts that holiday season (Nov and Dec) retail sales in 2025 will likely exceed $1 trillion for the very first time, which represents a year-over-year increase of 3.7 to 4.2 percent. Historic data from the past decade show that the retail sector has generally outperformed the S&P 500 during the weeks before and after Black Friday. The following retailing companies are expected to be big winners:
Author  Insights
Nov 24, Mon
Coming on the day right after Thanksgiving in the United States, Back Friday marks the start of the holiday shopping season. Sales data from this shopping frenzy day reflects investor confidence and consumer trends. The National Retail Federation (NRF) predicts that holiday season (Nov and Dec) retail sales in 2025 will likely exceed $1 trillion for the very first time, which represents a year-over-year increase of 3.7 to 4.2 percent. Historic data from the past decade show that the retail sector has generally outperformed the S&P 500 during the weeks before and after Black Friday. The following retailing companies are expected to be big winners:
placeholder
Gold Price Forecast: XAU/USD rises to near $4,150 as Fed rate cut bets growGold price (XAU/USD) attracts some buyers to around $4,140 during the early Asian session on Tuesday. The precious metal rises on growing expectations of a US Federal Reserve (Fed) interest rate cut in the December policy meeting.
Author  FXStreet
22 hours ago
Gold price (XAU/USD) attracts some buyers to around $4,140 during the early Asian session on Tuesday. The precious metal rises on growing expectations of a US Federal Reserve (Fed) interest rate cut in the December policy meeting.
placeholder
Bitcoin Bleeds to $86K, But This Key Indicator Screams "The Top Isn't In"Bitcoin’s adjusted Spent Output Profit Ratio (aSOPR) has spent nearly two years coiling below the extremes seen at past bull-market peaks, even as BTC trades around $86,300 and down 9% on the week — a setup that leaves open the possibility that this cycle’s true top may still lie ahead.
Author  Mitrade
16 hours ago
Bitcoin’s adjusted Spent Output Profit Ratio (aSOPR) has spent nearly two years coiling below the extremes seen at past bull-market peaks, even as BTC trades around $86,300 and down 9% on the week — a setup that leaves open the possibility that this cycle’s true top may still lie ahead.
goTop
quote