Three factors that could catalyze a significant surge in Optimism in the upcoming weeks

Source Fxstreet
  • Optimism Delta upgrade will activate on the mainnet on February 22, effectively reducing Layer 1 costs. 
  • Optimism launched its first Security Council on February 9, decentralizing the protocol further.
  • OP is gearing towards Stage 1 decentralization milestones like establishing a multiproof network.
  • $85.28 million in Optimism tokens are scheduled for unlock on February 29. 
  • OP price declined slightly to $3.735, observing a 2% loss on Tuesday.

Optimism, an Ethereum scaling solution launched its first Security Council, a collective that assumes control of keys and multisigs for the Foundation, on February 9. The protocol has lined up several significant upgrades for February, these developments are expected to catalyze gains in OP price. 

The protocol is inching towards further decentralization, hitting technical development milestones along the way. 

Two key events for February are Delta upgrade and the $85.28 million OP token unlock. The recent migration of decentralized social media protocol Farcaster to OP mainnet is another catalyst that is likely to fuel OP price rally in the coming weeks. 

Also read: XRP price resumes uptrend amidst possibility of settlement in SEC v. Ripple lawsuit

Optimism to benefit from Ethereum’s upcoming upgrade 

Ethereum’s Dencun upgrade has successfully completed its testnet releases and is ready for its mainnet release as early as March 2024, according to the latest update from Ethereum core developers. The upgrade is pivotal to Optimism since it will slash the requirement for data for maintaining Ethereum-based Layer 2 chains. 

Dencun will reduce the cost of transactions that are processed via Layer 2 blockchains and make Optimism cost-effective for users. This could further boost demand for Optimism in the crypto ecosystem. Dencun is therefore one of the key catalysts for Optimism price gains in the coming weeks. 

Three catalysts likely to drive OP price gains

The top three catalysts likely to drive OP price gains are as follows:

  • Delta upgrade on OP mainnet 
  • OP decentralization milestones
  • Farcaster migration to OP mainnet

Another key development is the upcoming OP token unlock. 

Delta upgrade

Optimism has lined up the mainnet release of its Delta upgrade that activates Span Batches for OP Mainnet and all other OP Chains. Span Batches is a feature that makes technical changes to the underlying blockchain to reduce Layer 1 costs by 97% for inactive chains. The upgrade could derisk the launch of new OP chains through its meaningful cost reduction. 

Aside from the technicalities, this upgrade could boost OP’s popularity among developers in the community, driving demand for OP among new web3 projects and increasing its relevance in the ecosystem. 

The upgrade goes live on Thursday, February 22. 

OP decentralization

On February 9, the Collective launched its first Security Council and established a 2/2 multisig. This multisig is authorized to sign protocol upgrades for OP mainnet. The two signers are the Optimism Foundation and the Security Council. 

Following this development, Optimism will advance its decentralization on the technical, social and governance track, to reach all Stage 1 decentralization milestones outlined by Vitalik Buterin in his 2022 roadmap. 

This development is likely a catalyst for OP price gains in the coming months.

OP roadmap

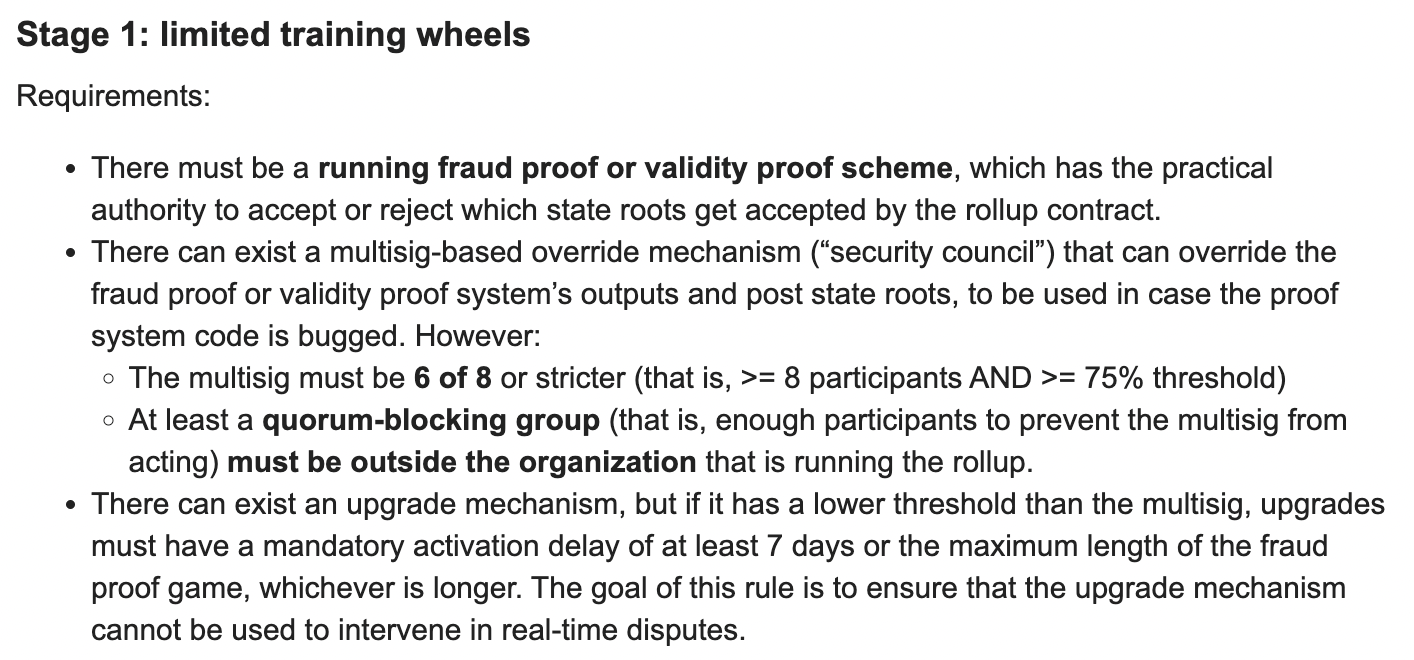
Vitalik Buterin’s roadmap for Stage 1 decentralization

Farcaster migration to OP mainnet 

Decentralized social media protocol Farcaster completed its migration to the OP mainnet recently. The project’s apps and associated smart contracts migrated from Ethereum to the popular Layer 2 chain. 

Farcaster’s co-founder Dan Romero confirmed the plan and shared an update in 2023. While this development may seem dated, it is a key aspect of Optimism’s growth story since the OP mainnet has witnessed a massive spike in active addresses with the arrival of apps like WorldCoin and Farcaster. 

Data from IntoTheBlock reveals that user activity on Optimism has increased significantly with the deployment of these two popular applications, driving OP mainnet to the top 60% of the daily active addresses in Optimistic Rollups. 

OP

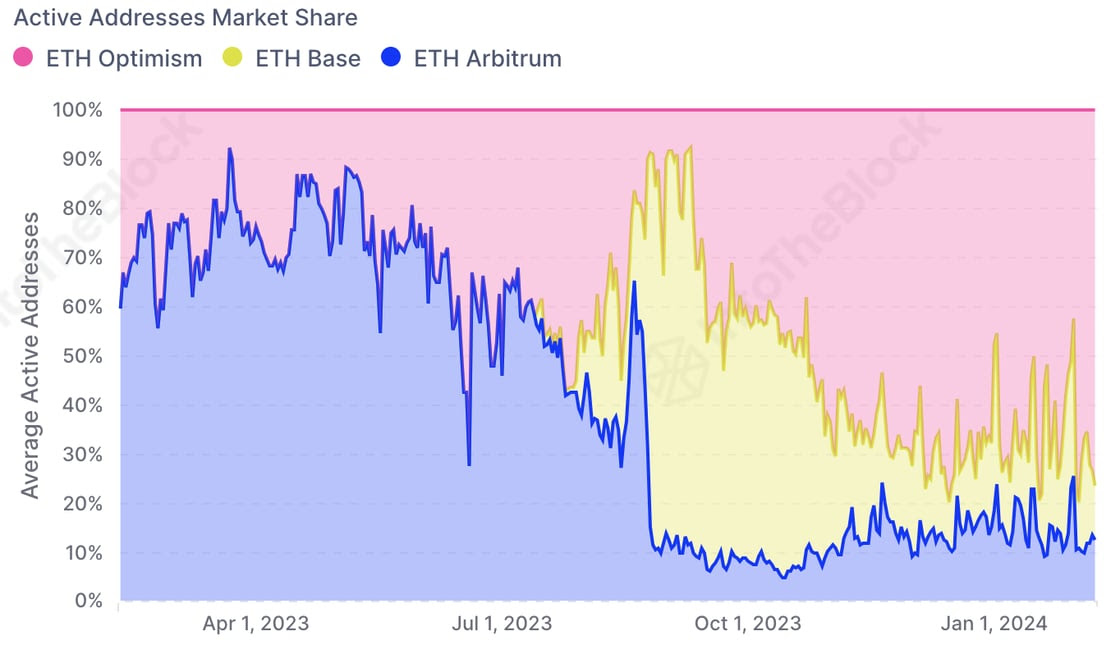
Active Address share of Optimism. Source: IntoTheBlock

OP token unlock

According to data from Token Unlocks, Optimism has scheduled a token unlock of 24.16 million OP tokens worth $85.28 million, on February 29. The previous token unlock event was a similar one that took place on January 30 and OP price declined nearly 7% in the week following the event. If the trend repeats, OP price could plummet in the week following the token unlock, in March 2024. 

OP price could rally 15% in February

OP price is currently in an uptrend, trading at $3.733, at the time of writing. The Layer 2 token is likely to rally higher, according to two technical indicators. The green bars on the Awesome Oscillator (AO) and the Moving Average Convergence/ Divergence (MACD) indicate that there is positive momentum and the uptrend is intact. 

OP price could climb towards resistance at $4.098, a level that has acted as resistance for OP since December 2023. Once OP price breaks past this resistance, the Layer 2 token could hit its 2024 peak of $4.283. This would represent 14.7%, or nearly 15% gains in the Layer 2 token. 
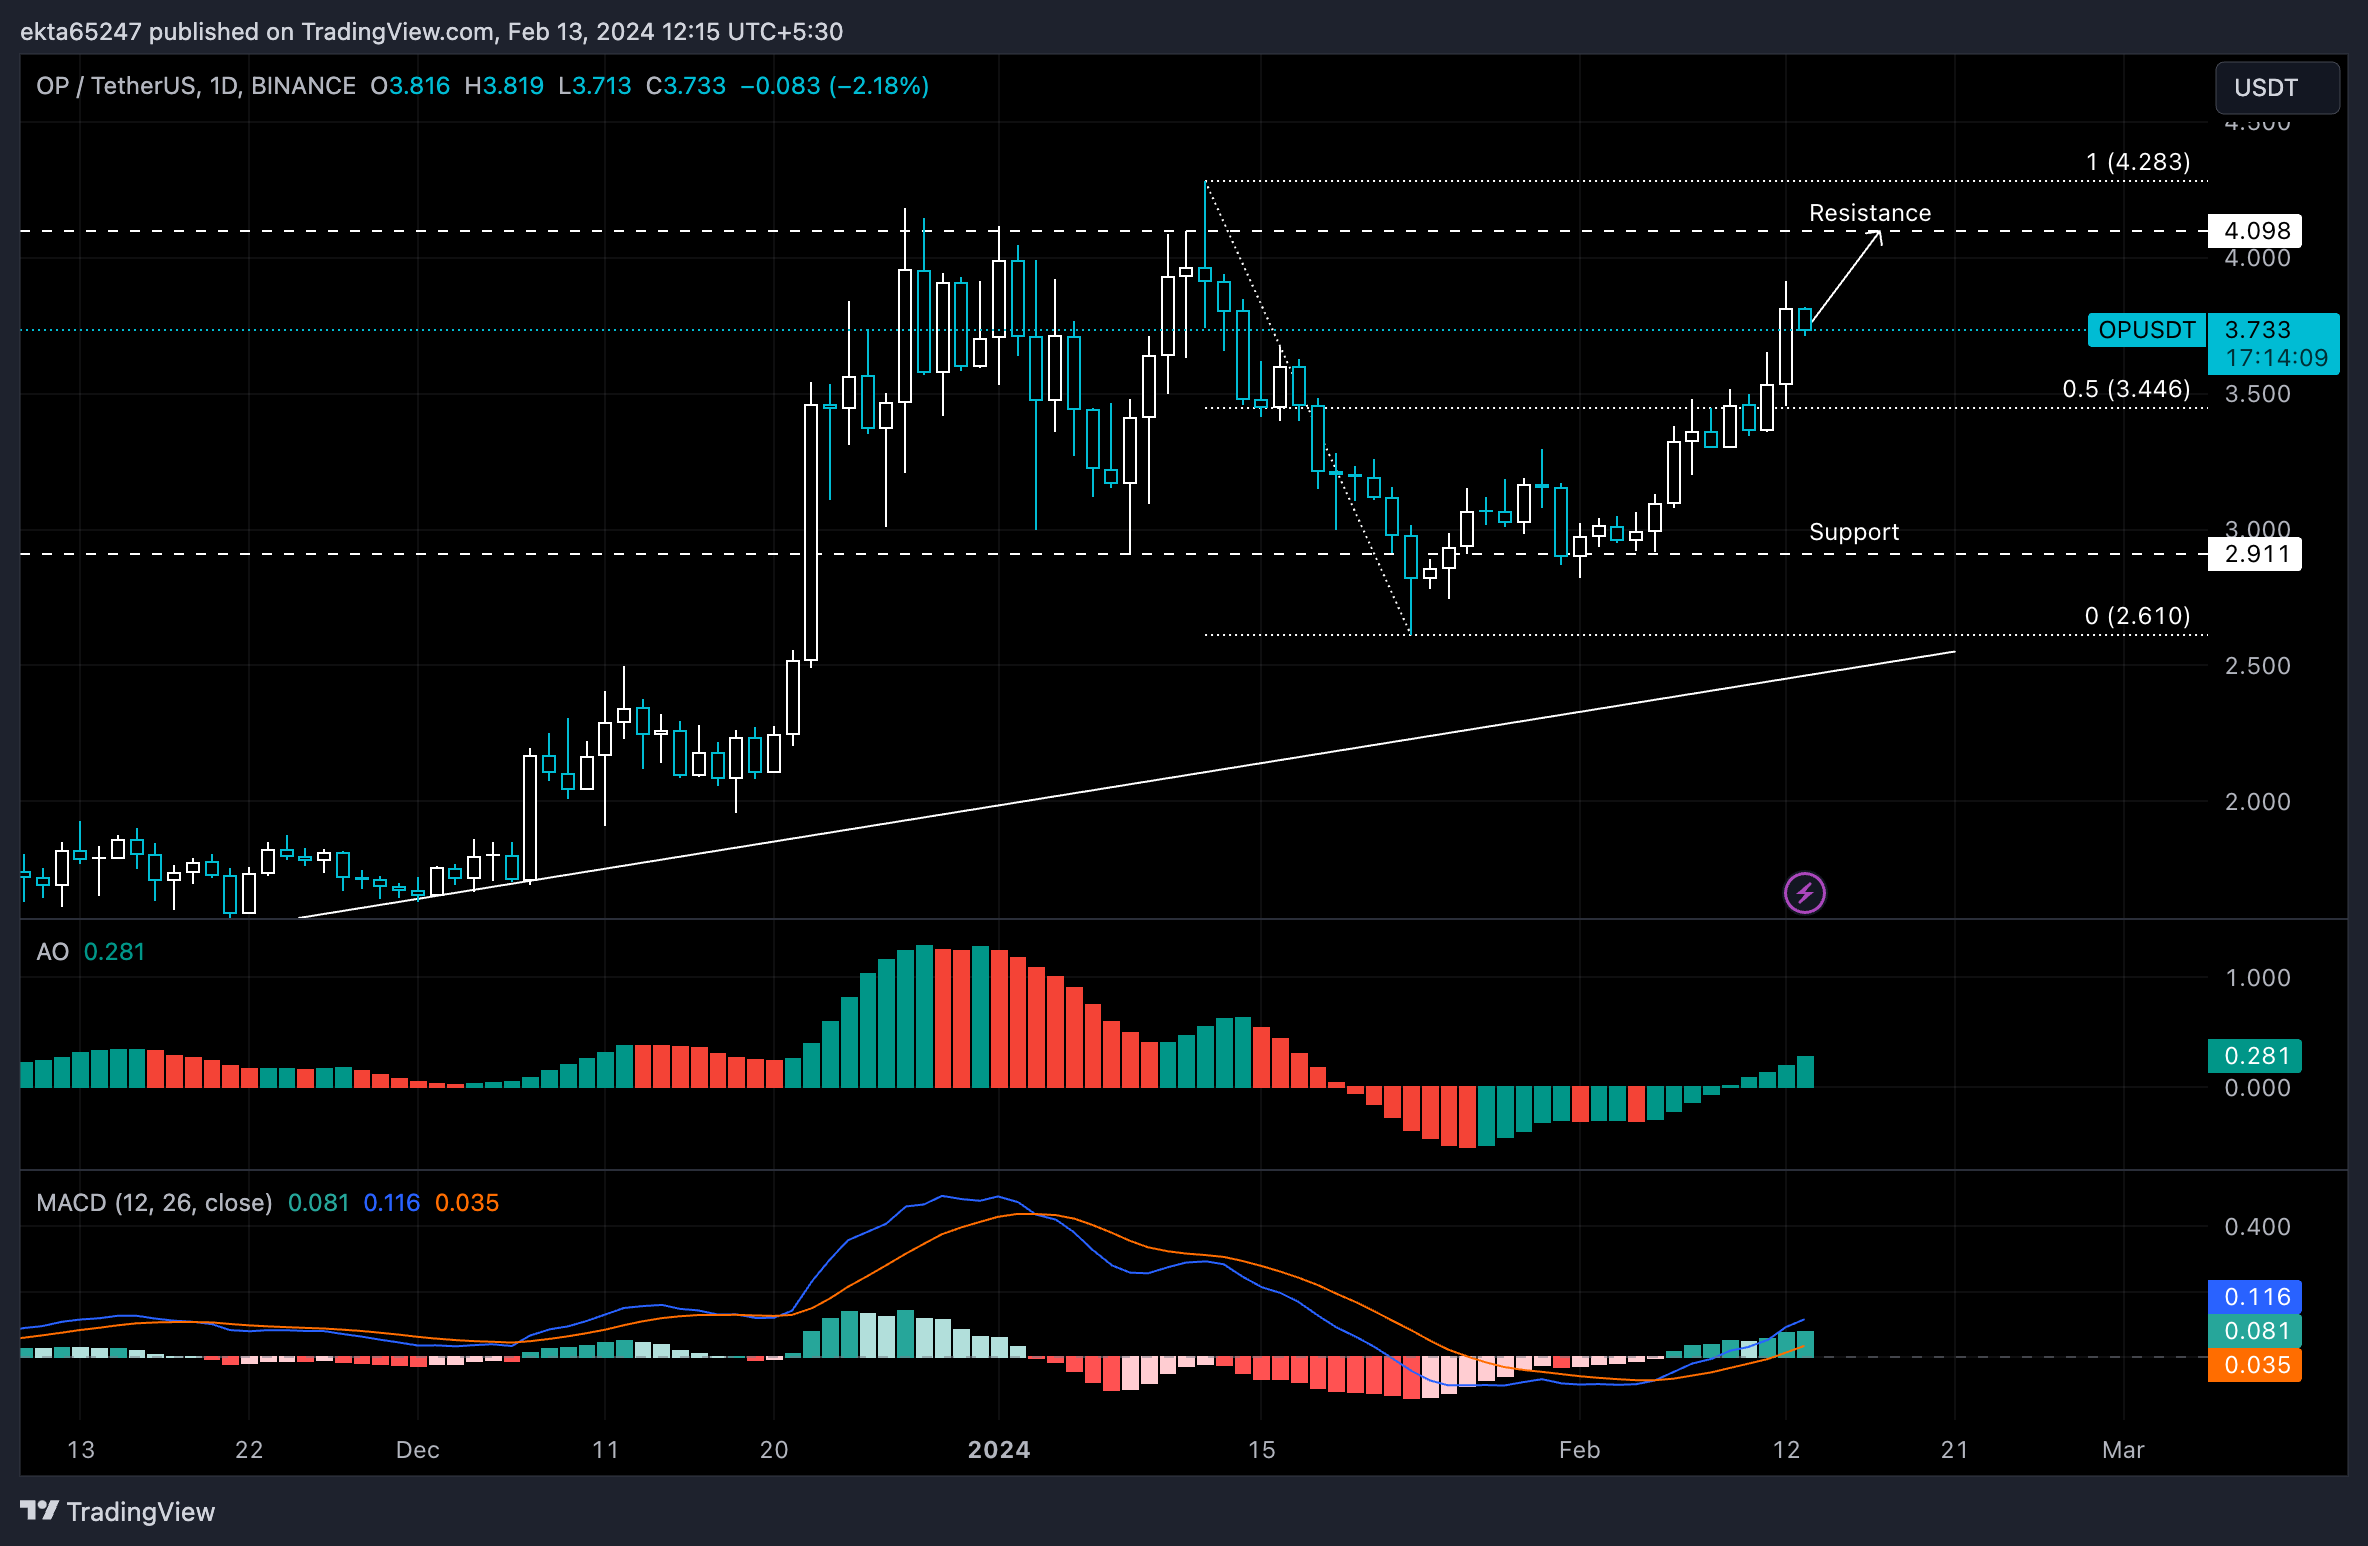
OP

OP/USDT 1-day chart 

The 50% Fibonacci retracement level of the decline from the 2024 peak to January 23 low, at $3.446 is key support for OP. A daily candlestick close below this level could invalidate the bullish thesis for OP price. In the event of further correction, OP price could nosedive to January 23 low of $2.610. 

Disclaimer: For information purposes only. Past performance is not indicative of future results.
placeholder
Ethereum Price Slips Lower — $3,000 Looms as the Key BattlegroundEthereum is attempting to recover from a $3,026 low but remains below $3,200 and the 100-hour SMA, with a bearish trend line near $3,175 capping rebounds as bulls need a clean break above $3,200 to target $3,250–$3,400, while a drop below $3,050 risks a retest of $3,000 and $2,940.
Author  Mitrade
Dec 15, Mon
Ethereum is attempting to recover from a $3,026 low but remains below $3,200 and the 100-hour SMA, with a bearish trend line near $3,175 capping rebounds as bulls need a clean break above $3,200 to target $3,250–$3,400, while a drop below $3,050 risks a retest of $3,000 and $2,940.
placeholder
Bitcoin Slides 5% as Sellers Lean In — Can BTC Reclaim $88,000?Bitcoin has dropped back below $88,000 after rolling over from $90,500, with price still trading under the 100-hour Simple Moving Average. The sell-off found a floor at $85,151, and BTC is now consolidating near that base, but rebounds are facing pressure from a bearish trend line around $89,000. Bulls need to retake $88,000–$89,000 to ease downside risk; failure to do so keeps $85,500–$85,000 and then $83,500 in play, with $80,000 as the deeper “line in the sand.” Bitcoin (BTC) is back in damage-control mode after a sharp pullback wiped out recent gains. The price failed to reclaim the $90,000–$90,500 band, rolled over, and slid through $88,500 before briefly dipping under $87,000. Buyers did show up around $85,000, but the rebound so far looks more like stabilization than a clear trend reversal. Bitcoin dips hard, finds a bid near $85,000(h3) BTC’s latest move lower began when it couldn’t build follow-through above $90,000 and $90,500. Once that upside stalled, sellers took control and pushed price down through $88,500. The slide accelerated enough to spike below $87,000, but the market didn’t free-fall. Bulls defended the $85,000 zone, printing a low at $85,151. Since then, Bitcoin has been consolidating below the 23.6% Fibonacci retracement of the drop from the $93,560 swing high to the $85,151 low — a clue that the bounce is still shallow and that sellers haven’t fully backed off yet. Structurally, BTC is still on the back foot: It’s trading below $88,000, and It remains below the 100-hour Simple Moving Average, keeping short-term trend pressure pointed downward. Resistance is layered, and $89,000 is the problem area(h3) If bulls try to turn this into a recovery, they’ll have to climb through multiple ceilings in quick succession. First, BTC faces resistance around $87,150, followed by a more meaningful barrier near $87,500. From there, the market’s attention snaps back to $88,000 — the level BTC just lost and now needs to reclaim. A close back above $88,000 would improve the tone, but it doesn’t solve the bigger issue: there’s a bearish trend line on the hourly BTC/USD chart (Kraken feed) with resistance near $89,000, which also lines up with the next technical hurdle. If BTC can push through $89,000 and hold, the rebound could extend toward $90,000, with follow-through targets at $91,000 and $91,500. But until price clears that $88,000–$89,000 zone, rallies are at risk of being sold rather than chased. If BTC fails to reclaim resistance, the downside path is clear(h3) The near-term bear case is simple: if Bitcoin can’t climb back above the $87,000 area and keep traction, sellers may attempt another leg lower. Support levels line up like this: Immediate support: $85,500 First major support: $85,000 Next support: $83,500 Then $82,500 in the near term Below that, the major “don’t break this” level is still $80,000. If BTC slips under $80,000, the risk of acceleration to the downside increases significantly — not because it’s magic, but because it’s the kind of psychological and structural level that tends to trigger forced de-risking. Indicators: momentum still leans bearish(h3) The intraday indicators aren’t offering much comfort yet: Hourly MACD is losing pace in the bearish zone. Hourly RSI remains below 50, suggesting sellers still have the upper hand on short timeframes. So while the $85,000 defense held for now, the market hasn’t flipped bullish — it’s just stopped bleeding.
Author  Mitrade
Dec 16, Tue
Bitcoin has dropped back below $88,000 after rolling over from $90,500, with price still trading under the 100-hour Simple Moving Average. The sell-off found a floor at $85,151, and BTC is now consolidating near that base, but rebounds are facing pressure from a bearish trend line around $89,000. Bulls need to retake $88,000–$89,000 to ease downside risk; failure to do so keeps $85,500–$85,000 and then $83,500 in play, with $80,000 as the deeper “line in the sand.” Bitcoin (BTC) is back in damage-control mode after a sharp pullback wiped out recent gains. The price failed to reclaim the $90,000–$90,500 band, rolled over, and slid through $88,500 before briefly dipping under $87,000. Buyers did show up around $85,000, but the rebound so far looks more like stabilization than a clear trend reversal. Bitcoin dips hard, finds a bid near $85,000(h3) BTC’s latest move lower began when it couldn’t build follow-through above $90,000 and $90,500. Once that upside stalled, sellers took control and pushed price down through $88,500. The slide accelerated enough to spike below $87,000, but the market didn’t free-fall. Bulls defended the $85,000 zone, printing a low at $85,151. Since then, Bitcoin has been consolidating below the 23.6% Fibonacci retracement of the drop from the $93,560 swing high to the $85,151 low — a clue that the bounce is still shallow and that sellers haven’t fully backed off yet. Structurally, BTC is still on the back foot: It’s trading below $88,000, and It remains below the 100-hour Simple Moving Average, keeping short-term trend pressure pointed downward. Resistance is layered, and $89,000 is the problem area(h3) If bulls try to turn this into a recovery, they’ll have to climb through multiple ceilings in quick succession. First, BTC faces resistance around $87,150, followed by a more meaningful barrier near $87,500. From there, the market’s attention snaps back to $88,000 — the level BTC just lost and now needs to reclaim. A close back above $88,000 would improve the tone, but it doesn’t solve the bigger issue: there’s a bearish trend line on the hourly BTC/USD chart (Kraken feed) with resistance near $89,000, which also lines up with the next technical hurdle. If BTC can push through $89,000 and hold, the rebound could extend toward $90,000, with follow-through targets at $91,000 and $91,500. But until price clears that $88,000–$89,000 zone, rallies are at risk of being sold rather than chased. If BTC fails to reclaim resistance, the downside path is clear(h3) The near-term bear case is simple: if Bitcoin can’t climb back above the $87,000 area and keep traction, sellers may attempt another leg lower. Support levels line up like this: Immediate support: $85,500 First major support: $85,000 Next support: $83,500 Then $82,500 in the near term Below that, the major “don’t break this” level is still $80,000. If BTC slips under $80,000, the risk of acceleration to the downside increases significantly — not because it’s magic, but because it’s the kind of psychological and structural level that tends to trigger forced de-risking. Indicators: momentum still leans bearish(h3) The intraday indicators aren’t offering much comfort yet: Hourly MACD is losing pace in the bearish zone. Hourly RSI remains below 50, suggesting sellers still have the upper hand on short timeframes. So while the $85,000 defense held for now, the market hasn’t flipped bullish — it’s just stopped bleeding.
placeholder
December Santa Claus Rally: New highs in sight for US and European stocks?Historical data show a rising trend of US and European stocks in December. If the momentum is strong, fund managers may rush in with a buying frenzy.
Author  Mitrade
Yesterday 02: 50
Historical data show a rising trend of US and European stocks in December. If the momentum is strong, fund managers may rush in with a buying frenzy.
placeholder
XRP’s Price Action Flashes a Warning Even as ETF Flows Stay PositiveXRP’s structure remains weak despite 18 straight positive closes in spot XRP ETFs, with analysts warning that $1.98 and other nearby resistance zones could cap rebounds unless the YO region is reclaimed, while deeper downside scenarios keep $1.53 on watch as a potential (not guaranteed) accumulation area.
Author  Mitrade
Yesterday 06: 37
XRP’s structure remains weak despite 18 straight positive closes in spot XRP ETFs, with analysts warning that $1.98 and other nearby resistance zones could cap rebounds unless the YO region is reclaimed, while deeper downside scenarios keep $1.53 on watch as a potential (not guaranteed) accumulation area.
placeholder
Gold declines on profit-taking, USD strength ahead of US CPI releaseGold price (XAU/USD) edges lower below $4,350 during the Asian trading hours on Thursday. The precious metal retreats from seven-week highs amid some profit-taking and a rebound in the US Dollar (USD).
Author  FXStreet
7 hours ago
Gold price (XAU/USD) edges lower below $4,350 during the Asian trading hours on Thursday. The precious metal retreats from seven-week highs amid some profit-taking and a rebound in the US Dollar (USD).
goTop
quote