

Expert Sets $285,000 Bitcoin Price Target Based On Quantile Model

Source Newsbtc

Sina—a professor, consultant, and co-founder & COO of 21stCapital.com—is projecting that the Bitcoin price could rise as high as $285,000 by the end of 2025 in a new analysis shared on X. Utilizing a quantile regression model, Sina identifies distinct phases in Bitcoin’s market cycle.

Can Bitcoin Price Skyrocket Above $200,000?

The model identifies the Cold Zone (<33%) as the price range between $55,000 and $85,000. This zone represents the lowest possible range by the end of 2025 and suggests a period ideal to “aggressively accumulate.”

The Warm Zone (33-66%), spanning from $85,000 to $136,000, marks a period where the market gains momentum, and mainstream attention intensifies. During this phase, rapid price growth is expected as the “train leaves the station.” Sina recommends a standard accumulation strategy here, such as dollar-cost averaging (DCA), to steadily increase holdings.

The most critical phase, the Hot Zone (>66%), ranges from $136,000 to $285,000. This zone is characterized by heightened volatility and significant price swings as mass adoption peaks and leveraged positions become prevalent.
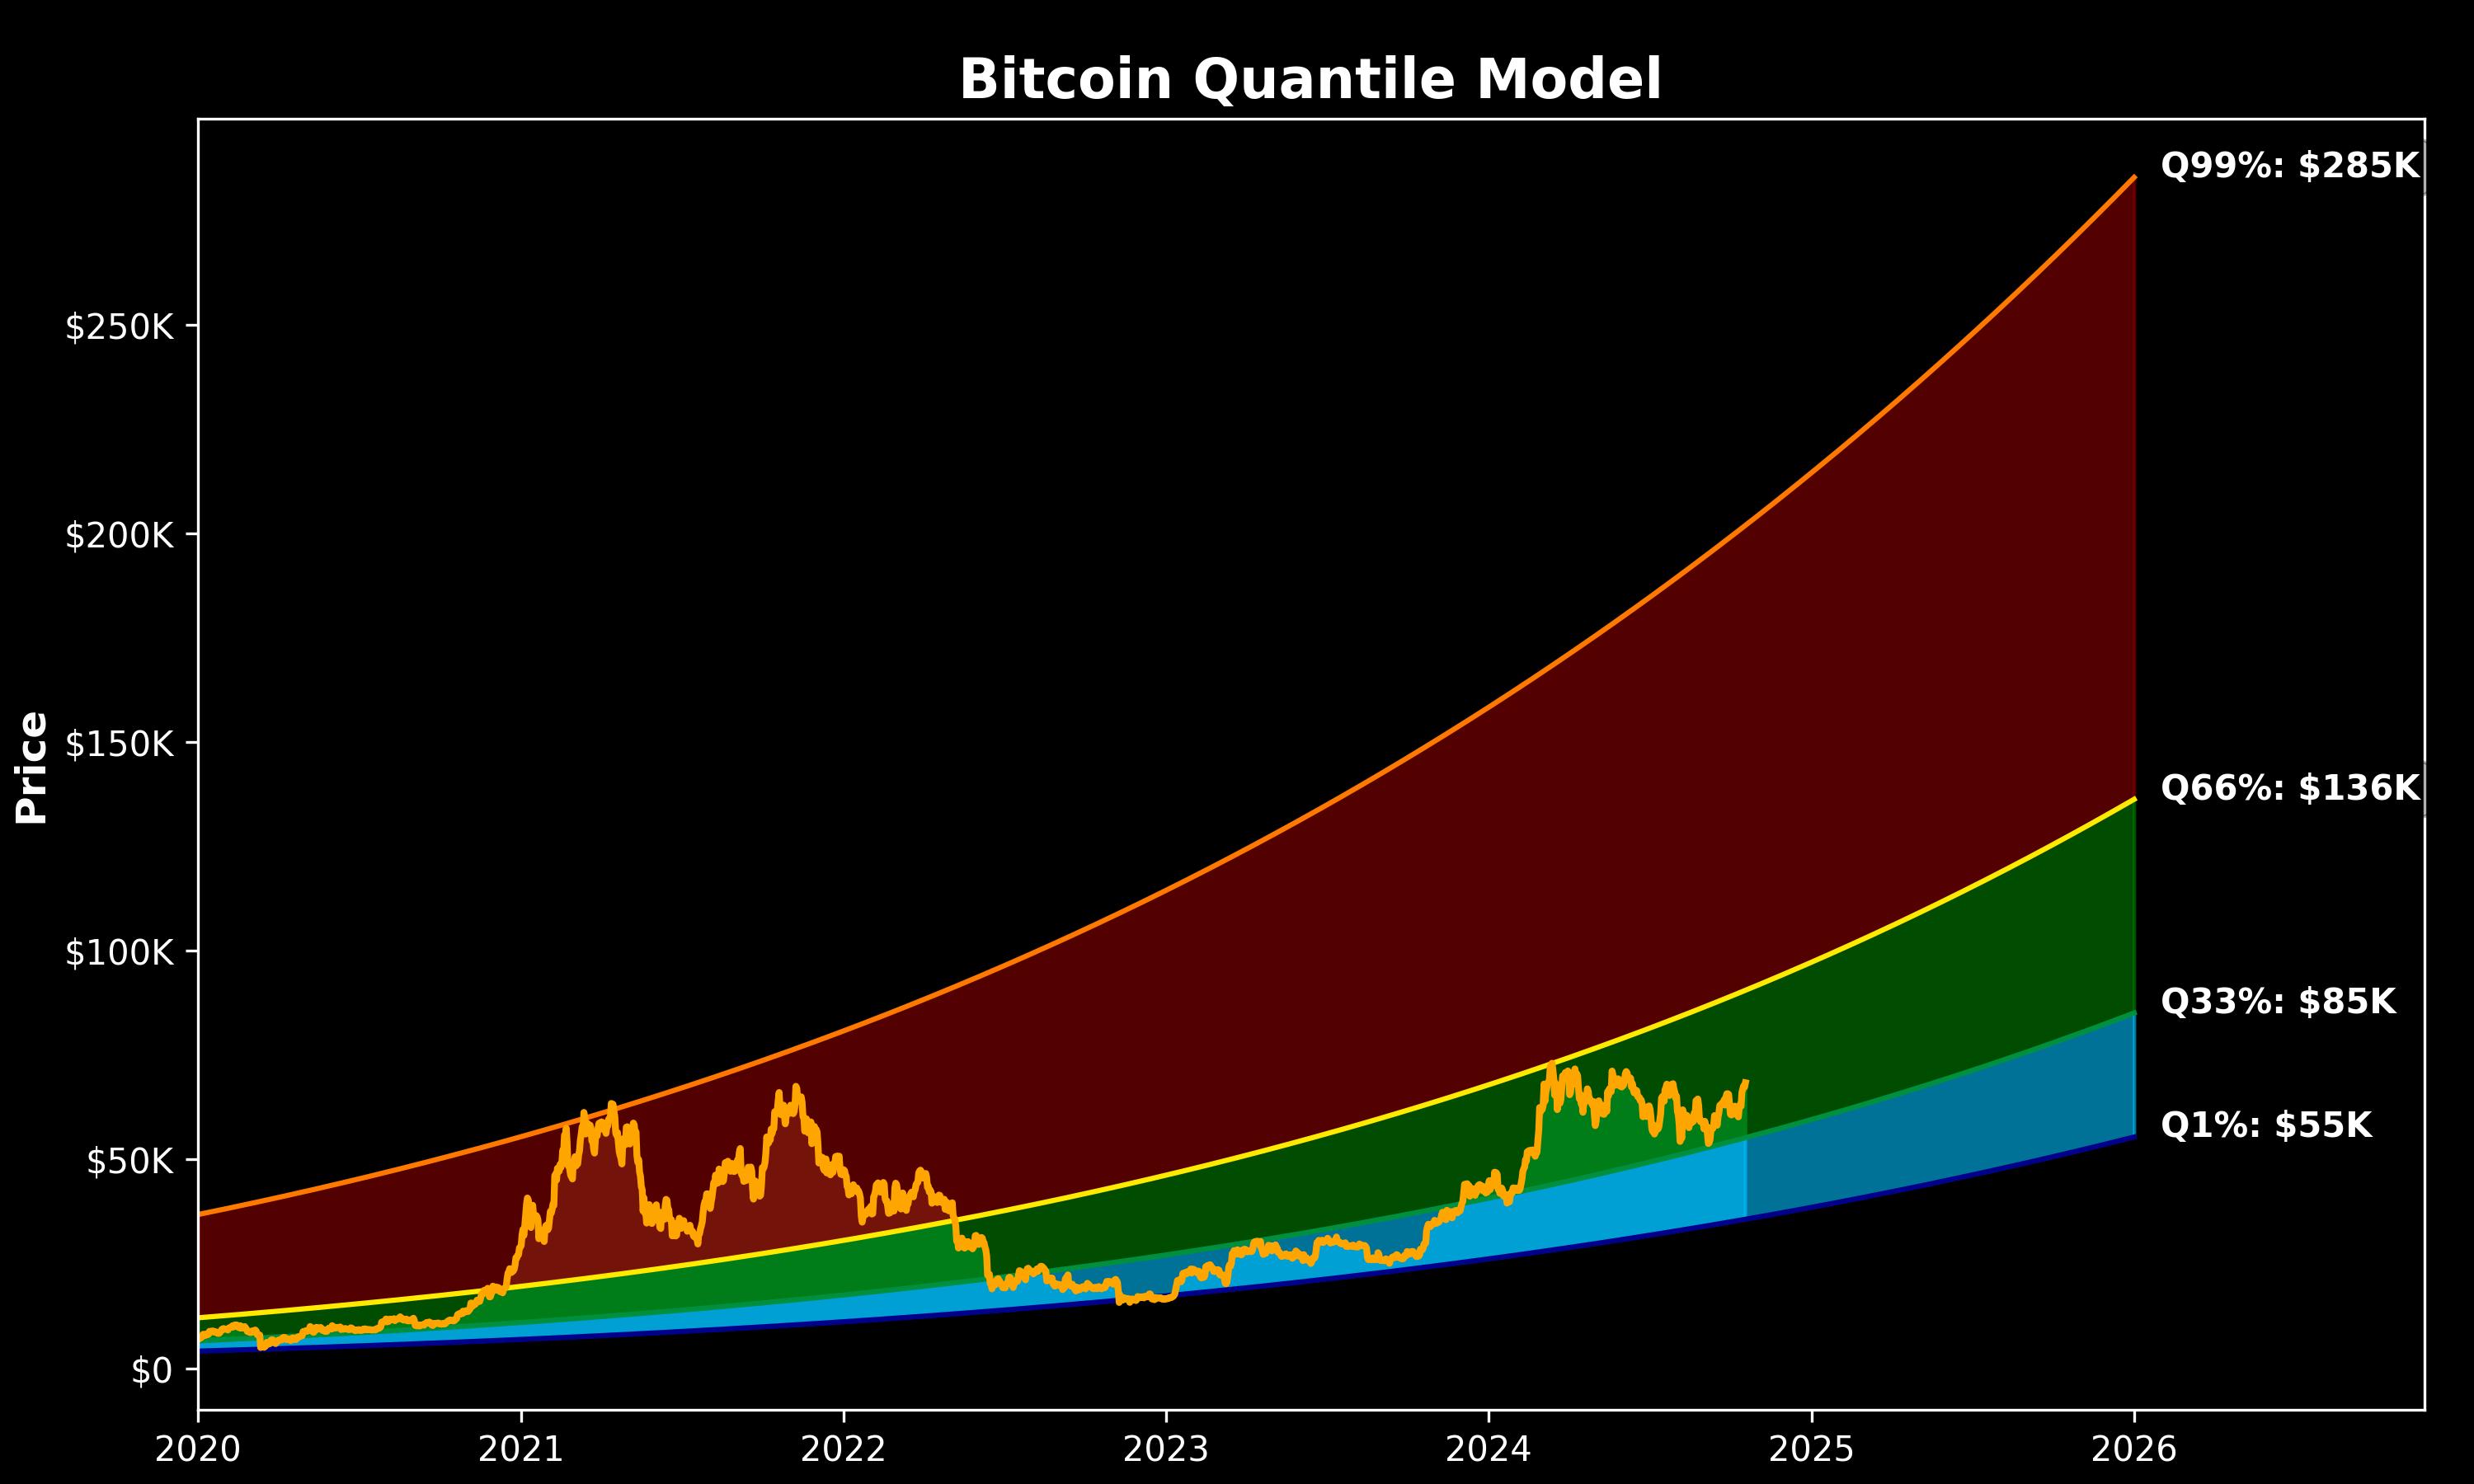
Bitcoin Quantile Model

While there is substantial room for upside, the risk of reversals escalates rapidly. Sina advises investors to either hold and enjoy potential gains or consider gradually exiting positions based on risk assessments, particularly since historical tops occur in the 90th to 99th quantile range. Notably, the 90th quantile starts at $211,000.

What astonishes Sina is how these 33% quantile ranges align seamlessly with Bitcoin’s historical phase transitions. He notes that Bitcoin tends to spend exactly one-third of its time in each zone before transitioning to the next, almost like clockwork. This pattern means that most of the bear market occurs below the 33% quantile, while bull market euphoria begins above the 66% quantile.

Renowned crypto analyst PlanC (@TheRealPlanC) acknowledged Sina’s model, commenting that it is a “perfect explanation—super clear.” Sina, in turn, credited PlanC for the foundational work that influenced his own model.

PlanC has also recently updated his “Power Law Probability Model,” which forecasts Bitcoin prices ranging from $189,733 to $245,264 for the 97% to 99.9% quantile and $145,182 to $189,733 for the 90% to 97% quantile. He emphasizes that despite appearances, the underlying data follows a power-law relationship, independent of how it’s plotted—be it linear, log-linear, or log-log scales.
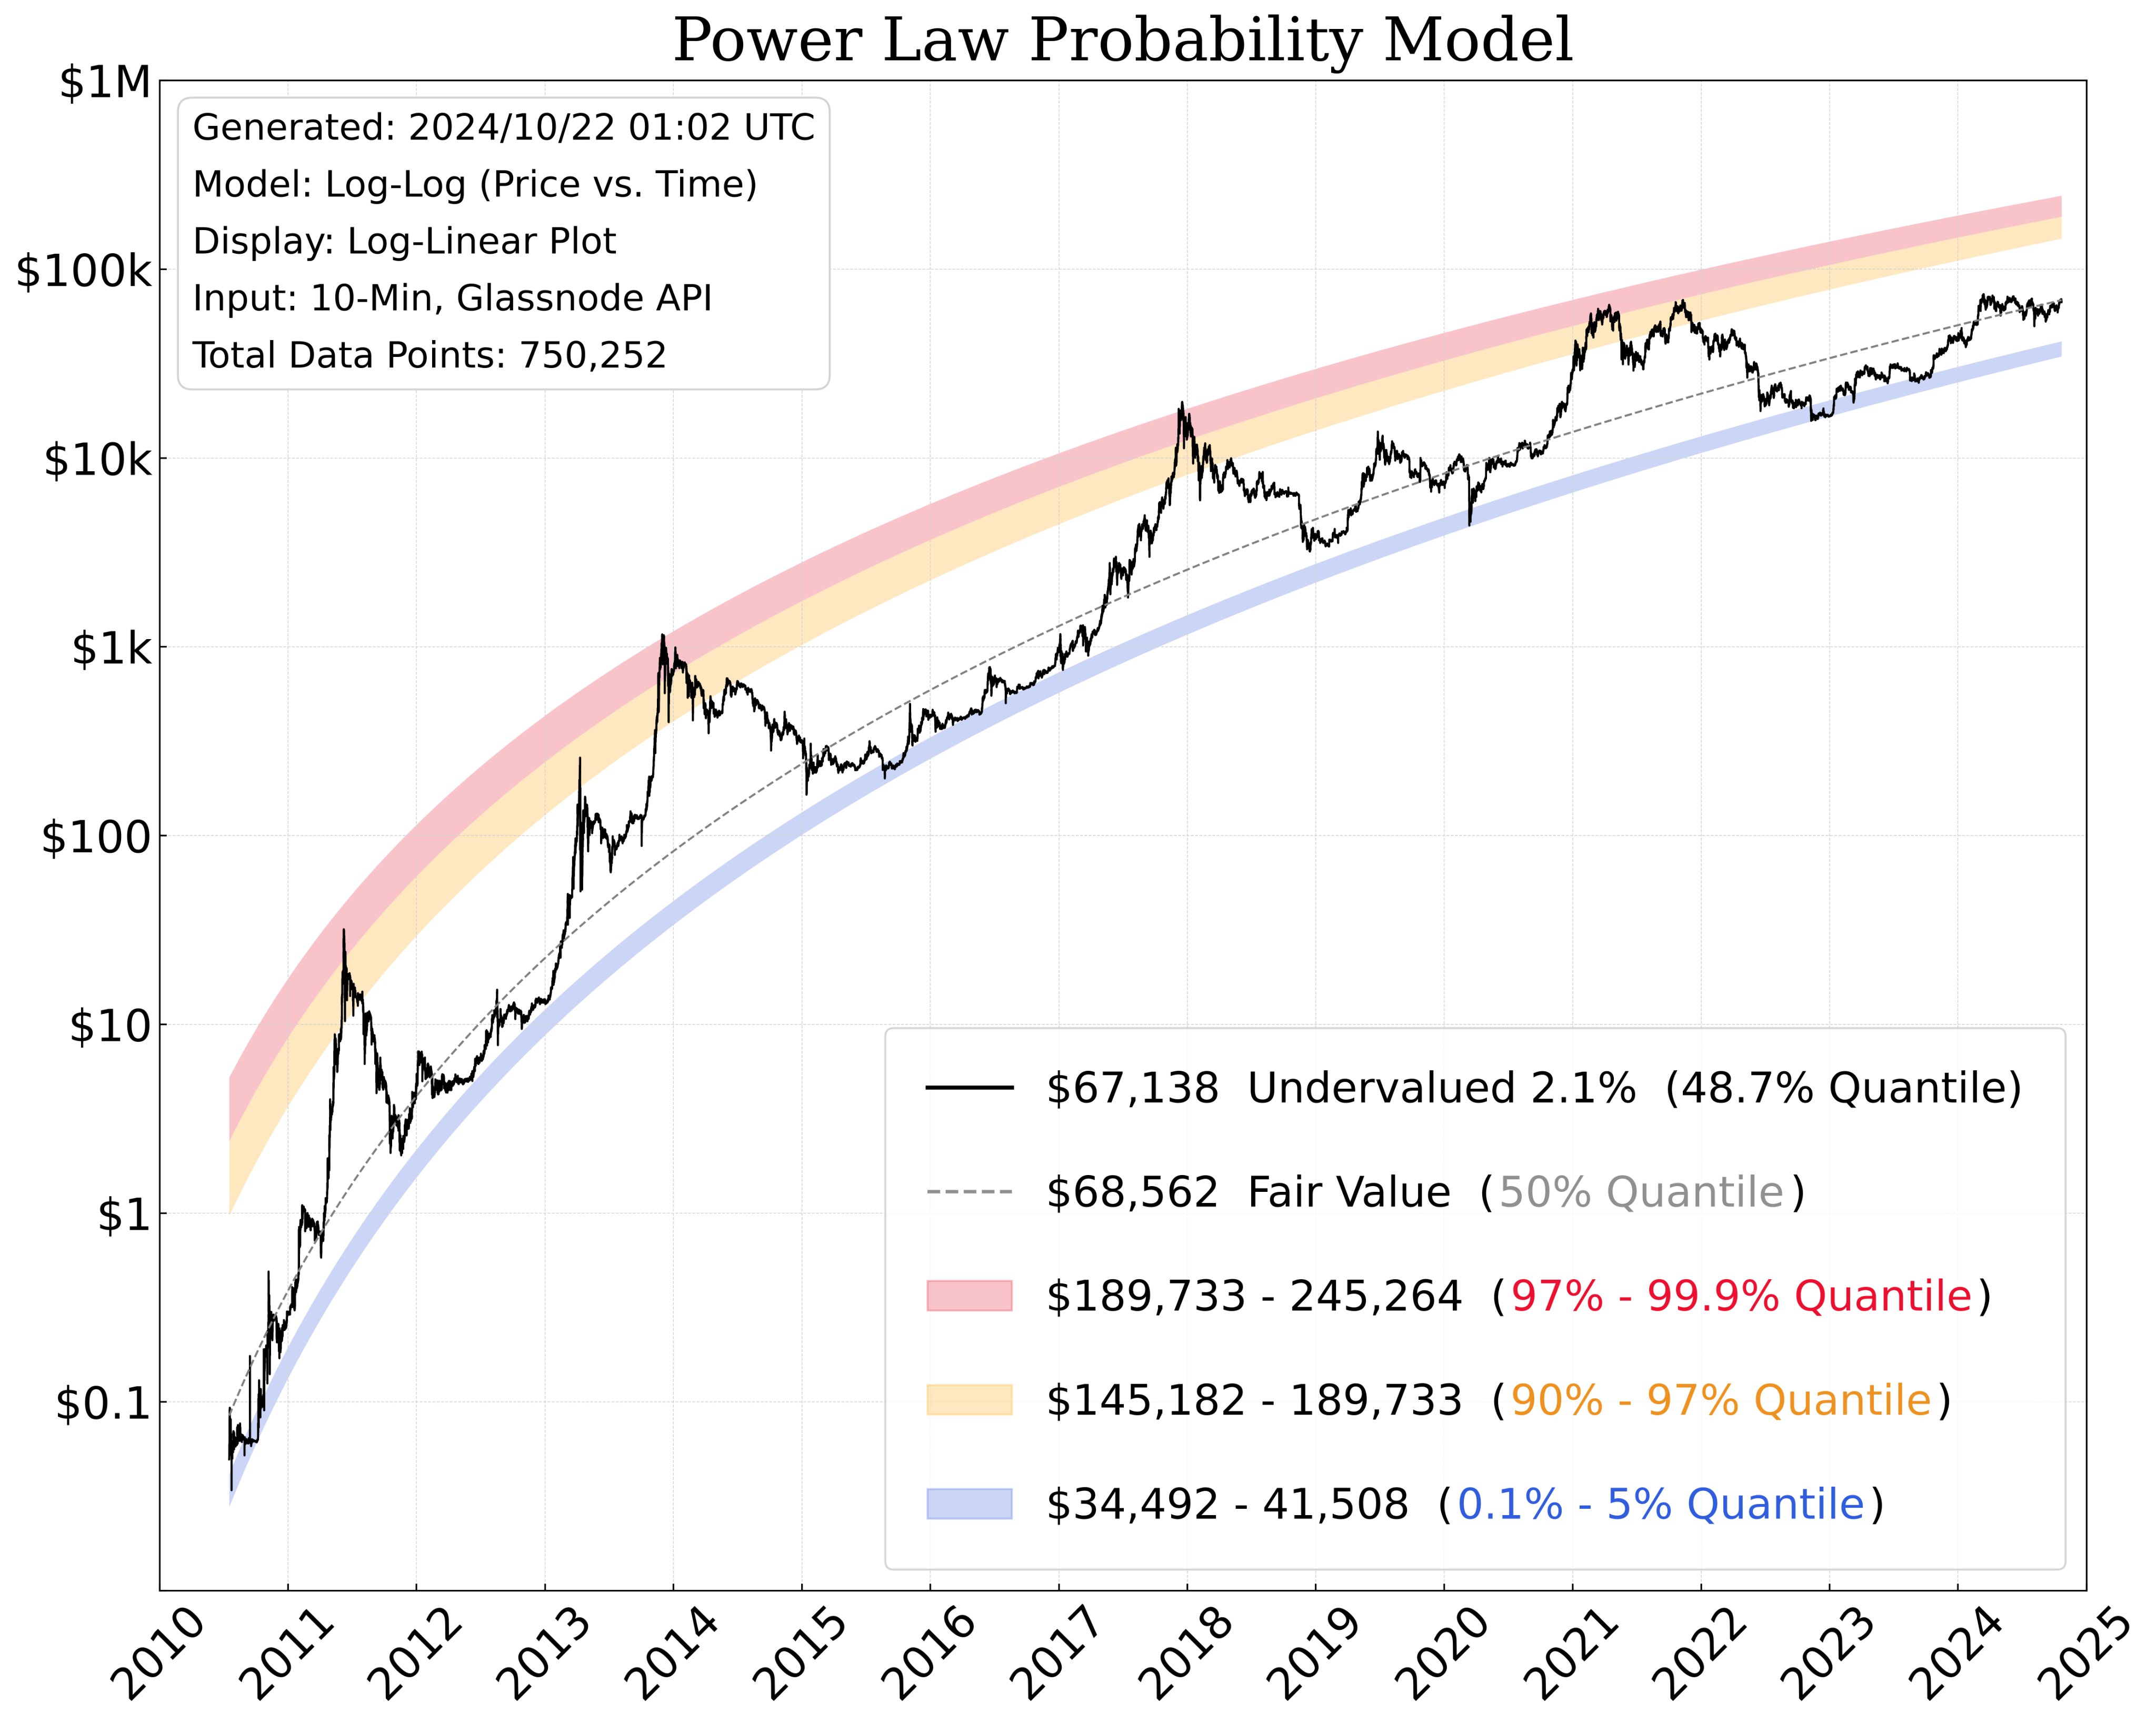
Power Law Probability Model

“The data follows a log-log relationship with quantile regressions, whereas the rainbow chart uses logarithmic regression with a log-linear relationship. […] I am not ‘drawing’ these lines. These are quantile regressions of the log of price vs. time, based on all the data we have to date,” he explains.

To contextualize the model’s predictive capabilities, PlanC elaborates on the significance of various quantiles. The 99.9% quantile means the price has been above this line only 0.1% of the time, equating to just one day out of every 1,000 days—a very rare event. The 99% quantile indicates the price has exceeded this line 1% of the time, or one day out of every 100 days, also considered rare. Conversely, the 0.1% quantile reflects that the price has fallen below this line only 0.1% of the time.

At press time, BTC traded at $67,121.
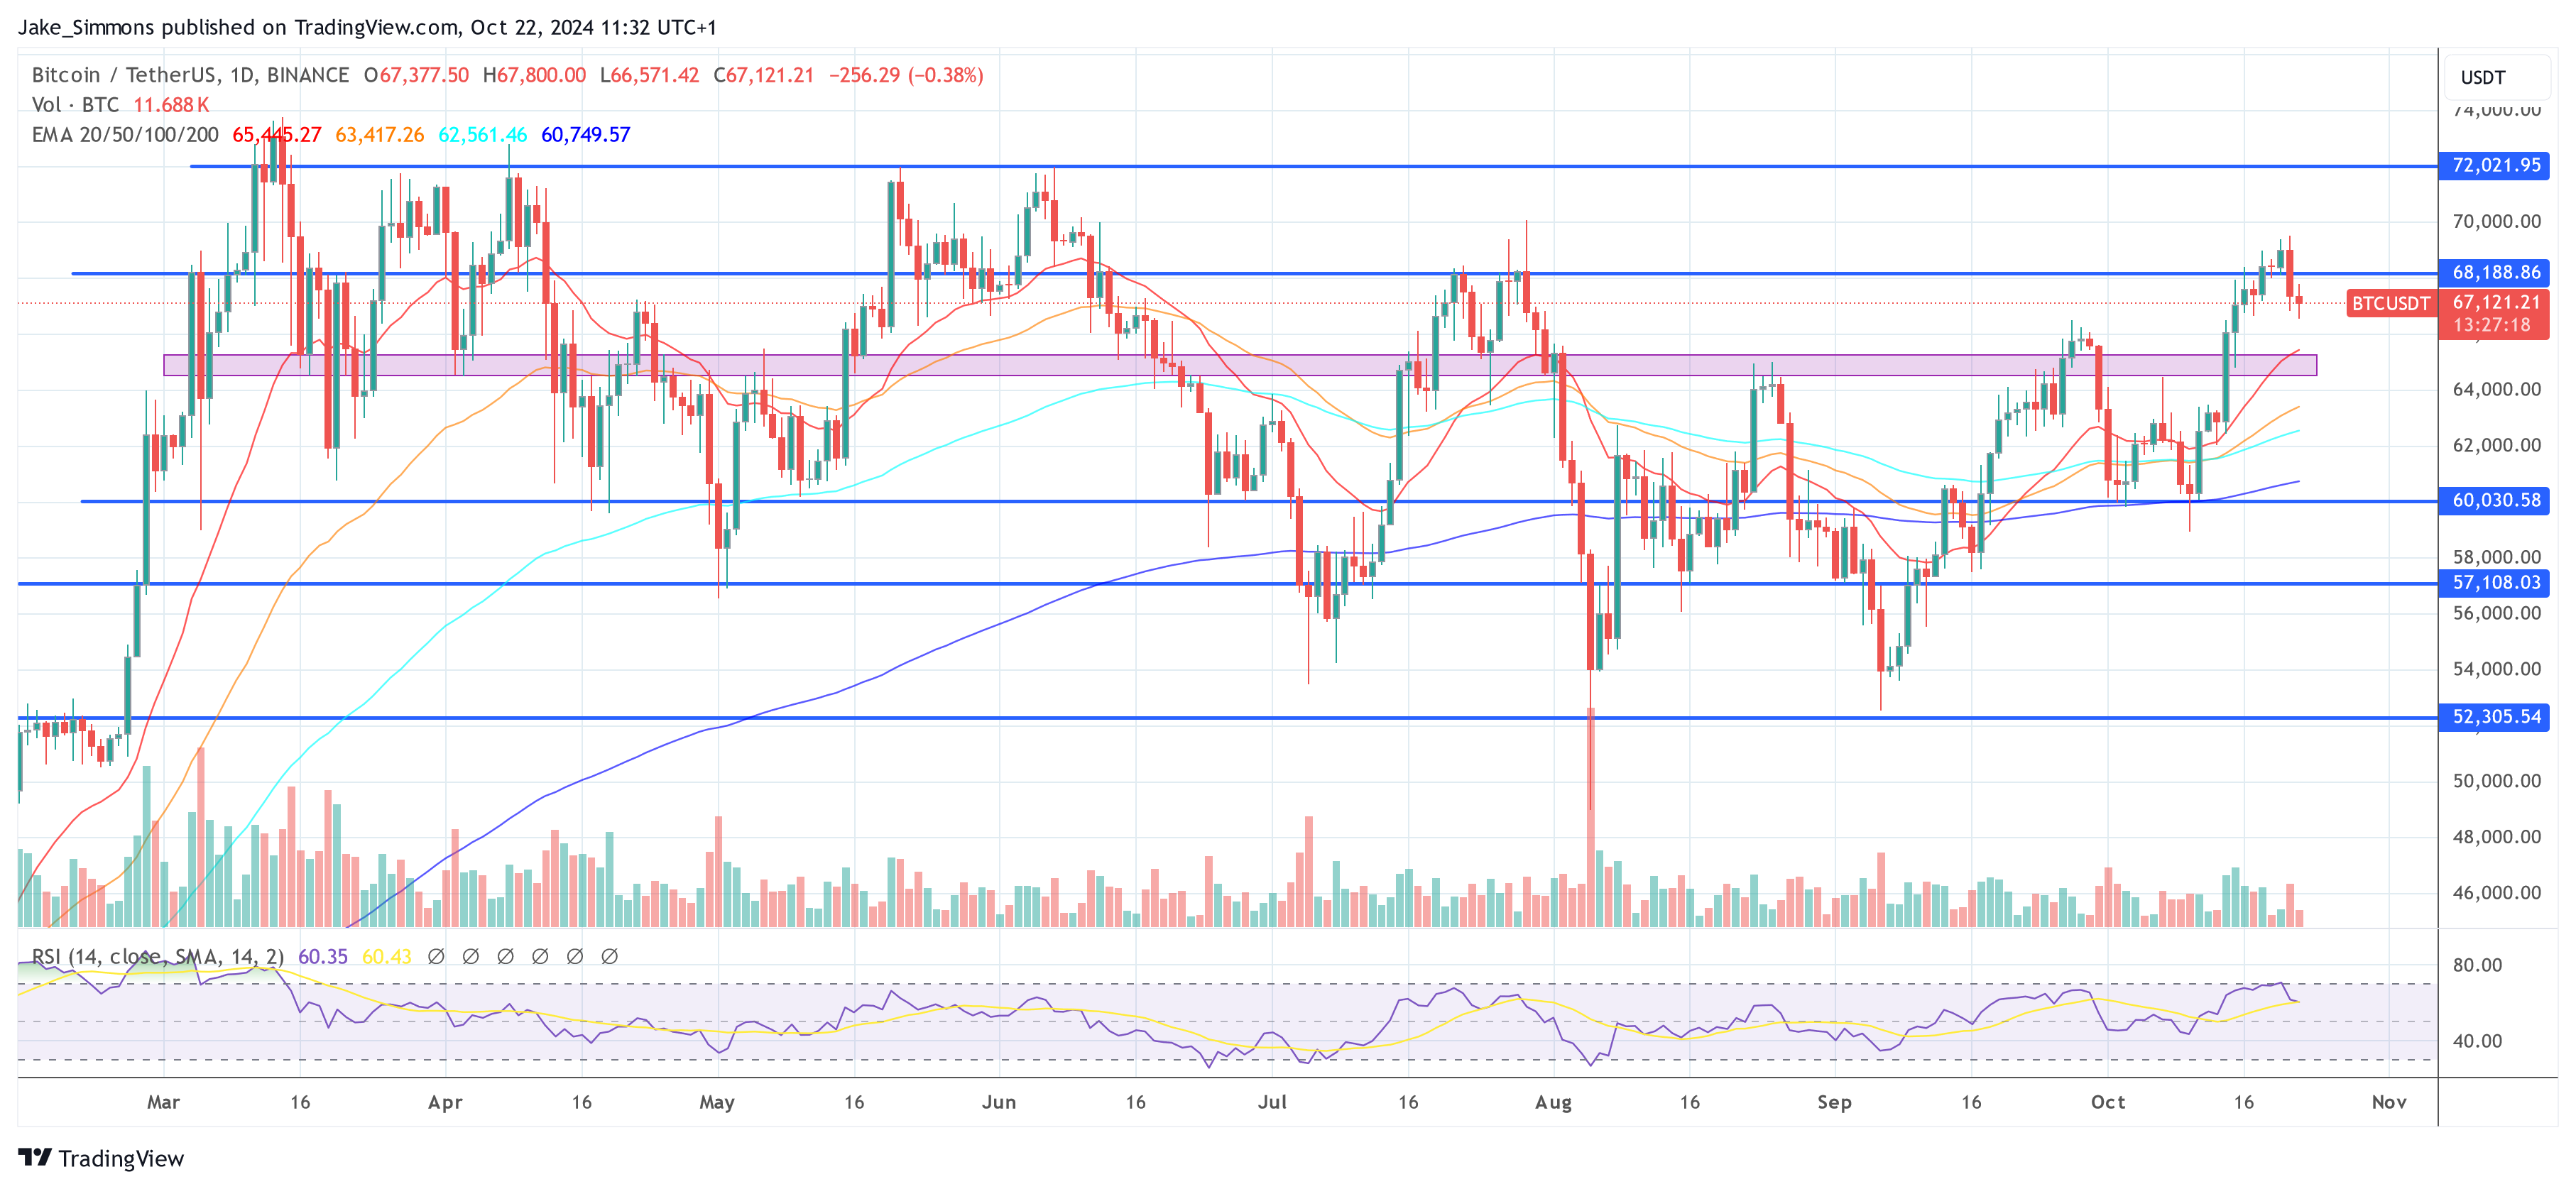
Bitcoin price
Disclaimer: For information purposes only. Past performance is not indicative of future results.
placeholder
Nvidia reports tomorrow with an interim CEO — $108 billion is the easy numberNvidia closed at 162.85 on Friday, down 12.75% on the week and 32% below its 6 October record, with market value down to $3.92 trillion. The Q3 bar is $108 billion ±2%, and consensus already sits at $108.7 ~ 108.8 billion, so the revenue line is not where the surprise lives. The number that decides the reaction is the 71 ~ 72% Q4 gross-margin trough, followed by a Q4 guide against a $124.9 billion consensus. This piece prices the print, marks the 158.39 line and lays out the three scenarios in a table.
Author  Irene Q.
Yesterday 02: 11
Nvidia closed at 162.85 on Friday, down 12.75% on the week and 32% below its 6 October record, with market value down to $3.92 trillion. The Q3 bar is $108 billion ±2%, and consensus already sits at $108.7 ~ 108.8 billion, so the revenue line is not where the surprise lives. The number that decides the reaction is the 71 ~ 72% Q4 gross-margin trough, followed by a Q4 guide against a $124.9 billion consensus. This piece prices the print, marks the 158.39 line and lays out the three scenarios in a table.
placeholder
Anthropic is six times oversubscribed at $1.4 trillion while Nvidia is down 32% — the AI trade has two pricesAnthropic lists on Nasdaq as ANT on Thursday at $70 ~ $78 a share, raising up to $64.4 billion at a target valuation near $1.4 trillion, and the book is reportedly six times covered. In the same six weeks, Nvidia has fallen 32% and the QQQ is 10.9% below its October peak. Private capital and public markets are marking the same AI complex at two very different prices. This piece separates the two books: what the S-1 shows, who is anchoring the $26 billion private placement, and what Thursday's debut would have to do to change the public tape.
Author  Irene Q.
Yesterday 02: 27
Anthropic lists on Nasdaq as ANT on Thursday at $70 ~ $78 a share, raising up to $64.4 billion at a target valuation near $1.4 trillion, and the book is reportedly six times covered. In the same six weeks, Nvidia has fallen 32% and the QQQ is 10.9% below its October peak. Private capital and public markets are marking the same AI complex at two very different prices. This piece separates the two books: what the S-1 shows, who is anchoring the $26 billion private placement, and what Thursday's debut would have to do to change the public tape.
placeholder
Weekly Report: The index rose 2.5% while Nvidia fell 12.7% — two equity divergences, one should closeThe S&P 500 rose 2.51% to 7,561.67 and the QQQ rose 3.63% to 679.89 last week, while Nvidia fell 12.75% to 162.85 — a sixth straight weekly loss and 32% below its October record. In the same five sessions, energy equities rose 5.42% while WTI fell 2.52%. Both pairs normally move together (60-day correlations of +0.64 and +0.58). This report ranks which divergence closes first, with the trigger for each.
Author  Irene Q.
23 hours ago
The S&P 500 rose 2.51% to 7,561.67 and the QQQ rose 3.63% to 679.89 last week, while Nvidia fell 12.75% to 162.85 — a sixth straight weekly loss and 32% below its October record. In the same five sessions, energy equities rose 5.42% while WTI fell 2.52%. Both pairs normally move together (60-day correlations of +0.64 and +0.58). This report ranks which divergence closes first, with the trigger for each.
placeholder
Gold Price Analysis Today | Forex Gold Analysis | XAU/USD Analysis - November 16, 2026Get the latest gold price analysis, forex gold insights, and XAU/USD analysis for November 16, 2026. Read on for the details.
Author  Mitrade
23 hours ago
Get the latest gold price analysis, forex gold insights, and XAU/USD analysis for November 16, 2026. Read on for the details.
placeholder
Weekly Report: DXY 103.41, 10-year 5.15%, AUD carry 3bp — three FX regimes flipped in one weekThe dollar index rose 1.09% to 103.41, a 19-month high, while the US 10-year closed at 5.154% and the Australia-US two-year spread collapsed to about 3 basis points from 36. EURUSD fell 1.59% to 1.1024, USDJPY rose 1.51% to 159.78 and AUDUSD fell 1.79% to 0.6764, a 10-month low. Three FX regimes — the broad dollar, the US rate level and the Australian carry premium — flipped in the same week. This report marks the thresholds, ranks which one can flip back first, and lists the week's calendar.
Author  Irene Q.
23 hours ago
The dollar index rose 1.09% to 103.41, a 19-month high, while the US 10-year closed at 5.154% and the Australia-US two-year spread collapsed to about 3 basis points from 36. EURUSD fell 1.59% to 1.1024, USDJPY rose 1.51% to 159.78 and AUDUSD fell 1.79% to 0.6764, a 10-month low. Three FX regimes — the broad dollar, the US rate level and the Australian carry premium — flipped in the same week. This report marks the thresholds, ranks which one can flip back first, and lists the week's calendar.
goTop
quote