

Ethereum risks decline to $2,395 amid impressive ETF inflows
- Ethereum ETFs flipped out of six weeks of negative flows with $85 million in inflows last week.
- Ethereum Foundation has sold 3,766 ETH worth $10.46 million in 2024.
- Ethereum could decline to $2,395 if it sustains an extended move below the $2,595 support level and key SMAs.
Ethereum (ETH) is down 2% on Monday, struggling around the $2,595 key support level after the ETH Foundation continued its selling spree. However, the slow price movement in the past few hours isn't reflective of the rising inflows across US spot Ethereum ETFs.
Daily digest market movers: Ethereum ETFs see weekly net inflows, ETH Foundation continues selling
US spot Ethereum ETFs recorded net inflows of $85 million last week, their first weekly positive flows after six consecutive weeks of outflows, per Farside Investors data. The positive week was led by inflows in BlackRock's ETHA and Fidelity's FETH, totaling $95.5 million and $64.8 million, respectively.
ETHA's inflows also saw it surge past the $1 billion mark in net assets. According to Nate Geraci, President of the ETF Store, the move places it in the top 20% of all 3,700 ETFs in the US within two weeks of launch.
Several crypto community members expect ETH ETFs to continue seeing inflows in October, considering it's historically been a positive month for Ethereum and the entire crypto market.
Meanwhile, the Ethereum Foundation sold 100 ETH for 263,000 DAI on Monday, taking its total sales in 2024 to 3,766 ETH ($10.46 million), per data from blockchain analytics provider Lookonchain.
While several community members have raised concerns about the Ethereum Foundation sales, co-founder Vitalik Buterin shared that the proceeds were targeted toward donating to research and projects to improve the Ethereum ecosystem. The Ethereum Foundation is also preparing a financial report detailing its total spending, according to Ethereum researcher Justin Drake.
ETH technical analysis: Ethereum risk decline if it breaks below $2,595 support and SMAs
Ethereum traded around $2,600 on Monday, down 2% on the day. In the past 24 hours, ETH has seen $29.94 million in liquidations, with long and short liquidations accounting for $24.9 million and $5.04 million, respectively.
On the 4-hour chart, Ethereum is trading within a key rectangle channel after seeing a rejection around the resistance at $2,707 on Friday. This marks the second time prices have failed to move past the $2,707 level.
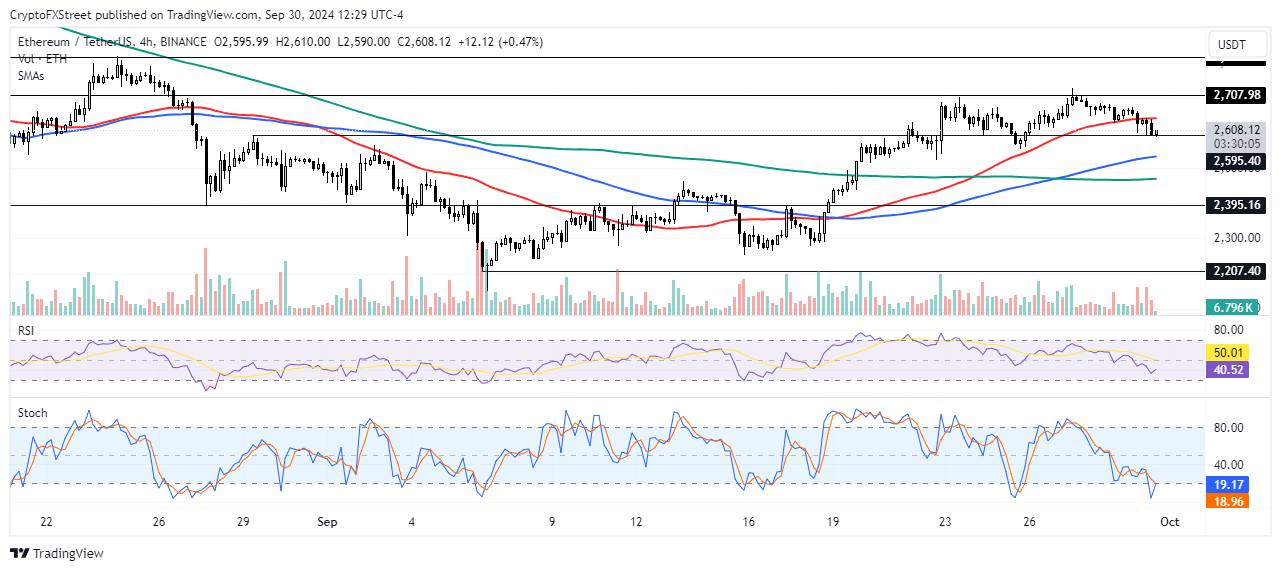
ETH/USDT 4-hour chart
In the early hours of Monday, the $2,595 support level prevented a further decline. A retest of this level could see the support fail, especially after ETH crossed below its 50-day Simple Moving Average (SMA).
If ETH declines, the 200-day and 100-day SMAs could provide support on the way down. However, ETH could fall to $2,395 if SMA support fails to hold.
The Relative Strength Index (RSI) is below its neutral level, and the Stochastic Oscillator is approaching the oversold region, indicating rising bearish momentum.
A candlestick close above $2,707 will invalidate the slightly bearish thesis.
Ethereum FAQs
Ethereum is a decentralized open-source blockchain with smart contracts functionality. Its native currency Ether (ETH), is the second-largest cryptocurrency and number one altcoin by market capitalization. The Ethereum network is tailored for building crypto solutions like decentralized finance (DeFi), GameFi, non-fungible tokens (NFTs), decentralized autonomous organizations (DAOs), etc.
Ethereum is a public decentralized blockchain technology, where developers can build and deploy applications that function without the need for a central authority. To make this easier, the network leverages the Solidity programming language and Ethereum virtual machine which helps developers create and launch applications with smart contract functionality.
Smart contracts are publicly verifiable codes that automates agreements between two or more parties. Basically, these codes self-execute encoded actions when predetermined conditions are met.
Staking is a process of earning yield on your idle crypto assets by locking them in a crypto protocol for a specified duration as a means of contributing to its security. Ethereum transitioned from a Proof-of-Work (PoW) to a Proof-of-Stake (PoS) consensus mechanism on September 15, 2022, in an event christened “The Merge.” The Merge was a key part of Ethereum's roadmap to achieve high-level scalability, decentralization and security while remaining sustainable. Unlike PoW, which requires the use of expensive hardware, PoS reduces the barrier of entry for validators by leveraging the use of crypto tokens as the core foundation of its consensus process.
Gas is the unit for measuring transaction fees that users pay for conducting transactions on Ethereum. During periods of network congestion, gas can be extremely high, causing validators to prioritize transactions based on their fees.
Recommended Articles


