

Bitcoin ETF By BlackRock Registers First Daily Net Inflow In 3 Weeks: What To Know

Source Newsbtc

BlackRock’s iShare Bitcoin Trust (IBIT) registered its first daily net inflow in three weeks, leading to US spot Bitcoin exchange-traded-funds (ETFs) witnessing a combined net inflow of $12.8 million, data from Farside Investors confirms.

BlackRock’s Spot Bitcoin ETF Attracts Net Inflows, How About Other ETFs?

BlackRock forayed into the Bitcoin ETF space when the US Securities and Exchange Commission (SEC) approved IBIT in January 2024.

Dubbed the world’s largest asset manager with a total asset-under-management (AUM) of $9 trillion, BlackRock’s entry into the nascent crypto ETF ecosystem was met with much enthusiasm by investors as it not only brought a degree of sophistication but also exhibited institutional approval toward the industry.

Yesterday, the asset manager’s regulated financial product pulled $15.8 million in daily net inflows, a first since August 26, 2024. The net inflow of funds into IBIT was strong enough to push the wider US spot Bitcoin ETF market into green territory, with a combined net inflow of $12.8 million.

IBIT’s three weeks of no net daily inflows consisted of 11 days with zero flows, while two days – August 29, and September 9 – saw net daily outflows to $13.5 million and $9.1 million, respectively.

Looking at the performance of other spot Bitcoin ETFs, Grayscale’s GBTC product witnessed a net daily outflow of $20.8 million. At the same time, Fidelity’s FBTC, Franklin Templeton’s EZBC, and VanEck’s HODL experienced a net daily inflow of $5.1 million, $5 million, and $4.9 million, respectively.

According to data from cryptocurrency ETF tracker SoSoValue, BlackRock’s IBIT reigns supreme among US-based spot Bitcoin ETFs, with an enviable cumulative net inflow of $20.9 billion since the product’s inception early this year. FBTC follows this with $10.1 billion, Ark and 21Shares’ ARKB with $2.6 billion, and Bitwise’s BITB with $2.2 billion. 

In contrast, GBTC has witnessed a cumulative net outflow of $20 billion. Analysts blame the product’s exorbitant fee of 1.5% as a major reason for GBTC’s performance to date. For comparison, IBIT has a fee of 0.21%.

Spot Ethereum ETFs Continue Their Lackluster Performance

While spot Bitcoin ETFs ended the day with a combined net inflow of $12.8 million, spot Ethereum ETFs experienced a combined net outflow of $9.4 million.

Akin to its Bitcoin ETF, Grayscale’s Ethereum ETF (ETHE) witnessed a net daily outflow of $13.8 million, followed by Bitwise’s ETHW with a $2.1 million net outflow. Only Grayscale’s mini Ethereum ETF (ETH) successfully attracted net inflows worth $2.3 million.

Since their approval in May 2024, Ethereum ETFs haven’t performed as well as Bitcoin ETFs when attracting significant inflows.

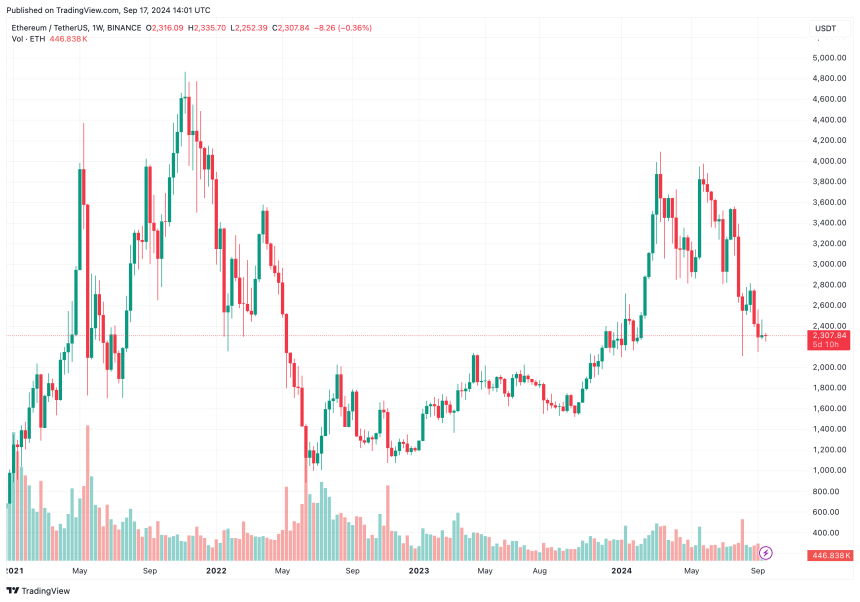
The tepid performance of Ethereum ETFs is reflected in the digital asset’s price as it continues to underperform against Bitcoin. Ethereum trades at $2,307 at press time, slightly up by 0.6% in the past 24 hours. 
ethereum
Disclaimer: For information purposes only. Past performance is not indicative of future results.
placeholder
Hot August jobs report reignites Fed-hike bets; S&P 500 slips below 7,700 — what to watch before the September FOMCAugust nonfarm payrolls surged to 162,000, three times the consensus, pushing CME FedWatch odds of a September 25-bp hike to 58.4% and dragging the S&P 500 below 7,700. CPI, PPI and the Sept 15-16 FOMC decision now set the tone for US stocks.
Author  Irene Q.
Sep 07, Mon
August nonfarm payrolls surged to 162,000, three times the consensus, pushing CME FedWatch odds of a September 25-bp hike to 58.4% and dragging the S&P 500 below 7,700. CPI, PPI and the Sept 15-16 FOMC decision now set the tone for US stocks.
placeholder
Japanese Yen rallies to February 18 high as upbeat wage data and GDP lift BoJ hike betsThe USD/JPY pair declines for the second straight day – also marking the fourth day of a fall in the previous five – and sinks to its lowest level since February 18, around mid-153.00s during the Asian session on Tuesday.
Author  FXStreet
Sep 08, Tue
The USD/JPY pair declines for the second straight day – also marking the fourth day of a fall in the previous five – and sinks to its lowest level since February 18, around mid-153.00s during the Asian session on Tuesday.
placeholder
Gold slumps to near $4,350 amid oil-driven inflation fears, US inflation data in focusGold price (XAU/USD) falls to near $4,350 during the early Asian session on Wednesday. The precious metal faces some selling pressure as rising oil prices fueled inflation ‌concerns and boosted expectations for a rate hike by the Federal Reserve (Fed) in September.
Author  FXStreet
Sep 09, Wed
Gold price (XAU/USD) falls to near $4,350 during the early Asian session on Wednesday. The precious metal faces some selling pressure as rising oil prices fueled inflation ‌concerns and boosted expectations for a rate hike by the Federal Reserve (Fed) in September.
placeholder
Brent holds above $100 as tanker attacks tighten supply — but four forces are capping the rallyBrent crude is holding above $100 a barrel for a second session, its first close above the level since late July, as tanker attacks near the Strait of Hormuz squeeze an already tight physical market. Yet the rally has been gradual: 8.3 mb/d of Gulf output is still shut in, diesel is at a record, and forecasts now range from $74 to $100.
Author  Irene Q.
Yesterday 07: 34
Brent crude is holding above $100 a barrel for a second session, its first close above the level since late July, as tanker attacks near the Strait of Hormuz squeeze an already tight physical market. Yet the rally has been gradual: 8.3 mb/d of Gulf output is still shut in, diesel is at a record, and forecasts now range from $74 to $100.
placeholder
US August CPI lands tonight: after a 5.4% PPI shock, will the Fed hike on September 16?US August PPI came in at 5.4% year-on-year, above the 5.3% consensus, with core PPI at 4.6%. Traders have pushed the odds of a 25bp Fed hike on September 15-16 to around 70%. Tonight's CPI is the last major inflation print before the decision — here is the full calendar, the consensus numbers, and what a hot versus cool reading would mean for the dollar, yields, gold and stocks.
Author  Irene Q.
6 hours ago
US August PPI came in at 5.4% year-on-year, above the 5.3% consensus, with core PPI at 4.6%. Traders have pushed the odds of a 25bp Fed hike on September 15-16 to around 70%. Tonight's CPI is the last major inflation print before the decision — here is the full calendar, the consensus numbers, and what a hot versus cool reading would mean for the dollar, yields, gold and stocks.
goTop
quote