

Bitcoin eyes for a recovery as it approaches its key support level
- Bitcoin approaches the key daily support level of $56,000, eyeing for a recovery.
- Microstrategy announces $700M private offering for debt buyback and Bitcoin acquisition.
- CME Group data projects a higher 69% chance of a 50 bps rate cut by the US Federal Reserve on Wednesday.
Bitcoin (BTC) shows signs of recovery and rises above $59,000 at the time of writing on Tuesday, following a three-day decline after failing to close above $60,500 over the weekend. This positive momentum could be bolstered by an anticipated 50 basis points (bps) US interest rate cut by the US Federal Reserve (Fed) on Wednesday, according to CME Group data. At the same time, the announcement of Microstratergy’s plan to purchase more BTC indicated further potential for Bicoin’s recovery in the coming days.
Daily digest market movers: 69% chance of 50 bps rate cut
The upcoming Fed decision on Wednesday will likely cause a volatile price action for Bitcoin and global currencies. According to CME Group data, there is a 69% chance that the Fed will cut interest rates by 50 bps on Wednesday for the first time in over four years. This big rate cut could be a bullish sign for cryptocurrencies, stocks, and global markets as lower borrowing costs generally provide more purchasing power for investors, and they would invest their money into assets rather than keeping it in banks.
“The Federal Reserve is widely anticipated to cut the interest rate at its September on Wednesday, the first time in four years. Investors will also take more cues from interest rate projections, known as the ‘dot plot’. The expectation of aggressive rate cuts might continue to undermine the Greenback in the near term”, said Lallalit Srijandorn, an analyst at FXStreet.
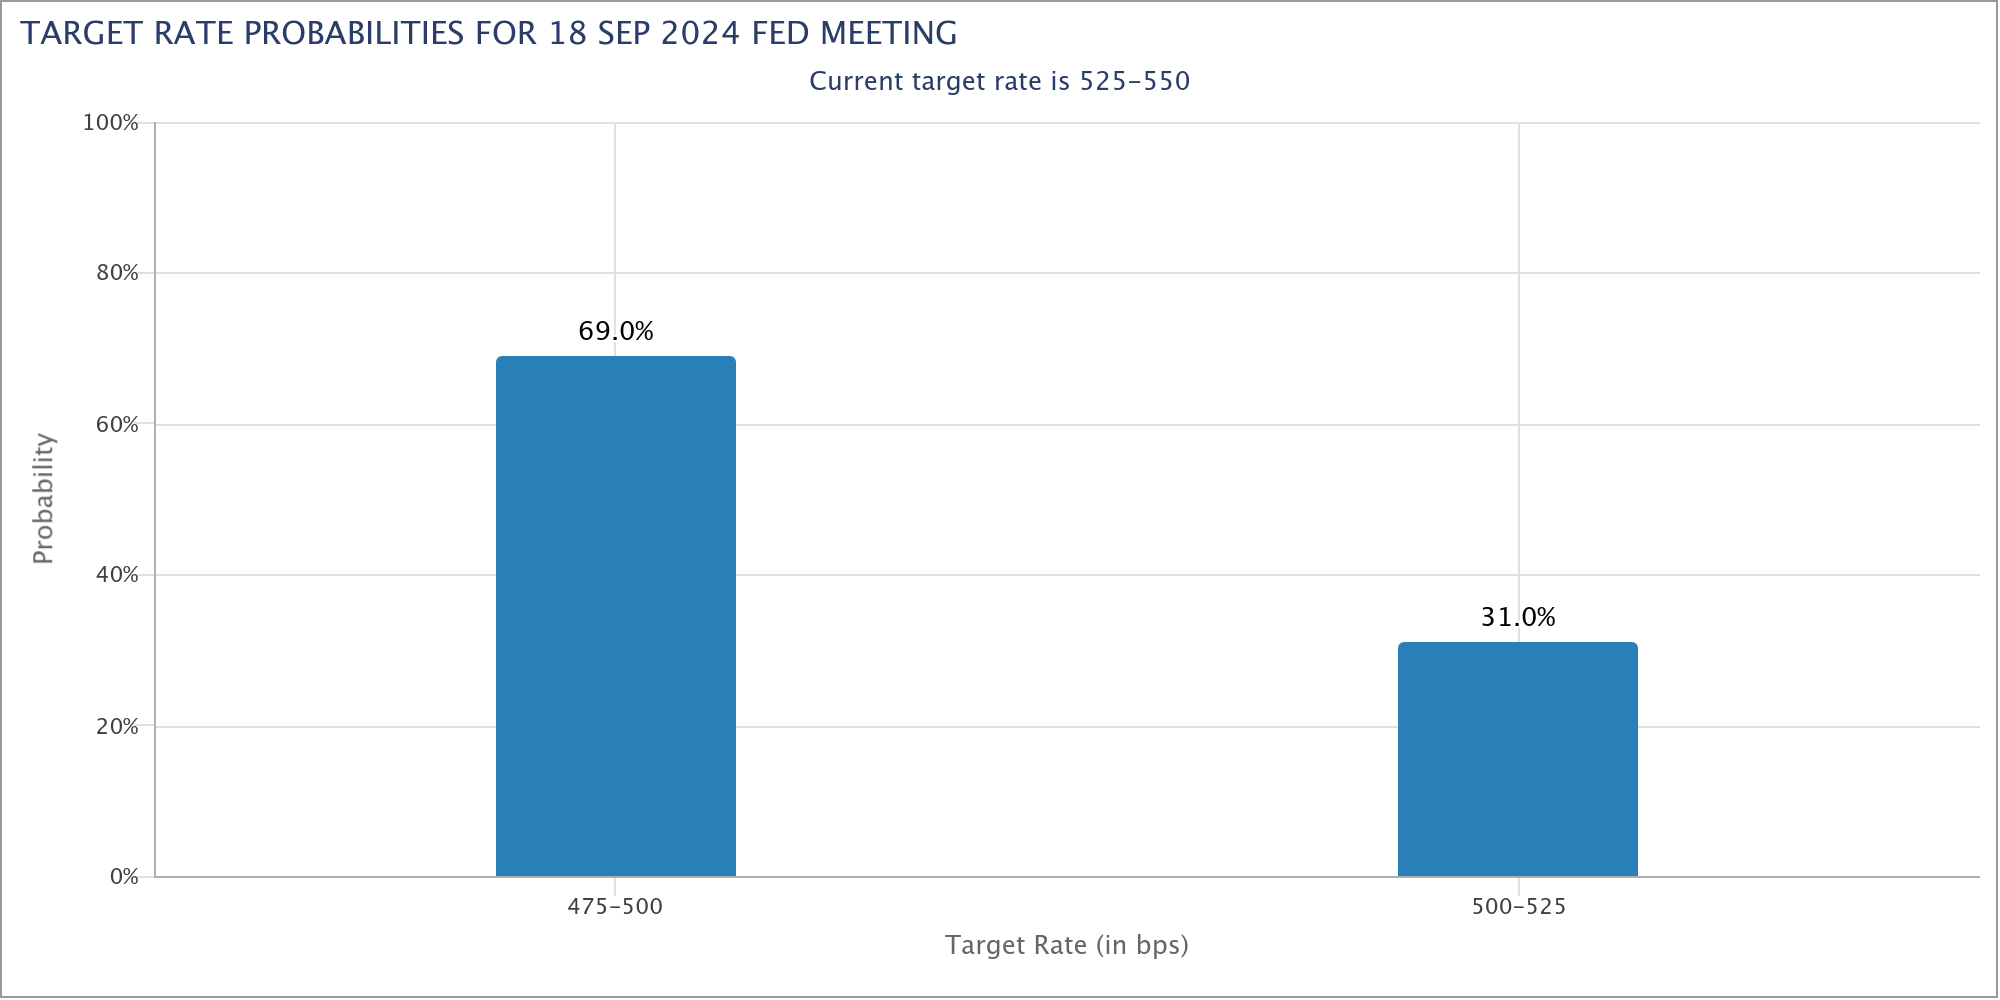
Rate cut probability chart
On Monday, US-based Microstrategy (MSTR), the publicly traded business intelligence company, unveiled plans for a private offering of $700 million in convertible senior notes. The firm plans to raise capital to pay off debt and purchase more Bitcoin.
“MicroStrategy has acquired 18,300 BTC for ~$1.11 billion at ~$60,408 per #bitcoin and has achieved BTC Yield of 4.4% QTD and 17.0% YTD. As of 9/12/2024, we hodl 244,800 $BTC acquired for ~$9.45 billion at ~$38,585 per bitcoin,” said Microstrategy’s CEO Michael Saylor in his Twitter post.
Now valued at $14.15 billion, the company’s Bitcoin portfolio has seen a 50% gain, driven by combining strategic fixed-interval purchasing and Bitcoin’s price growth.
Microstrategy’s focus on balancing debt reduction with Bitcoin accumulation continues to be central to its broader financial goals. Unlike exchange-traded funds (ETFs) like Blackrock’s IBIT and Grayscale’s GBTC, Microstrategy holds the most Bitcoin of any publicly traded company worldwide.
MicroStrategy Announces Proposed Private Offering of $700M of Convertible Senior Notes $MSTR https://t.co/OCq7wj2u0P
— Michael Saylor⚡️ (@saylor) September 16, 2024
US Bitcoin Spot Exchange Traded Funds (ETF) data recorded a mild inflow of $12.80 million on Monday, following a $403.30 million net inflows last week. Still, this inflow is small compared to the total Bitcoin reserves held by the 11 US spot Bitcoin ETFs, which total $49.44 billion in Assets Under Management (AUM).
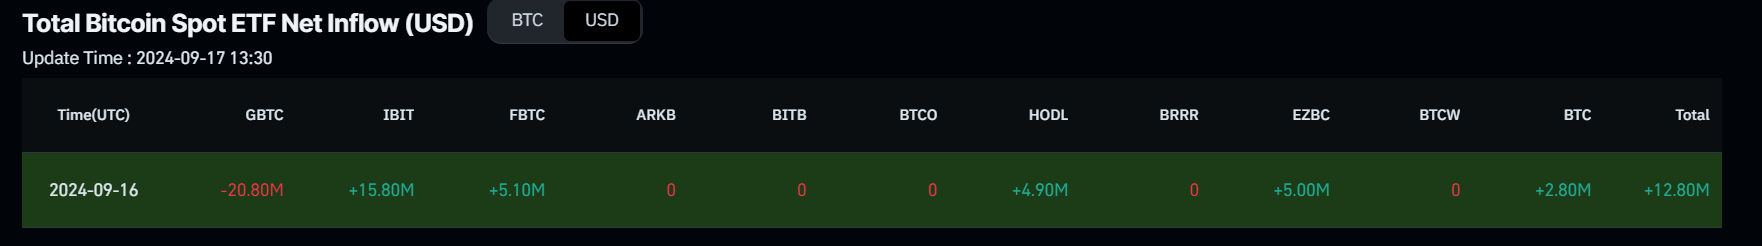
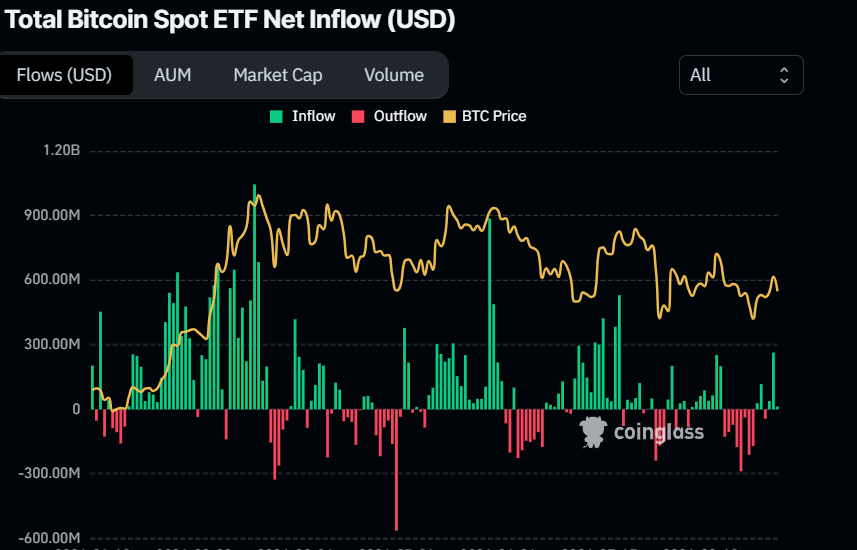
Bitcoin Spot ETF Net Inflow chart
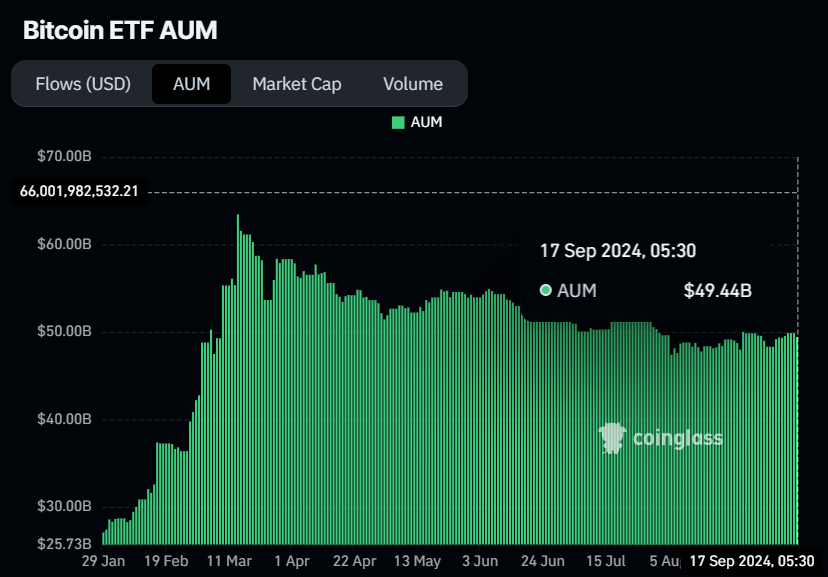
Bitcoin ETF AUM chart
However, Coinglass’s data provides a mild bearish outlook for Bitcoin. Bitcoin’s long-to-short ratio is at 0.99, indicating that more traders anticipate the asset price to fall. In any case, the ratio is very close to one, and a flip above one would indicate that traders’ sentiment would shift from bearish to bullish.
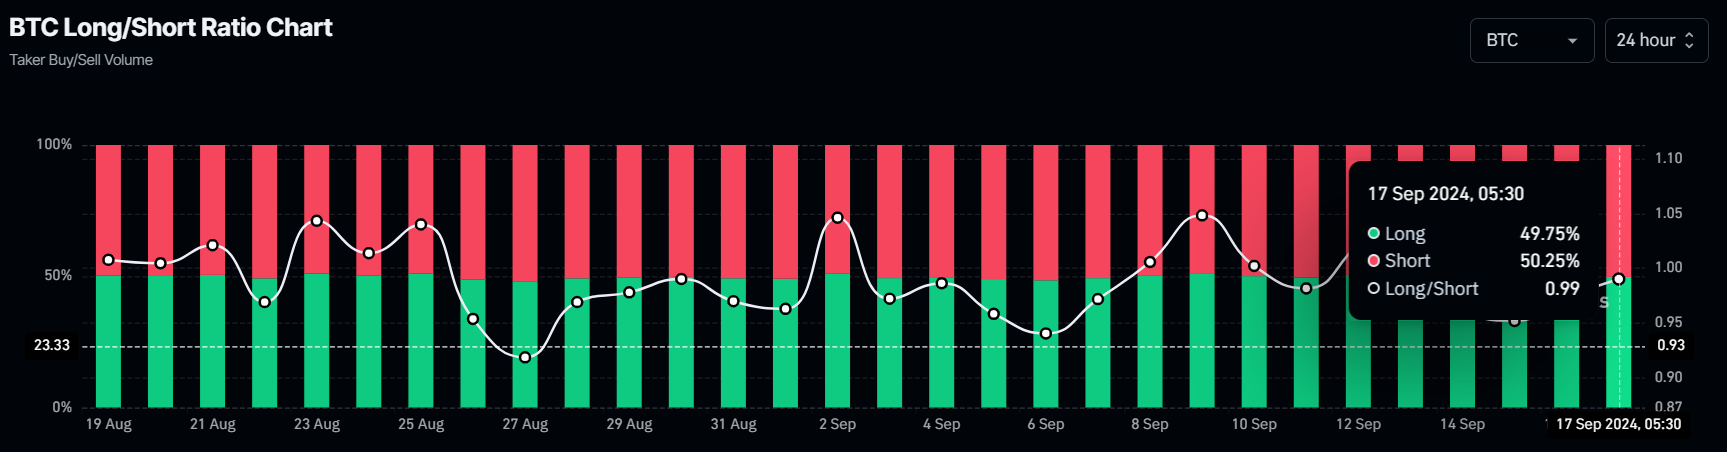
Bitcoin long-to-short ratio chart
Technical analysis: BTC eyes for a recovery
Bitcoin price retested and failed to close above the descending trendline (drawn from multiple high levels from the end of July) and the 100-day Exponential Moving Average (EMA) at $60,705 on Friday. It declined 3.78% in the next three days. At the time of writing on Tuesday, it trades just above $59,000.
If BTC continues to retrace, it could find support around the daily level of $56,022. If this support holds, BTC’s price could again attempt to break above the 100-day Exponential Moving Average (EMA) at $60,685 and the descending trendline.
The Relative Strength Index (RSI) and the Awesome Oscillator (AO) on the daily chart hover around their neutral levels of 50 and zero, indicating that neither the bulls nor the bears control the momentum. For the aforementioned bullish move to be sustained, both indicators must trade above their neutral levels.
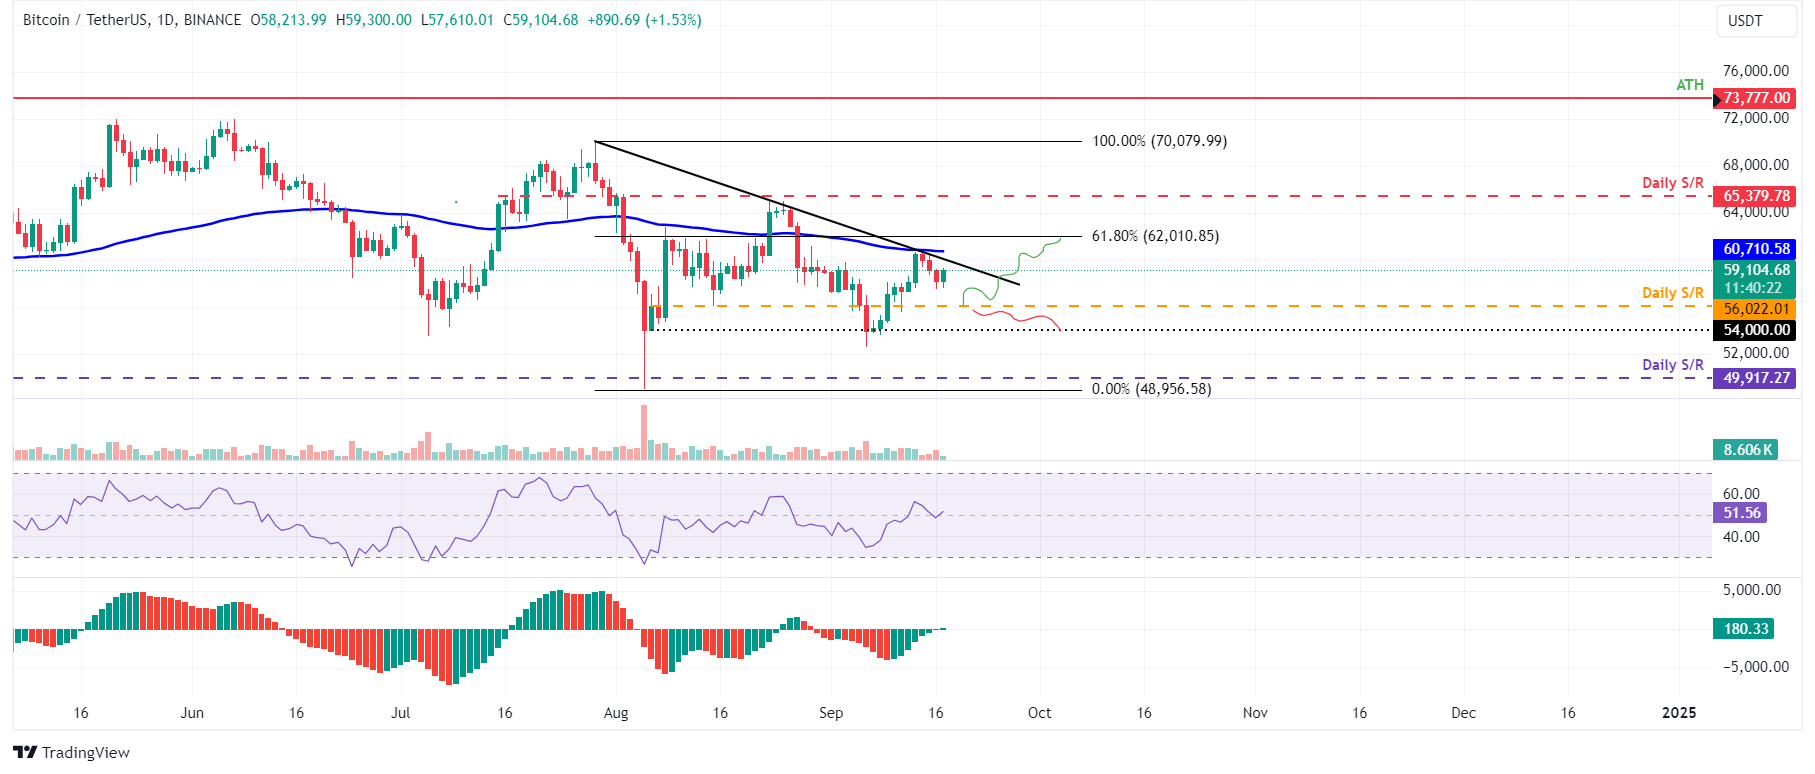
BTC/USDT daily chart
However, If BTC closes below the $56,022 daily support level, the bullish thesis will be invalidated. In this case, it could decline 3.6% to retest its psychologically important level at $54,000.
Bitcoin, altcoins, stablecoins FAQs
Bitcoin is the largest cryptocurrency by market capitalization, a virtual currency designed to serve as money. This form of payment cannot be controlled by any one person, group, or entity, which eliminates the need for third-party participation during financial transactions.
Altcoins are any cryptocurrency apart from Bitcoin, but some also regard Ethereum as a non-altcoin because it is from these two cryptocurrencies that forking happens. If this is true, then Litecoin is the first altcoin, forked from the Bitcoin protocol and, therefore, an “improved” version of it.
Stablecoins are cryptocurrencies designed to have a stable price, with their value backed by a reserve of the asset it represents. To achieve this, the value of any one stablecoin is pegged to a commodity or financial instrument, such as the US Dollar (USD), with its supply regulated by an algorithm or demand. The main goal of stablecoins is to provide an on/off-ramp for investors willing to trade and invest in cryptocurrencies. Stablecoins also allow investors to store value since cryptocurrencies, in general, are subject to volatility.
Bitcoin dominance is the ratio of Bitcoin's market capitalization to the total market capitalization of all cryptocurrencies combined. It provides a clear picture of Bitcoin’s interest among investors. A high BTC dominance typically happens before and during a bull run, in which investors resort to investing in relatively stable and high market capitalization cryptocurrency like Bitcoin. A drop in BTC dominance usually means that investors are moving their capital and/or profits to altcoins in a quest for higher returns, which usually triggers an explosion of altcoin rallies.
Recommended Articles


