

Top 3 Price Prediction Bitcoin, Ethereum, Ripple: Bitcoin sets for decline following close below $52,000 mark
- Bitcoin retests its daily support level around $52,226; a close below this support could lead to further price declines.
- Ethereum is retesting its weekly support at $2,118; closing below it may lead to further price declines.
- Ripple closes below $0.544 support, signaling a shift from a bullish to a bearish market structure.
Bitcoin (BTC) and Ethereum (ETH) retested their major support levels on Monday; a break below these levels could signal a bearish trend ahead, while Ripple (XRP) closed below its key support level, indicating a likely bearish outlook in the coming days.
Bitcoin price could decline if $52,000 mark is taken
Bitcoin's price fell below the ascending trendline (drawn by joining multiple swing high levels from July 5) on August 2, leading to a 5.6% decline over the next two days. As of Monday, it is trading 6% lower at $54,585, having tested the daily support level at $52,266.
If BTC closes below the daily support at the $52,266 level, it could continue to decline 4.7% to retest its next daily support at around $49,917.
The Relative Strength Index (RSI) and the Awesome Oscillator on the daily chart have dropped below their neutral levels of 50 and zero, respectively, signaling a bearish trend according to these momentum indicators.
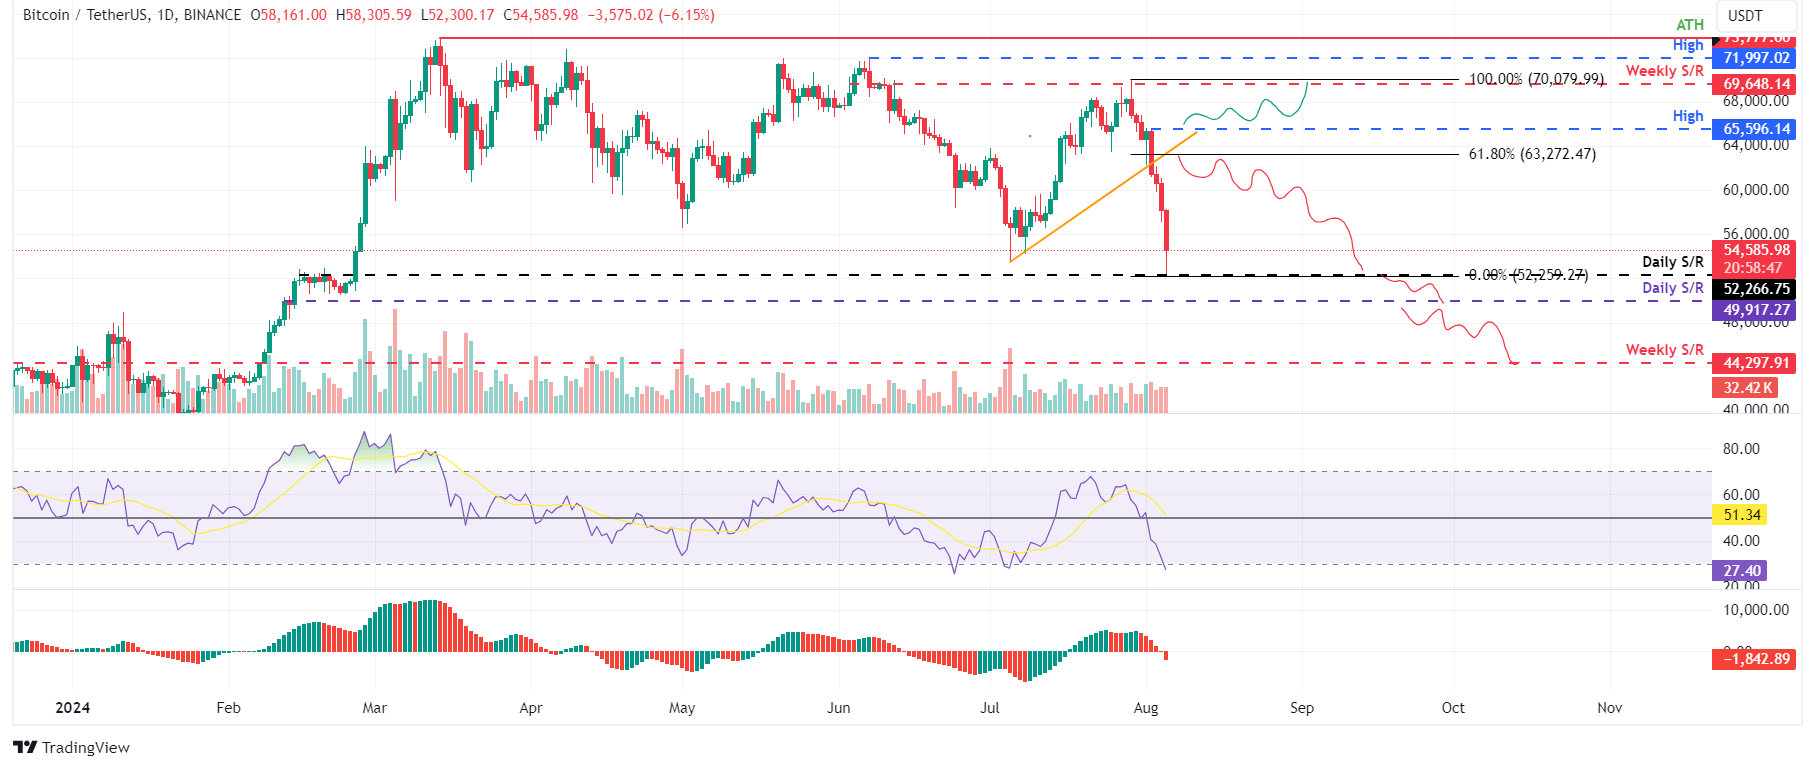
BTC/USDT daily chart
However, a close above the $65,596 daily high of August 2 would change the market structure by forming a higher high on the daily timeframe. Such a scenario might drive a 6% rise in Bitcoin's price to retest its weekly resistance at $69,648.
Ethereum price sets for decline if is falls below the $2,100 mark
Ethereum price closed below the daily support at around $2,927 on August 3 and declined 7.4% the next day. As of Monday, it continues to decline by 14% at $2,321 and retest the weekly support at $2,118.
If ETH closes below the weekly support at the $2,118 level, it could continue to decline 8.7% to retest its next weekly support at around $1,935.
The Relative Strength Index (RSI) and the Awesome Oscillator on the daily chart have dropped below their neutral levels of 50 and zero, respectively, signaling a bearish trend according to these momentum indicators.
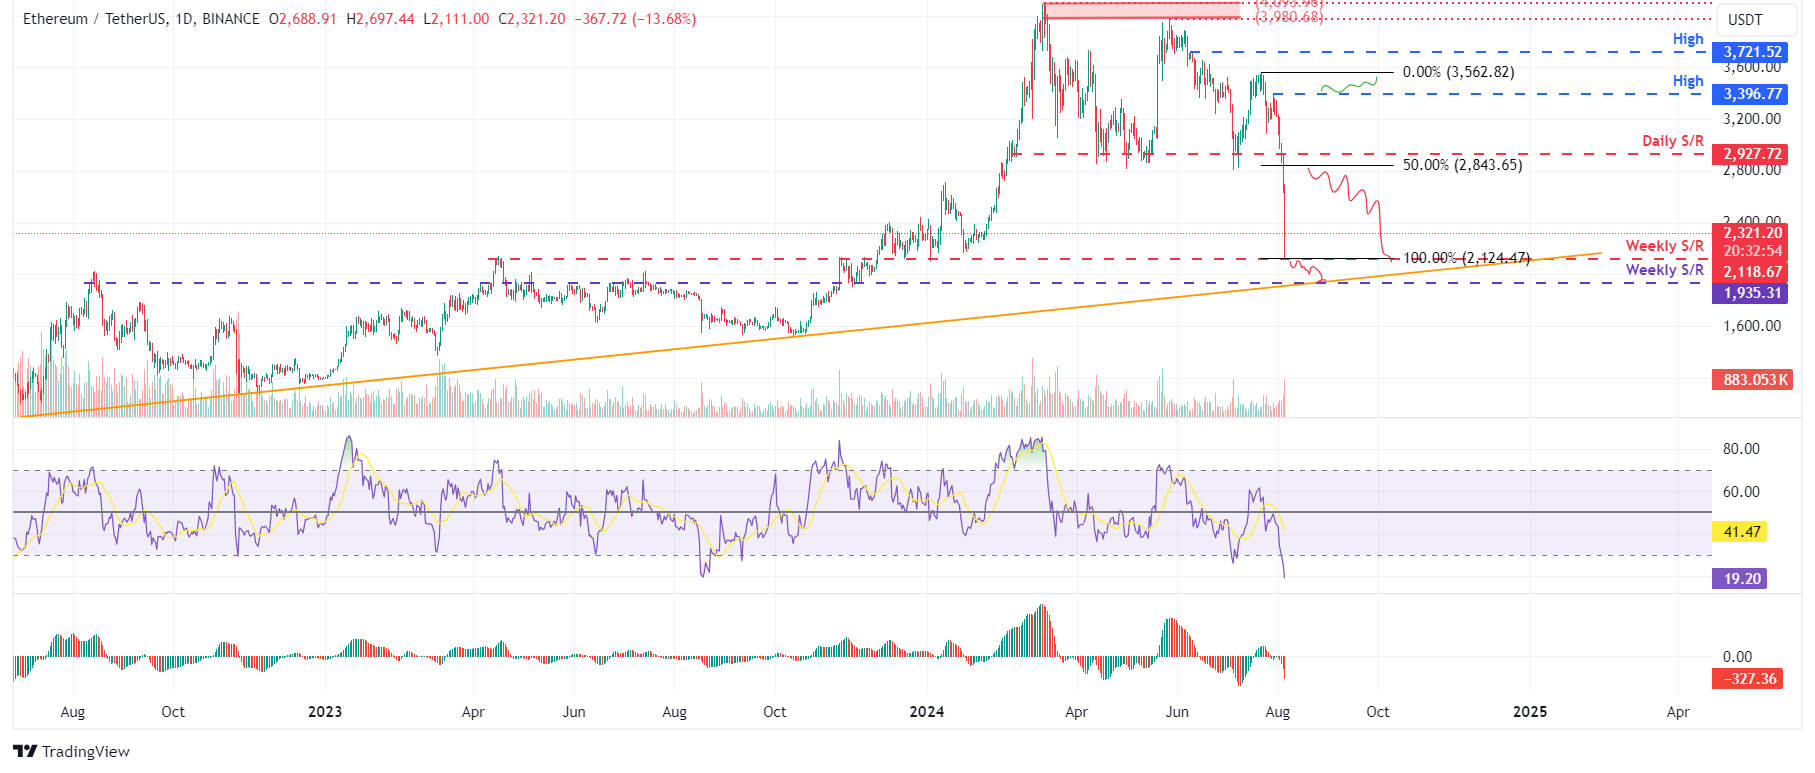
ETH/USDT daily chart
However, a close above the $3,396 daily high of July 29 would change the market structure by forming a higher high on the daily timeframe. Such a scenario might drive a 5% rise in Ethereum's price to retest the July 22 high of $3,562.
Ripple price is poised for a decline after failing to close above $0.544 level
Ripple price closed below the daily support level at $0.544 on Sunday. As of Monday, it continues to decline by 9% and trades at $0.477.
If the former daily support at $0.544 acts as resistance, XRP could continue to decline 17% to retest its weekly support at $0.413.
The Relative Strength Index (RSI) on the daily chart has briefly fallen below the neutral 50 level, and the Awesome Oscillator (AO) is approaching a similar decline; sustained weakening in these momentum indicators could signal strong bearish pressure and further declines in Ripple's price.
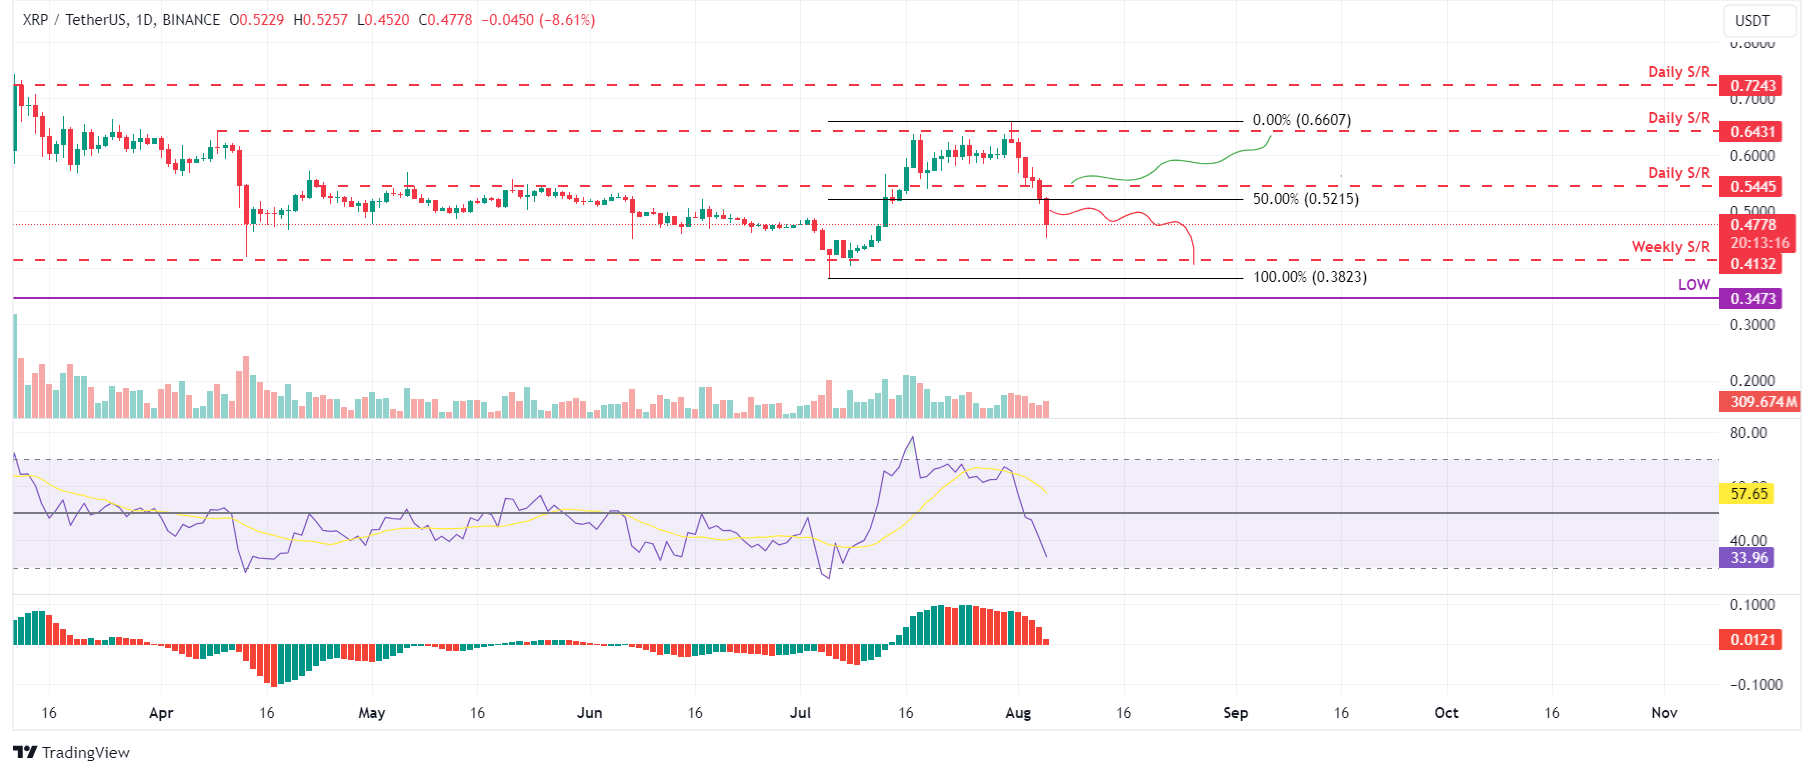
XRP/USDT daily chart
However, a close above the $0.544 level would change the market structure by forming a higher high on the daily timeframe. Such a scenario might drive an 18% rise in Ripple's price to retest the next daily resistance at $0.643.
Bitcoin, altcoins, stablecoins FAQs
Bitcoin is the largest cryptocurrency by market capitalization, a virtual currency designed to serve as money. This form of payment cannot be controlled by any one person, group, or entity, which eliminates the need for third-party participation during financial transactions.
Altcoins are any cryptocurrency apart from Bitcoin, but some also regard Ethereum as a non-altcoin because it is from these two cryptocurrencies that forking happens. If this is true, then Litecoin is the first altcoin, forked from the Bitcoin protocol and, therefore, an “improved” version of it.
Stablecoins are cryptocurrencies designed to have a stable price, with their value backed by a reserve of the asset it represents. To achieve this, the value of any one stablecoin is pegged to a commodity or financial instrument, such as the US Dollar (USD), with its supply regulated by an algorithm or demand. The main goal of stablecoins is to provide an on/off-ramp for investors willing to trade and invest in cryptocurrencies. Stablecoins also allow investors to store value since cryptocurrencies, in general, are subject to volatility.
Bitcoin dominance is the ratio of Bitcoin's market capitalization to the total market capitalization of all cryptocurrencies combined. It provides a clear picture of Bitcoin’s interest among investors. A high BTC dominance typically happens before and during a bull run, in which investors resort to investing in relatively stable and high market capitalization cryptocurrency like Bitcoin. A drop in BTC dominance usually means that investors are moving their capital and/or profits to altcoins in a quest for higher returns, which usually triggers an explosion of altcoin rallies.
Recommended Articles


