


Ethereum downtrend could prove a buy-the-dip opportunity following Canada's second staked ETH ETF
- Canada-based Purpose Investments announces conversion of its Ethereum Capital Corporation into staked Ethereum ETF.
- Conversion sees Canada embracing Ethereum staking ahead of US after SEC signals discomfort with concept.
- Ethereum price's recent downtrend could prove a good buy-the-dip opportunity.
Ethereum (ETH) resumed its downward trend on Monday after a slight weekend recovery following the launch of the Canada-based Purpose Investment Staked ETH ETF.
Daily digest market movers: Purpose Investment launches staked ETH ETF
In a press release on Monday, Purpose Investment announced the conversion of its Ether Capital Corporation to Purpose Ether Staking Corp ETF. The move comes after its shareholders voted to approve the corporation's conversion into an ETF actively managed by Purpose.
Also read: Ethereum ETFs could go live before July 2 after SEC send issuers comments on S-1s
"By using advanced staking capabilities developed at Ether Capital and working with our custodial partners at Gemini to develop an institutional-grade ETF ether staking framework, we're providing investors with a powerful tool that combines the benefits of staking with the robust oversight, transparency, and liquidity that an ETF structure provides," says Vlad Tasevski, Purpose’s Head of Asset Management, Institutions and Investors.
According to the press release, the ETF will begin trading on the Chicago Board Options Exchange (CBOE) under the ticker ETHC.B.
With the ETHC.B launch, Canada will get its second staked ETH ETF after 3iq launched ETHQ last year. Meanwhile, the US Securities & Exchange Commission (SEC) has signaled that it's uncomfortable with staking after prospective spot ETH ETF issuers updated their applications to remove words related to the concept.
Read more: Ethereum could sustain range-bound move following SEC Chair’s uncertainty over ETH status
The SEC approved spot ETH ETF issuers' 19b-4s on May 23 and sent comments on their S-1s last week, with expectations that the ETFs may begin trading on or before July 2.
ETH technical analysis: Could current prices prove a good buy-the-dip opportunity?
Ethereum is trading around $3,530 on Monday after failing to see any substantial price gain despite the positive impact from the SEC sending issuers comments on their spot ETH ETF S-1 registration statements.
ETH broke out from a descent that saw its price reach around $3,361 before moving back to claim the $3,600 zone. However, prices have slightly retraced on Monday. As a result, ETH liquidations reached $30.94 million in the past 24 hours, with long liquidations accounting for $19.11 million and shorts accounting for $11.82 million.
Also read: SEC Chair says Ethereum ETF S-1 approvals likely to come over the summer
With the potential launch of spot ETH ETFs in a few weeks, several analysts expect the price of ETH to set a new all-time high above $4,878. According to crypto analyst @CryptoJelleNL, ETH turning the $3,500 level into support could prove crucial in ETH's bid to reach the $5,000 mark. Hence, the recent downtrend could prove to be a crucial buy-the-dip opportunity. If ETH flips the $3,900 key resistance, it will give credence to the bullish view.
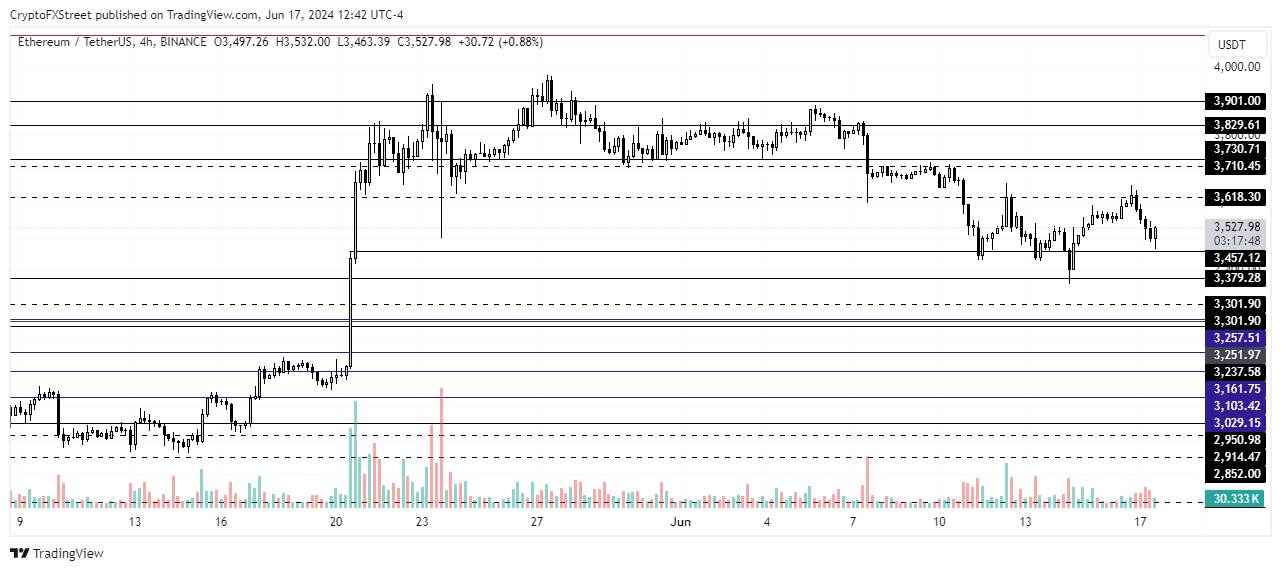
ETH/USDT 4-hour chart
On the other hand, the $3,300 support is a key price level to watch in the coming days. A breach below this level would invalidate the bullish thesis and may send ETH into the key range of $2,852 and $3,300.
Cryptocurrency prices FAQs
Token launches like Arbitrum’s ARB airdrop and Optimism OP influence demand and adoption among market participants. Listings on crypto exchanges deepen the liquidity for an asset and add new participants to an asset’s network. This is typically bullish for a digital asset.
A hack is an event in which an attacker captures a large volume of the asset from a DeFi bridge or hot wallet of an exchange or any other crypto platform via exploits, bugs or other methods. The exploiter then transfers these tokens out of the exchange platforms to ultimately sell or swap the assets for other cryptocurrencies or stablecoins. Such events often involve an en masse panic triggering a sell-off in the affected assets.
Macroeconomic events like the US Federal Reserve’s decision on interest rates influence risk assets like Bitcoin, mainly through the direct impact they have on the US Dollar. An increase in interest rate typically negatively influences Bitcoin and altcoin prices, and vice versa. If the US Dollar index declines, risk assets and associated leverage for trading gets cheaper, in turn driving crypto prices higher.
Halvings are typically considered bullish events as they slash the block reward in half for miners, constricting the supply of the asset. At consistent demand if the supply reduces, the asset’s price climbs. This has been observed in Bitcoin and Litecoin.
Recommended Articles


