

Solana Price Forecast: Strong institutional confidence keeps SOL afloat above $100

Source Fxstreet
  • Solana hovers above $100 on Monday, testing the psychological support after a 3% drop the previous day.
  • SOL-focused ETFs recorded over $150 million in inflows last week, the second-highest since the inception week.
  • The technical outlook for Solana is mixed as the price tests key psychological support amid waning bullish momentum.

Solana (SOL) price is trading around $100 on Monday, testing the psychological support level after a 3% decline the previous day. SOL-focused Exchange Traded Funds (ETFs) recorded over $150 million in inflows last week, reflecting strong institutional demand. Solana risks capitulation as price tests the $100 threshold amid easing bullish momentum.

ETF inflows, double disinflation projects long-term growth

Solana is gaining institutional strength amid major governance updates. SOL-focused ETFs recorded $153.87 million in inflows last week, with nine consecutive days of inflows. Typically, strong ETF inflows project long-term growth, fueling demand from large-wallet and retail investors amid growing risk appetite.
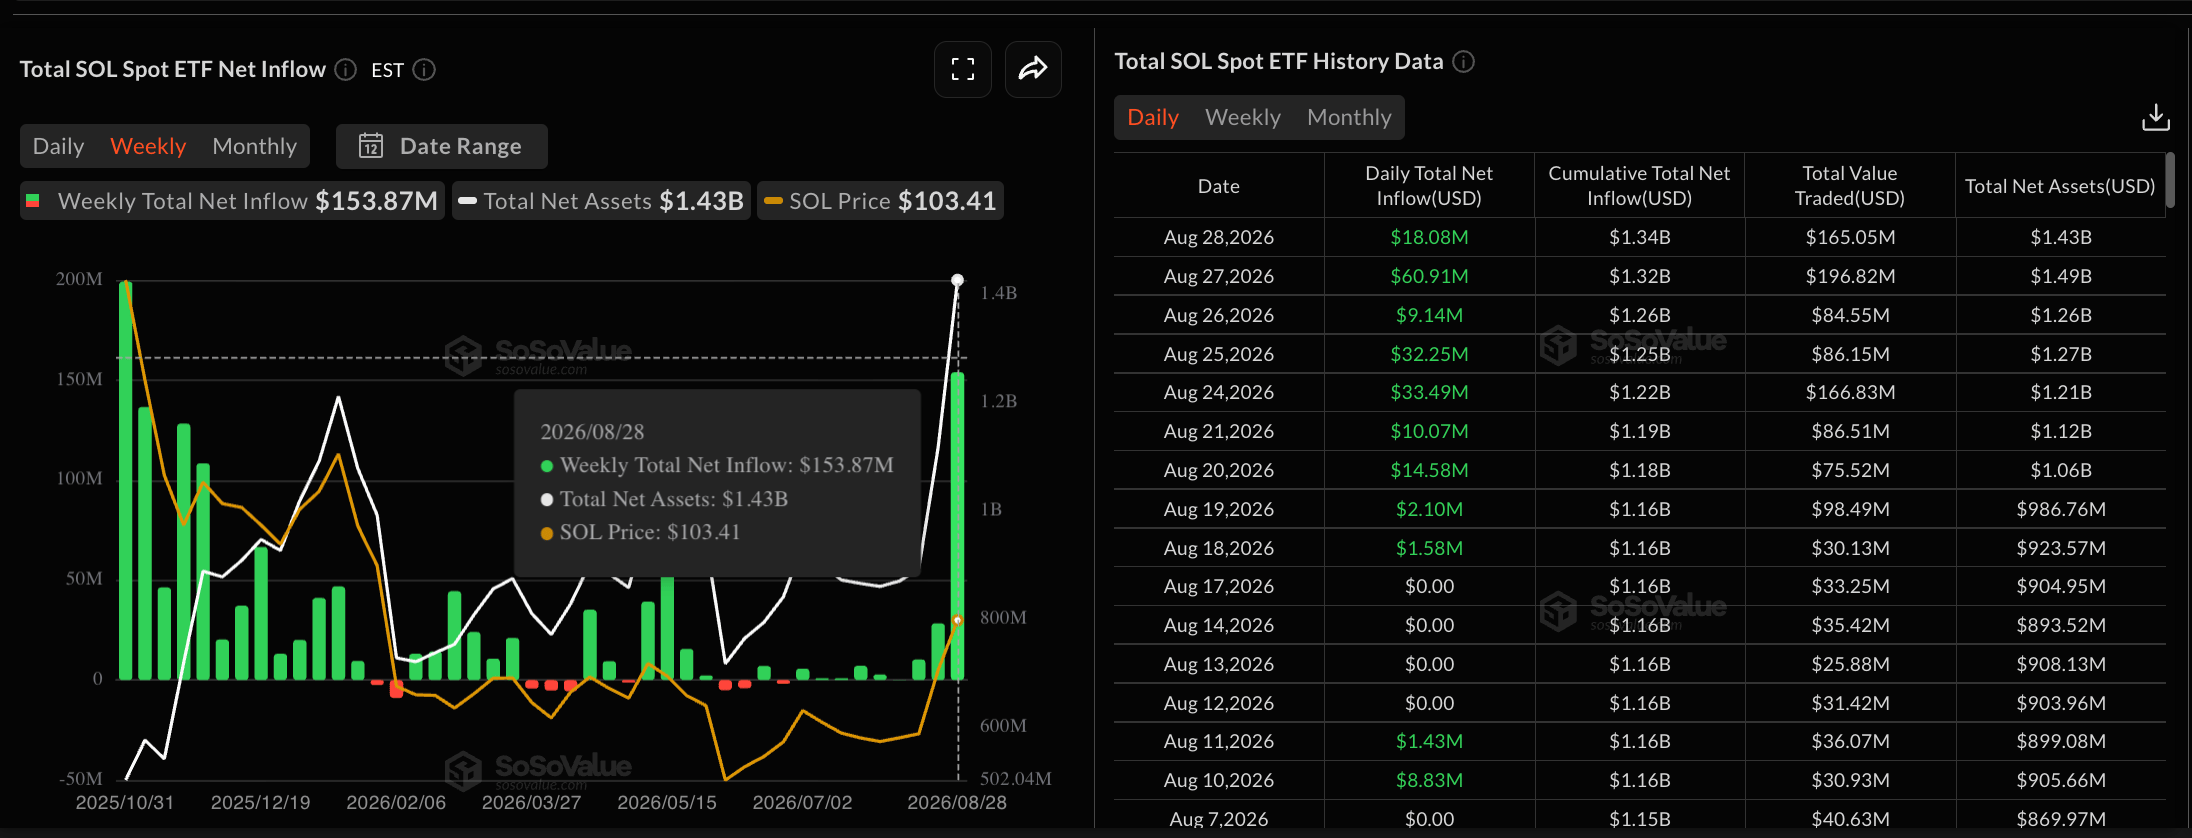
SOL ETFs data. Source: Sosovalue

On the network side, Solana validators voted to double the disinflation rate to 30% and establish a new governance framework. However, the proposal to introduce usage-based fees, which could have raised daily SOL burns to almost 9,000 tokens, failed. Overall, the governance votes favored better structuring and disinflation to promote long-term growth. 
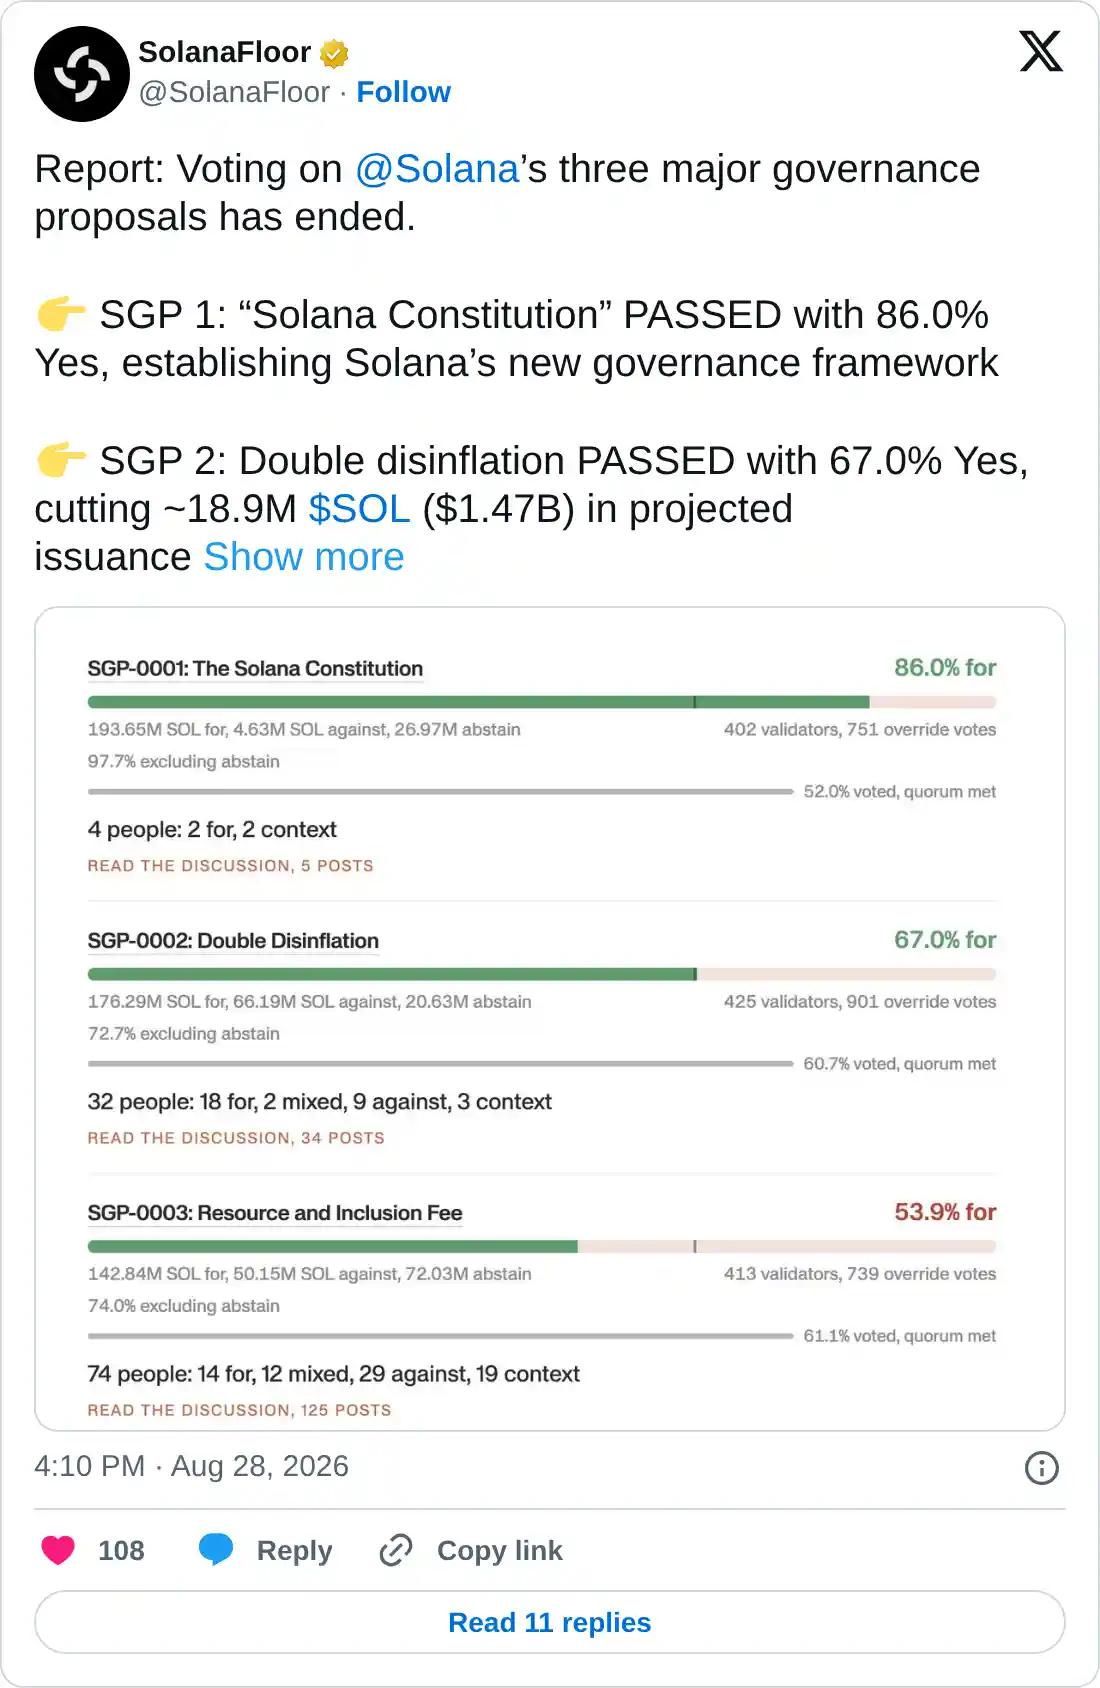
https://x.com/SolanaFloor/status/2093370745854529747

Technical outlook: Will SOL price sustain above $100?

Solana trades around $101.59 at press time on Monday, maintaining a constructive bullish bias. SOL holds above the 50-day Exponential Moving Average (EMA) at $85.05, the 100-day EMA at $82.77, and the 200-day EMA at $89.71, all of which sit below the market, hinting at a well-supported uptrend structure.

Momentum remains firm, with the Relative Strength Index (RSI) down to 67 on the daily chart from overbought conditions, showing easing buying pressure. At the same time, the Moving Average Convergence Divergence (MACD) edges lower toward the signal line, reaffirming reduced buying pressure.

On the topside, the next notable hurdle is the December 18 low at $116.88, which represents a significant structural barrier to any extended rally.

Chart Analysis SOL/USDT (Binance)
SOL/USDT daily price chart.

On the downside, immediate technical support is at the February 1 low of $98.02, followed by the 200-day EMA at $89.71 and the 50-day EMA at $85.05.

(The technical analysis of this story was written with the help of an AI tool. Know more.)

Disclaimer: For information purposes only. Past performance is not indicative of future results.
placeholder
Natural Gas sinks to pivotal level as China’s demand slumpsNatural Gas price (XNG/USD) edges lower and sinks to $2.56 on Monday, extending its losing streak for the fifth day in a row. The move comes on the back of China cutting its Liquified Natural Gas (LNG) imports after prices rose above $3.0 in June. It
Author  FXStreet
Jul 01, 2024
Natural Gas price (XNG/USD) edges lower and sinks to $2.56 on Monday, extending its losing streak for the fifth day in a row. The move comes on the back of China cutting its Liquified Natural Gas (LNG) imports after prices rose above $3.0 in June. It
placeholder
Markets in 2026: Will gold, Bitcoin, and the U.S. dollar make history again? — These are how leading institutions thinkAfter a turbulent 2025, what lies ahead for commodities, forex, and cryptocurrency markets in 2026?
Author  Insights
Dec 25, 2025
After a turbulent 2025, what lies ahead for commodities, forex, and cryptocurrency markets in 2026?
placeholder
ECB Policy Outlook for 2026: What It Could Mean for the Euro’s Next MoveWith the ECB likely holding rates steady at 2.15% and the Fed potentially extending cuts into 2026, EUR/USD may test 1.20 if Eurozone growth proves resilient, but weaker growth and an ECB pivot could pull the pair back toward 1.13 and potentially 1.10.
Author  Mitrade
Dec 26, 2025
With the ECB likely holding rates steady at 2.15% and the Fed potentially extending cuts into 2026, EUR/USD may test 1.20 if Eurozone growth proves resilient, but weaker growth and an ECB pivot could pull the pair back toward 1.13 and potentially 1.10.
placeholder
Silver Reclaims $70 to Hit Nearly Two-Month High as Monthly Gain Exceeds 20% On August 28 Eastern Time, international silver prices continued their recent strong rally, with spot silver (XAGUSD) briefly breaking through the key $70 mark intraday, after approaching
Author  TradingKey
Aug 28, Fri
On August 28 Eastern Time, international silver prices continued their recent strong rally, with spot silver (XAGUSD) briefly breaking through the key $70 mark intraday, after approaching
placeholder
Today’s Market Recap: Escalating US-Iran Conflict Pushes Oil Past $90, Warsh's Hawkish Remarks Boost Fed Rate-Hike Expectations, August Nonfarm Payrolls in Focus This WeekTracking Market TrendsTradingKey - On August 28, Eastern Time, the three major U.S. stock indexes closed lower across the board. Remarks by Federal Reserve Chairman Warsh at the Jackson Hole symposium
Author  TradingKey
4 hours ago
Tracking Market TrendsTradingKey - On August 28, Eastern Time, the three major U.S. stock indexes closed lower across the board. Remarks by Federal Reserve Chairman Warsh at the Jackson Hole symposium
Related Instrument
goTop
quote