


Ethereum on-chain and derivatives data indicates bullishness despite JP Morgan's bearish ETF prediction
- Ethereum accumulating addresses have increased steadily since the beginning of May.
- JP Morgan analysts predict that spot Ethereum ETFs will see a disappointing launch.
- Ethereum derivatives data indicates traders are highly bullish.
Ethereum (ETH) maintained a stable price on Friday following on-chain and derivatives data pointing to increased bullishness among investors. Meanwhile, JP Morgan analysts predicted that spot Ethereum ETFs will only command a fraction of Bitcoin flows if they launch.
Daily digest market movers: Increased accumulating addresses, Grayscale filings, JP Morgan predictions
Ethereum is at the center of key discussions in the crypto market. Here are the latest stories surrounding the top altcoin:
- According to data from CryptoQuant, the number of new addresses accumulating ETH has grown steadily in May despite prices remaining relatively stable. Notably, new accumulating addresses with a balance of 10,000 to 100,000 ETH skyrocketed and have been growing steadily following rumors and the eventual approval of spot ETH ETF 19b-4 filings.
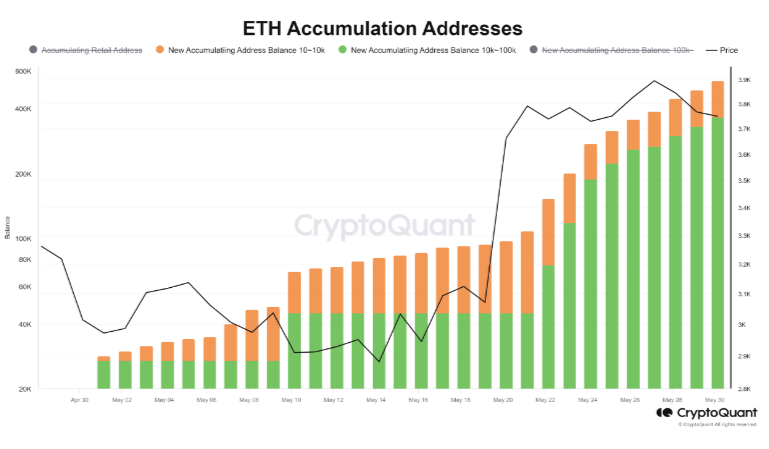
ETH Accumulation addresses
Read more: Ethereum price lags, investors potentially reallocating capital after BlackRock's updated S-1 filing
- Grayscale submitted its updated registration statements for spot ETH ETFs with the Securities & Exchange Commission (SEC) on Thursday. This follows updated BlackRock and Van Eck S-1 submissions after the SEC approved 19b-4 applications of eight issuers on May 23.
The Block earlier reported that two sources confirmed that the SEC asked issuers to submit their updated S-1 filing on Friday at the latest. Eric Balchunas confirmed the report in an X post, stating he heard the same.
- Meanwhile, JP Morgan analysts led by Nikolaos Panigirtzoglou predict that spot ETH ETFs will face a disappointing reception in a report on Thursday. The analysts stated several reasons for their position, including Bitcoin's first mover advantage, the removal of staking from filings, and lack of halving event catalyst.
More importantly, they stated how Ethereum's smaller market cap will see its spot ETFs gaining a fraction of the flows seen in spot Bitcoin ETFs. As a result, they capped their maximum expected inflows across all spot ETH ETFs — if they launch — in 2024 at $3 billion. They expect the figure to double if issuers eventually allow staking.
As previously highlighted, analysts from CCData also shared a similar sentiment, illustrating the potential gains investors could miss out on by holding ETH in ETFs instead of staking it.
"Hypothetically, if you had opened a 1000 ETH position on January 1, 2023 with an ETF provider, instead of holding native Ether, which accrues staking rewards, you would have missed out on gains of over $200,000," wrote CCData.
Several issuers removed staking from their applications after it became apparent that the SEC wasn't comfortable with the concept.
Also read: Ethereum slightly tilts toward bears, may only see 20% of Bitcoin ETF flows following silver comparison
ETH technical analysis: Ethereum derivatives data indicates bullishness
Ethereum is trading around $3,740 on Friday, maintaining its horizontal movement.
ETH liquidations data also reveals the neutrality among bulls and bears, with $16.66 million of liquidated long positions and $12.12 million of shorts.
However, while prices lag, derivatives data from Deribit shows that Ethereum options' open interest is largely made up of calls at a strike price of $5,000, indicating bullish sentiment among traders. Data from Coinglass also confirms this as it shows Deribit's put/call ratio (PCR) for options expiring in June at 0.36.
The put/call ratio measures the volume of puts vs calls. If the ratio is below one, it indicates a skew toward bulls and vice versa if it is above 1.
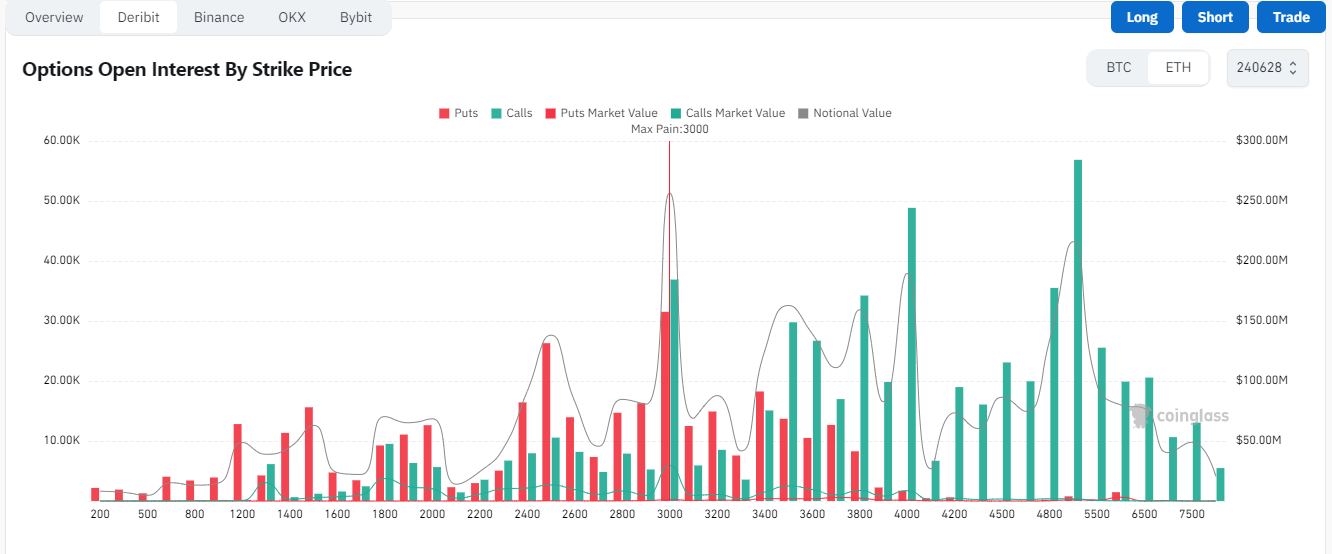
ETH Options Open Interest By Strike Price
ETH will likely see a major breakout when the SEC gives more clarity on spot ETH ETF S-1 registration statements, according to QCP Capital analysts.
Read more: Top 3 Price Prediction Bitcoin, Ethereum, Ripple: Facing correction after ETFs led rally
Hence, ETH may tackle the $4,093 resistance. If successful, it may go on to set a new all-time high above $4,878.
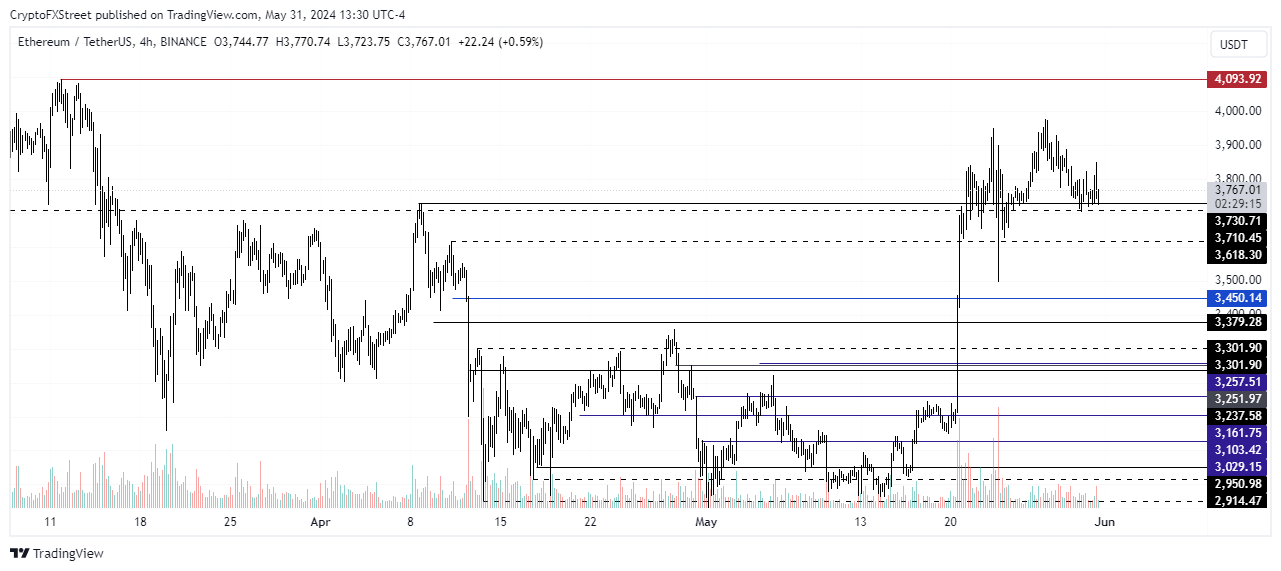
ETH/USDT 4-hour chart
Ethereum FAQs
Ethereum is a decentralized open-source blockchain with smart contracts functionality. Serving as the basal network for the Ether (ETH) cryptocurrency, it is the second largest crypto and largest altcoin by market capitalization. The Ethereum network is tailored for scalability, programmability, security, and decentralization, attributes that make it popular among developers.
Ethereum uses decentralized blockchain technology, where developers can build and deploy applications that are independent of the central authority. To make this easier, the network has a programming language in place, which helps users create self-executing smart contracts. A smart contract is basically a code that can be verified and allows inter-user transactions.
Staking is a process where investors grow their portfolios by locking their assets for a specified duration instead of selling them. It is used by most blockchains, especially the ones that employ Proof-of-Stake (PoS) mechanism, with users earning rewards as an incentive for committing their tokens. For most long-term cryptocurrency holders, staking is a strategy to make passive income from your assets, putting them to work in exchange for reward generation.
Ethereum transitioned from a Proof-of-Work (PoW) to a Proof-of-Stake (PoS) mechanism in an event christened “The Merge.” The transformation came as the network wanted to achieve more security, cut down on energy consumption by 99.95%, and execute new scaling solutions with a possible threshold of 100,000 transactions per second. With PoS, there are less entry barriers for miners considering the reduced energy demands.
Recommended Articles


