
Gold edges lower with all eyes on the US NFP report
- Gold price edges lower ahead of the US Nonfarm Payrolls data.
- President Donald Trump nears the final vote, which could see the tax and spending bill pass legislation on Thursday.
- XAU/USD flirts with $3,350 with markets focused on US Employment data.
Gold (XAU/USD) is edging lower in the European session on Thursday, as markets look ahead to the US Nonfarm Payrolls (NFP) data release for June.
The NFP figures will be released by the US Bureau of Labor Statistics (BLS) at 12:30 GMT.
At the time of writing, Gold is trading near $3,350, with US economic data expected to drive volatility ahead of Friday’s Independence Day holiday in the US.
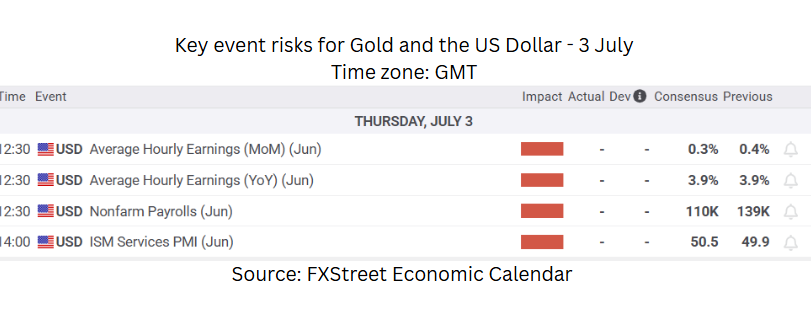
The Nonfarm Payrolls are expected to show that the US economy added 110K jobs in June, after increasing by 139K in the previous month. This report serves as a barometer of the health of the US labor market, although it excludes certain sectors, such as agriculture.
The unemployment rate is expected to edge slightly higher to 4.3%, from 4.2% in May.
Markets will also closely monitor the Average Hourly Earnings numbers, which indicate wage growth. This is also a factor that contributes to inflation.
Full employment is one of the Federal Reserve’s mandates, and the central bank takes it into consideration. Developments in the labour market play a pivotal role in determining the future trajectory for monetary policy.
A softer-than-expected NFP print, particularly if accompanied by slowing wage growth and a higher unemployment rate, could increase the likelihood of a Fed interest rate cut in the near term. Such an outcome would likely weigh on the US Dollar and Treasury yields, offering a bullish backdrop for Gold.
Trump’s GOP Megabill heads for a final vote before July 4 deadline
US President Donald Trump commented on the tax bill on Truth Social this Thursday. He said it is currently being finalized by the US House of Representatives. Trump stated, “Largest Tax Cuts in History and a Booming. Economy vs. Biggest Tax Increase in History, and a Failed Economy. What are the Republicans waiting for??? What are you trying to prove???”.
This comes as the House of Representatives is expected to announce the final vote on the tax and spending bill later in the day.
The plan aims to revive several key elements of the 2017 Tax Cuts and Jobs Act and introduce further reductions.
Early projections indicate that it could add roughly $3.3 trillion to the national deficit over the next decade.
For the Gold price, the implications are hard to ignore. An already ballooning balance sheet deficit and high interest rates raise concerns about the long-term sustainability of the US debt.
Gold daily digest market movers: Can Thursday's data sway the Fed and drive bullion?
- The Institute for Supply Management (ISM) Services Purchasing Manager’s Index (PMI) will be released shortly after the Nonfarm Payrolls, at 14:00 GMT. Markets expect data to come out at 50.5 for June. A reading above 50 indicates that the service sector is expanding, while a reading below it indicates potential contraction.
- The ADP Employment Change report released on Wednesday showed that the employment situation in the private sector has continued to weaken. Analysts had expected 95K jobs to be added in June. Instead, the actual figures revealed 33K jobs lost.
- President Trump continues to pressure Fed Chair Jerome Powell to reduce interest rates. On Wednesday, he called for the “immediate resignation” of Fed Powell on a Truth Social post.
- With the Fed’s independence coming under question, Gold could continue to find support from political uncertainty in the US, which has been weakening demand for the Greenback.
- Speaking at the European Central Bank (ECB) forum on Tuesday, Powell stated that "It's going to depend on the data, and we are going meeting by meeting. I wouldn't take any meeting off the table or put it directly on the table. It's going to depend on how the data evolves.” When questioned about interest rates, he said, “In effect, we went on hold when we saw the size of the tariffs, and essentially all inflation forecasts for the United States went up materially as a consequence of the tariffs. We didn’t overreact, in fact, we didn’t react at all. We’re simply taking some time.”
Gold technical analysis: XAU/USD flirts with $3,350 with US fundamental drivers in focus
Gold is currently trading around the 20-day Simple Moving Average (SMA) at $3,350. The 78.6% Fibonacci retracement of the April low-high move is providing a near-term price ceiling at $3,372. If NFP data disappoints and the labour market shows clear signs of weakness, a surge in bullish momentum above this level could open the door for a test of the $3,400 psychological level. Above here, June's high of $3,452 and April's record high of $3,500 could be next.
Gold (XAU/USD) daily price chart:
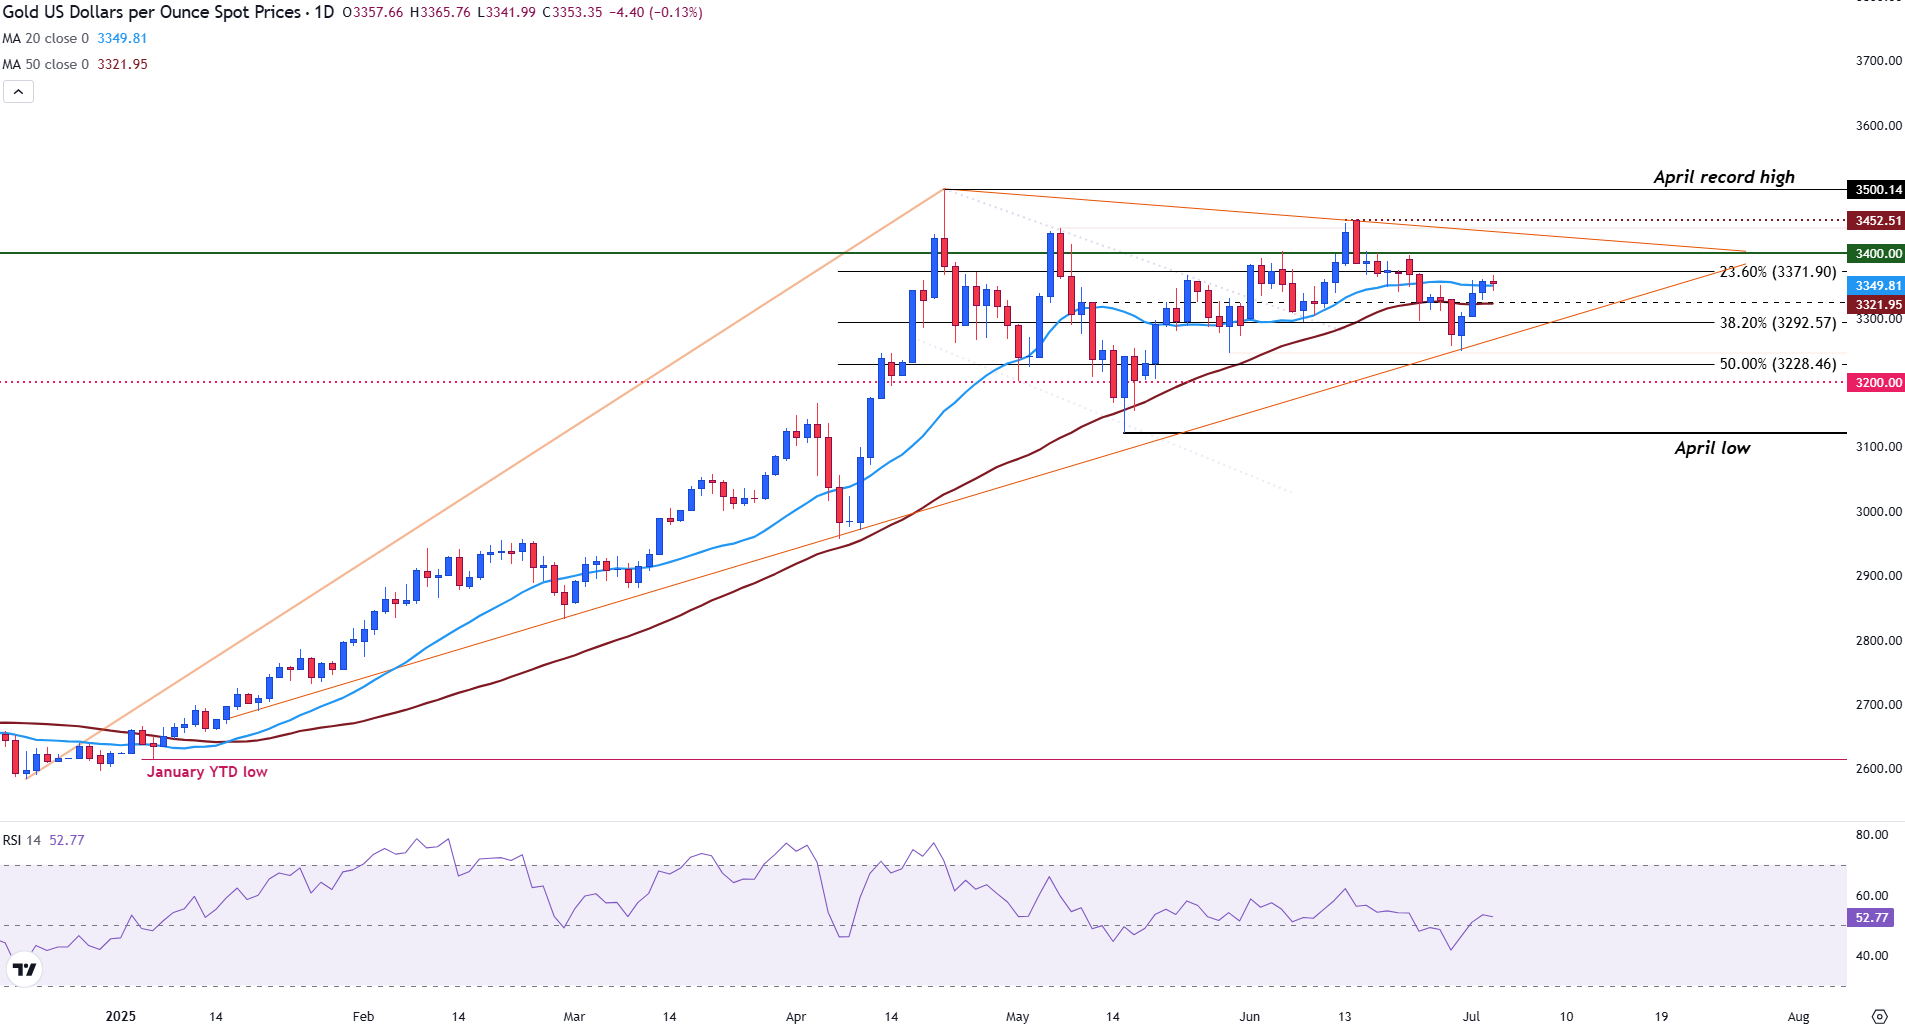
The Relative Strength Index (RSI) is flattening near 53, slightly above the neutral zone. This reflects indecision among investors right ahead of the key fundamental catalysts.
If Gold falls below the 50-day SMA at $3,322, the next psychological level of $3,300 and the midpoint of the April move at $3,328 could provide near-term support for XAU/USD.
Economic Indicator
Nonfarm Payrolls
The Nonfarm Payrolls release presents the number of new jobs created in the US during the previous month in all non-agricultural businesses; it is released by the US Bureau of Labor Statistics (BLS). The monthly changes in payrolls can be extremely volatile. The number is also subject to strong reviews, which can also trigger volatility in the Forex board. Generally speaking, a high reading is seen as bullish for the US Dollar (USD), while a low reading is seen as bearish, although previous months' reviews and the Unemployment Rate are as relevant as the headline figure. The market's reaction, therefore, depends on how the market assesses all the data contained in the BLS report as a whole.
Read more.Next release: Thu Jul 03, 2025 12:30
Frequency: Monthly
Consensus: 110K
Previous: 139K
Source: US Bureau of Labor Statistics
America’s monthly jobs report is considered the most important economic indicator for forex traders. Released on the first Friday following the reported month, the change in the number of positions is closely correlated with the overall performance of the economy and is monitored by policymakers. Full employment is one of the Federal Reserve’s mandates and it considers developments in the labor market when setting its policies, thus impacting currencies. Despite several leading indicators shaping estimates, Nonfarm Payrolls tend to surprise markets and trigger substantial volatility. Actual figures beating the consensus tend to be USD bullish.
US Dollar PRICE Today
The table below shows the percentage change of US Dollar (USD) against listed major currencies today. US Dollar was the strongest against the New Zealand Dollar.
| USD | EUR | GBP | JPY | CAD | AUD | NZD | CHF | |
|---|---|---|---|---|---|---|---|---|
| USD | 0.05% | -0.19% | 0.13% | -0.03% | 0.15% | 0.33% | 0.20% | |
| EUR | -0.05% | -0.25% | 0.10% | -0.08% | 0.09% | 0.24% | 0.19% | |
| GBP | 0.19% | 0.25% | 0.31% | 0.18% | 0.33% | 0.47% | 0.22% | |
| JPY | -0.13% | -0.10% | -0.31% | -0.15% | 0.03% | 0.13% | -0.05% | |
| CAD | 0.03% | 0.08% | -0.18% | 0.15% | 0.17% | 0.31% | 0.26% | |
| AUD | -0.15% | -0.09% | -0.33% | -0.03% | -0.17% | -0.02% | -0.10% | |
| NZD | -0.33% | -0.24% | -0.47% | -0.13% | -0.31% | 0.02% | -0.26% | |
| CHF | -0.20% | -0.19% | -0.22% | 0.05% | -0.26% | 0.10% | 0.26% |
The heat map shows percentage changes of major currencies against each other. The base currency is picked from the left column, while the quote currency is picked from the top row. For example, if you pick the US Dollar from the left column and move along the horizontal line to the Japanese Yen, the percentage change displayed in the box will represent USD (base)/JPY (quote).
Recommended Articles


