


Crypto Today: Bitcoin, Ethereum, XRP stay under pressure as US and Iran exchange fresh attacks
- Bitcoin holds above $63,000 on Monday but remains under intensifying headwinds as US-Iran tensions persist after fresh strikes.
- Ethereum struggles below the 100-day EMA resistance while the Parabolic SAR aligns support around $1,700.
- XRP retains a broader bearish outlook, accentuated by falling major moving averages and weak momentum indicators.
The cryptocurrency market broadly corrects on Monday, as risk-averse sentiment persists amid fresh military attacks between the United States (US) and Iran in the Middle East. Bitcoin (BTC) hovers above $63,000, reinforcing a weak technical structure while Ethereum (ETH) trades below $1,800 with the next key support near $1,700. Meanwhile, Ripple (XRP) wobbles around the immediate $1.08 support after correcting for the third consecutive day.
Fresh US-Iran attacks weigh on the crypto market
The United States (US) Central Command (CENTCOM) confirmed a second consecutive day of airstrikes targeting dozens of Iranian military positions on Sunday, seeking to further diminish Iran’s capability to threaten commercial shipping in the Strait of Hormuz. A CNN report states that US strikes have expanded beyond coastal areas bordering the vital shipping channel.
In a swift response, Iran reported strikes against US military installations in Bahrain, Kuwait, Oman, and Jordan. The escalation has further threatened the fragile ceasefire between the two countries.
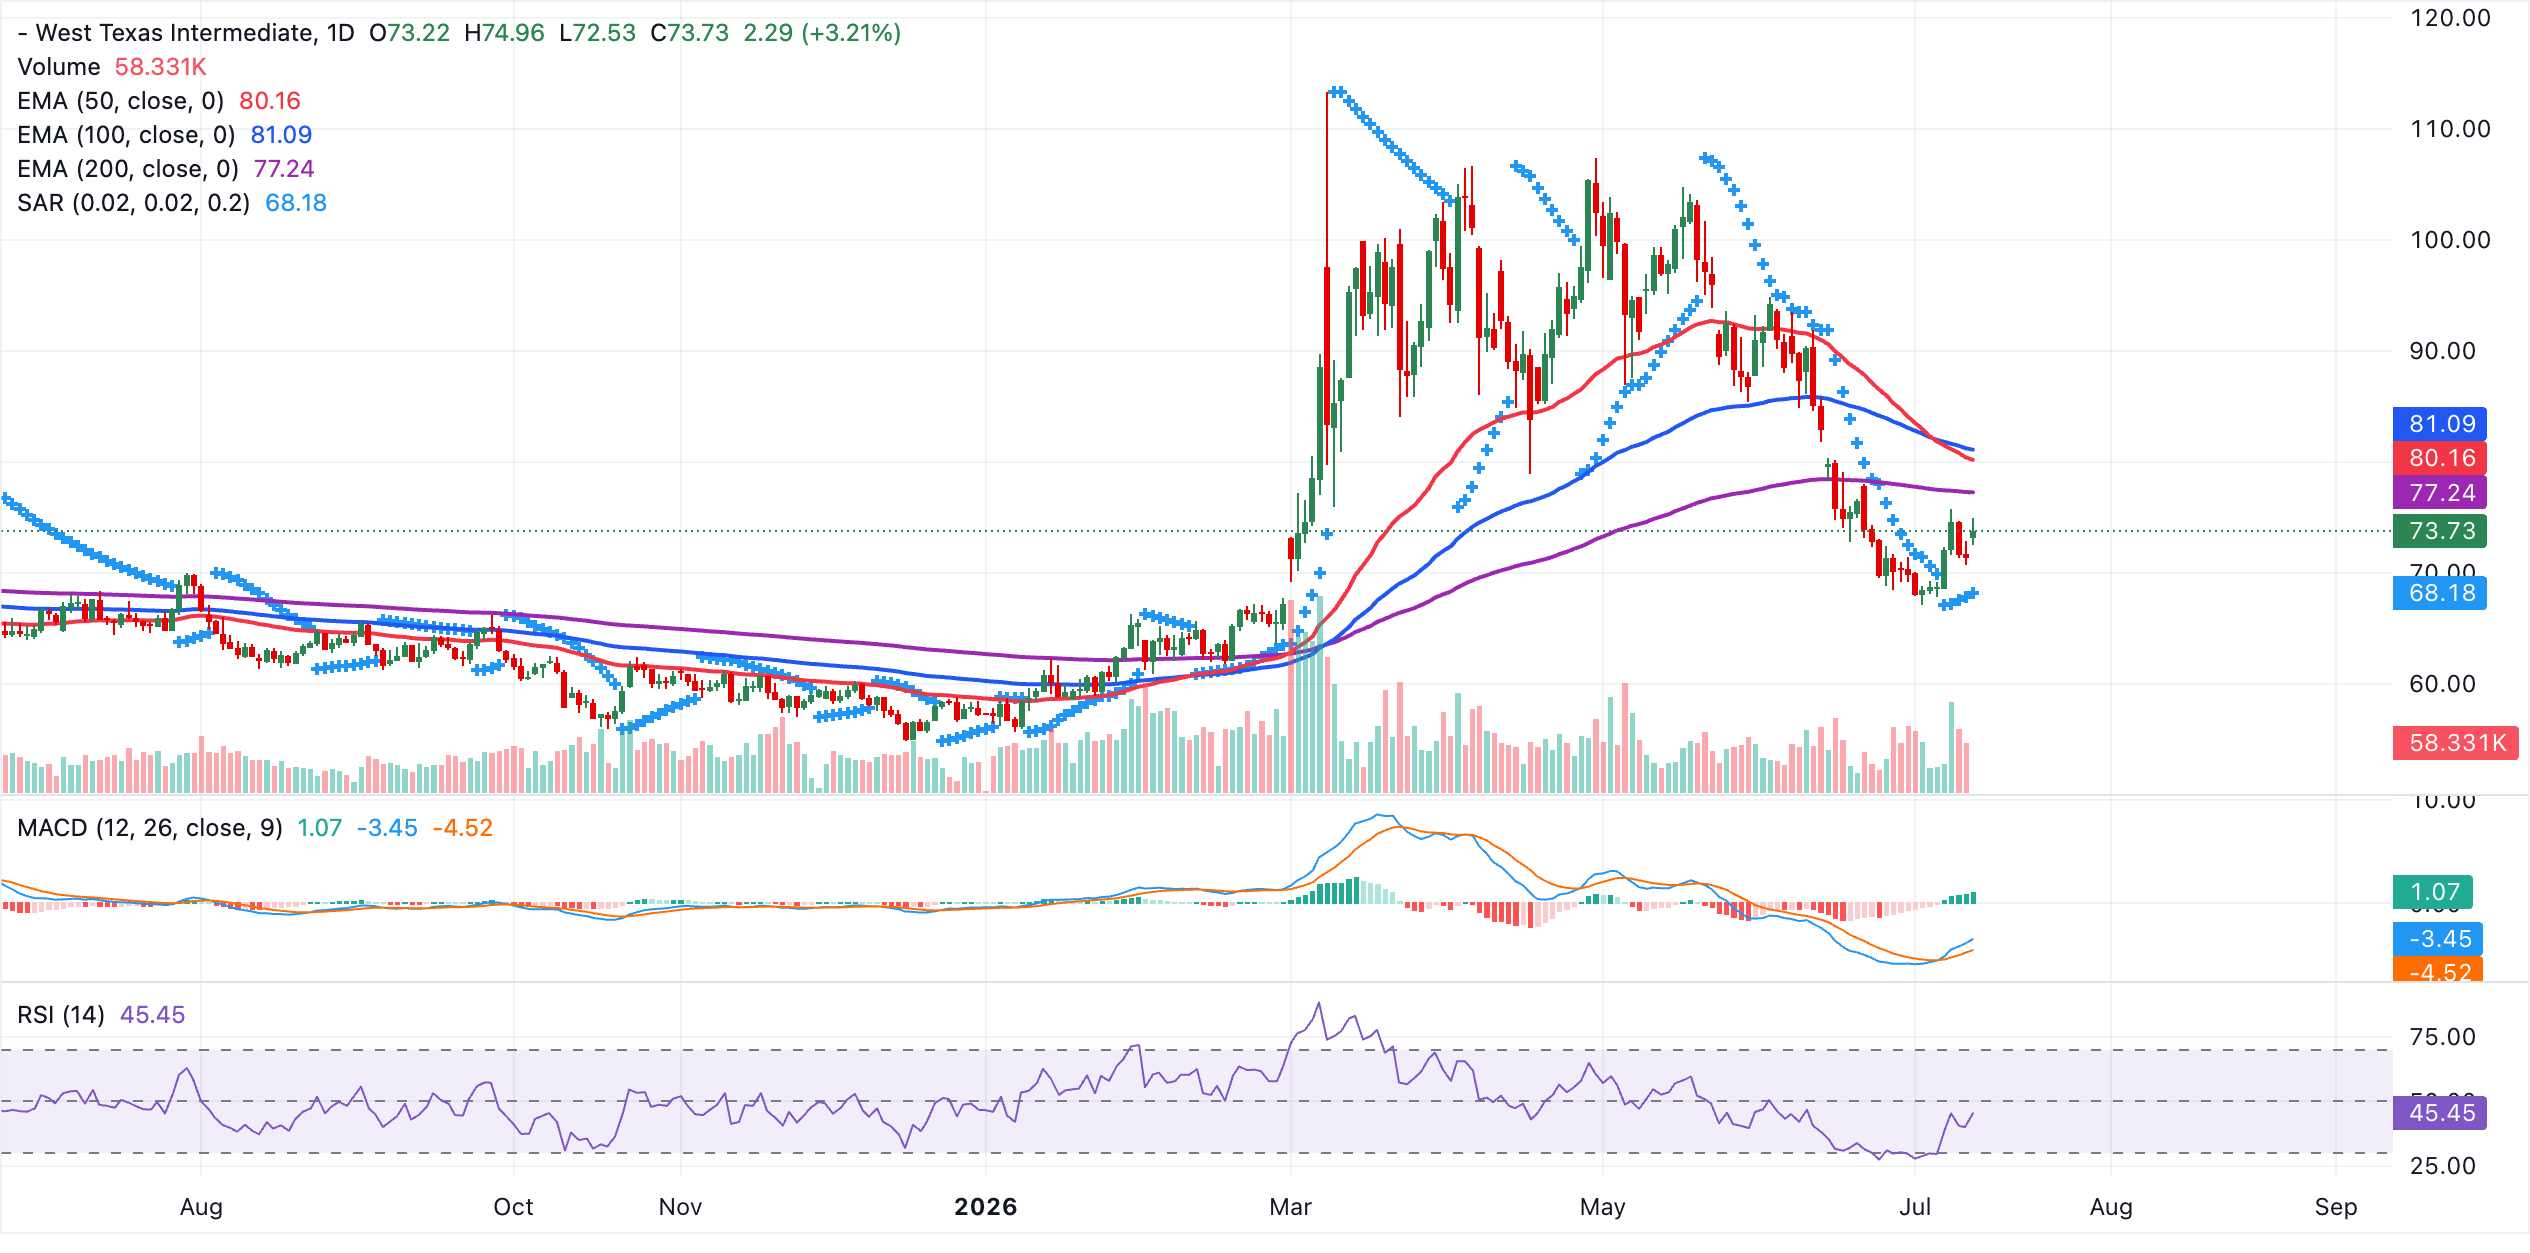
Moreover, heightened geopolitical tensions have fueled a surge in Crude Oil prices, with West Texas Intermediate (WTI) trading around $74 per barrel at the time of writing.
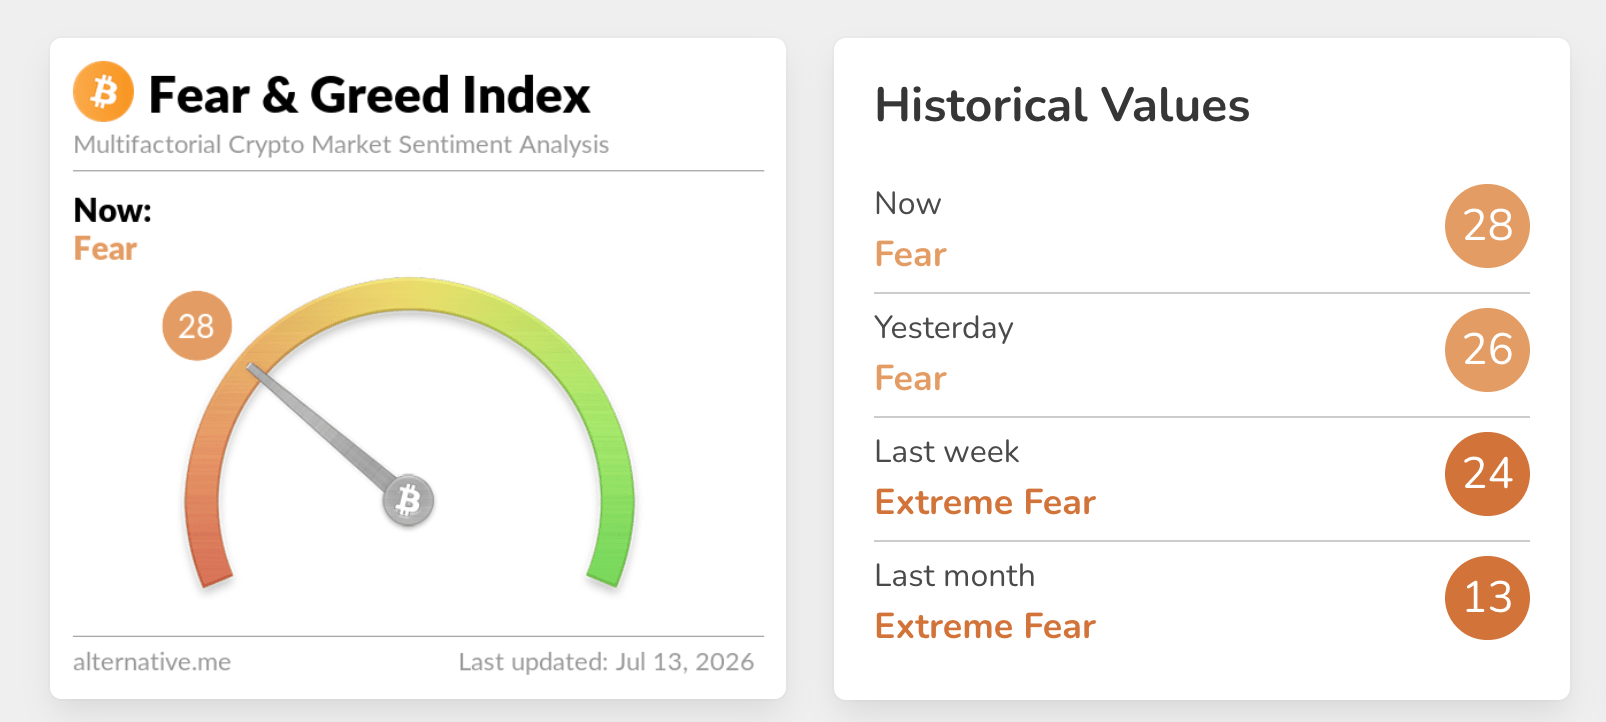
Sentiment in the crypto market remains rather low, despite marginal improvements in the Fear & Greed Index. The sentiment index is embedded in the Fear Territory at 28 on Monday, up slightly from 26 the day before and 24 last week. This shows that risk-averse sentiment continues to dominate the crypto market, as investors assess the impact of fresh attacks between the US and Iran.
Price analysis: Bitcoin wobbles near support as headwinds escalate
Bitcoin retains a bearish near-term tone as it holds below the 50-day, 100-day and 200-day Exponential Moving Averages (EMAs) clustered from roughly $65,200 to $74,600. The Relative Strength Index (RSI) has slipped back toward the high-40s on the daily chart, suggesting fading bullish momentum after a recent recovery, while the Moving Average Convergence Divergence (MACD) histogram softens but remains slightly positive, implying that upside attempts are struggling to extend against the prevailing overhead supply.
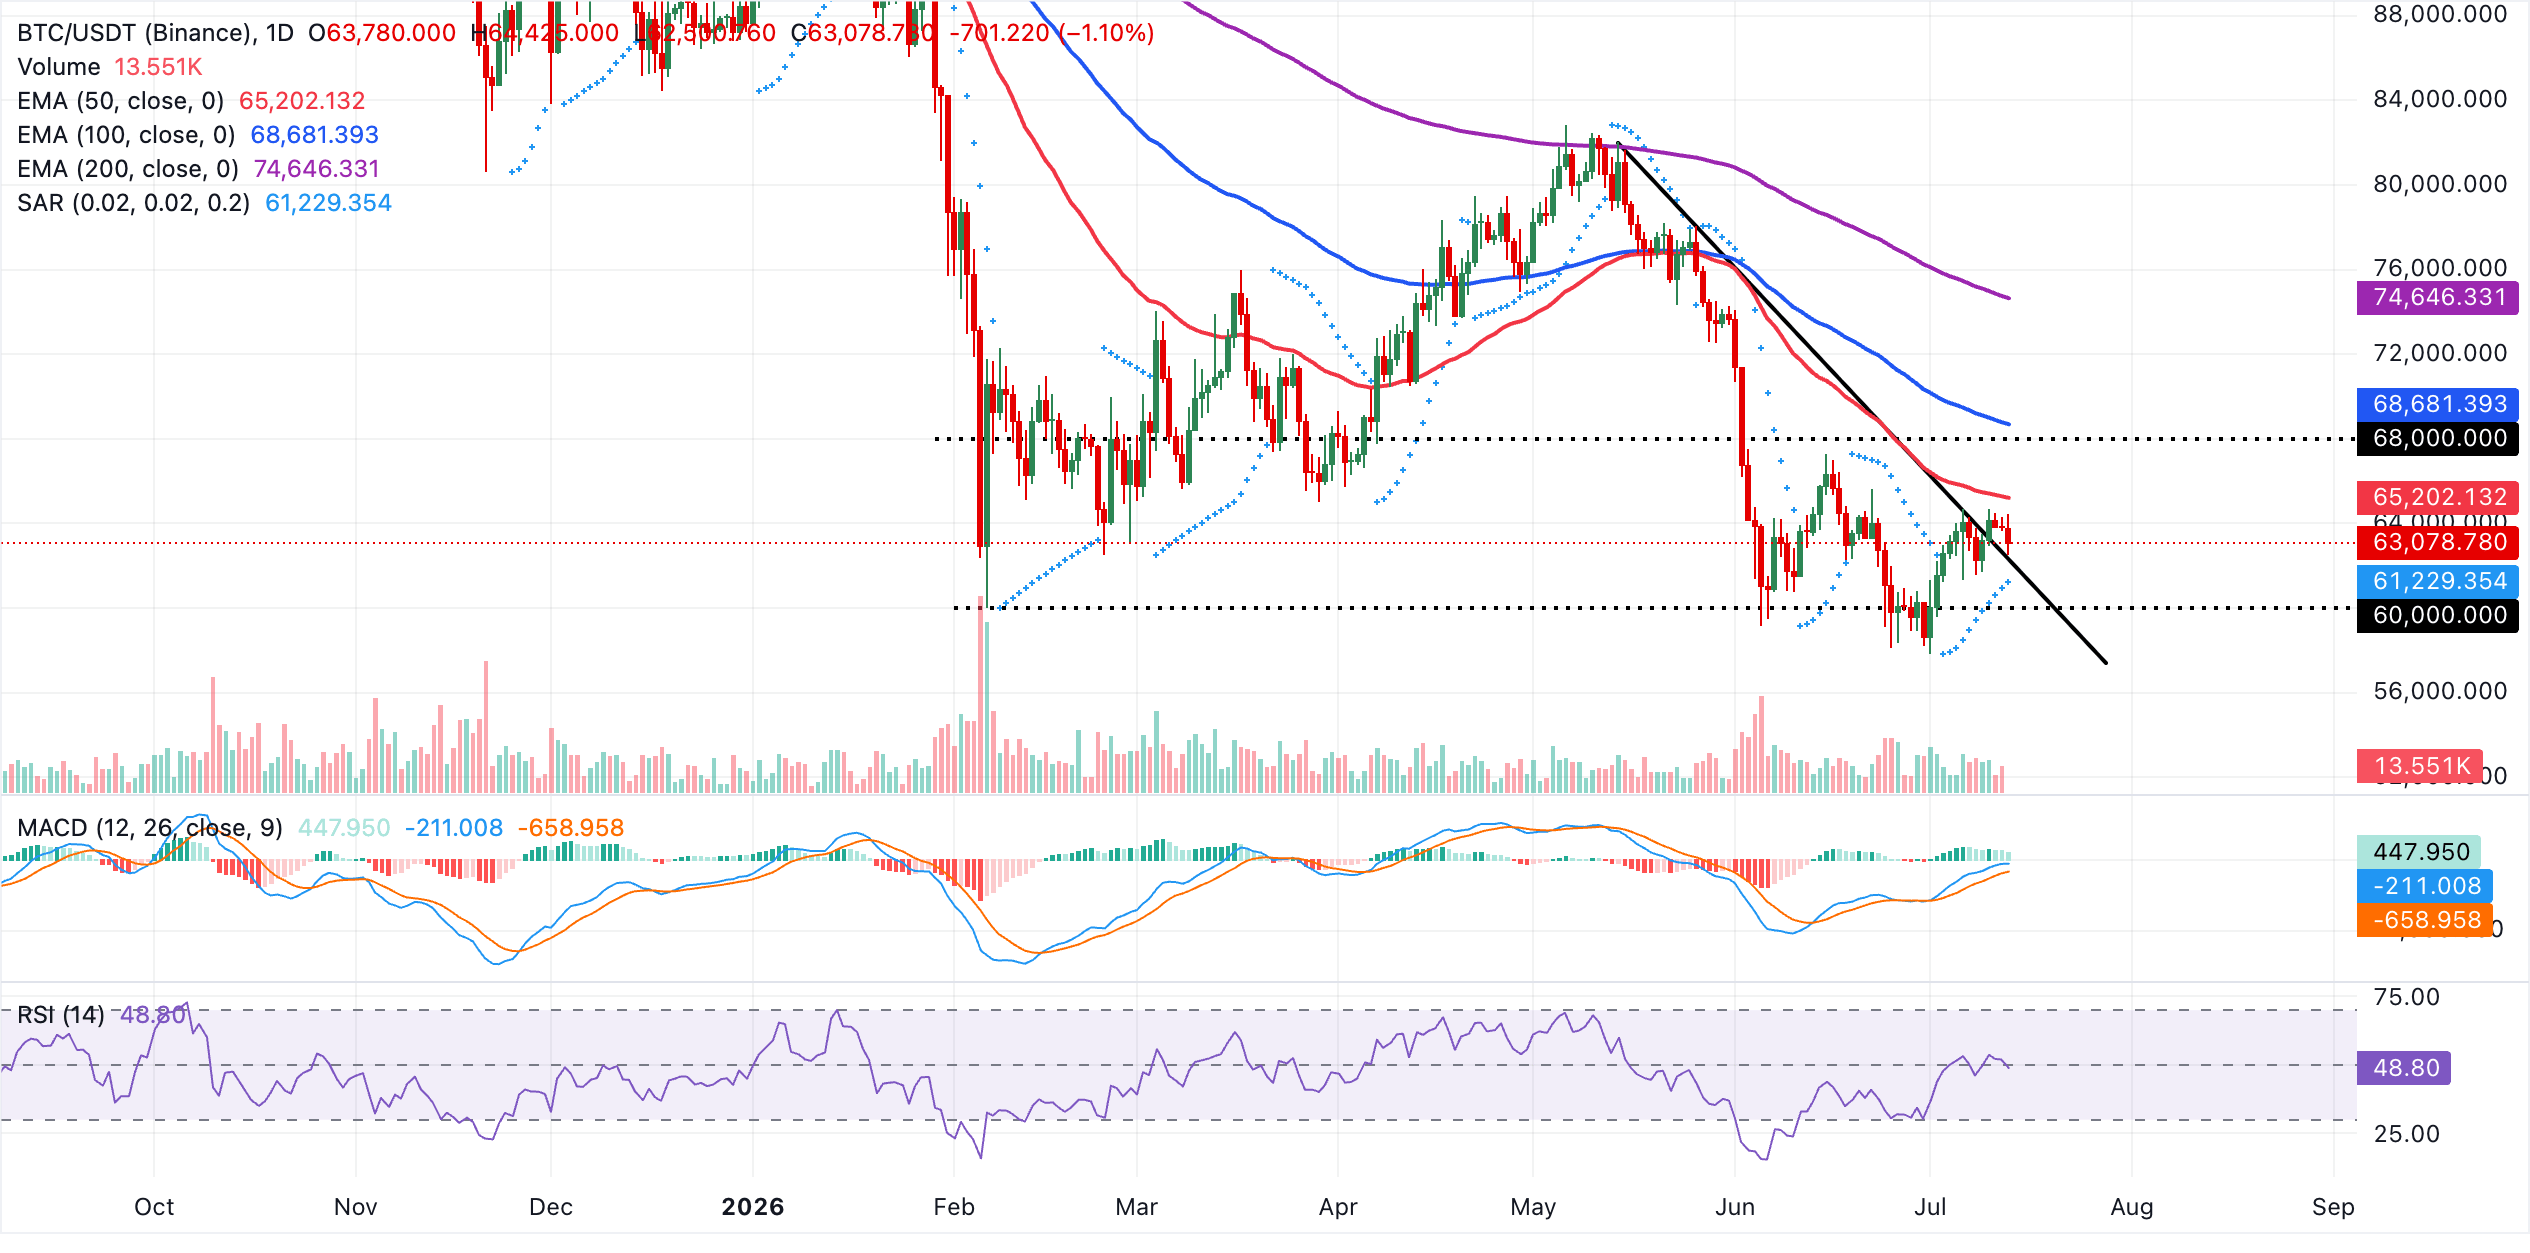
On the topside, immediate resistance emerges at the 50-day EMA near $65,200, and a break above this barrier would expose the 100-day EMA around $68,680, with the 200-day EMA near $74,650 acting as a more distant cap within the dominant downtrend. Looking down, initial support is seen at the reclaimed descending trendline around $62,170, followed by the Parabolic SAR zone near $61,230. A daily close back below these levels would reopen the path toward lower lows and reinforce the broader bearish bias.
Altcoins outlook: Ethereum and XRP retain technical weakness
Ethereum maintains a capped tone as it holds below the 50-day EMA at roughly $1,800 and well under the 100-day and 200-day EMAs near $1,947 and $2,225, respectively. Momentum, however, remains mildly constructive, with the RSI hovering around 55 on the daily chart and the MACD still positive, suggesting that downside pressure is moderating even as the broader downtrend defined by the descending trendline resistance continues to weigh.
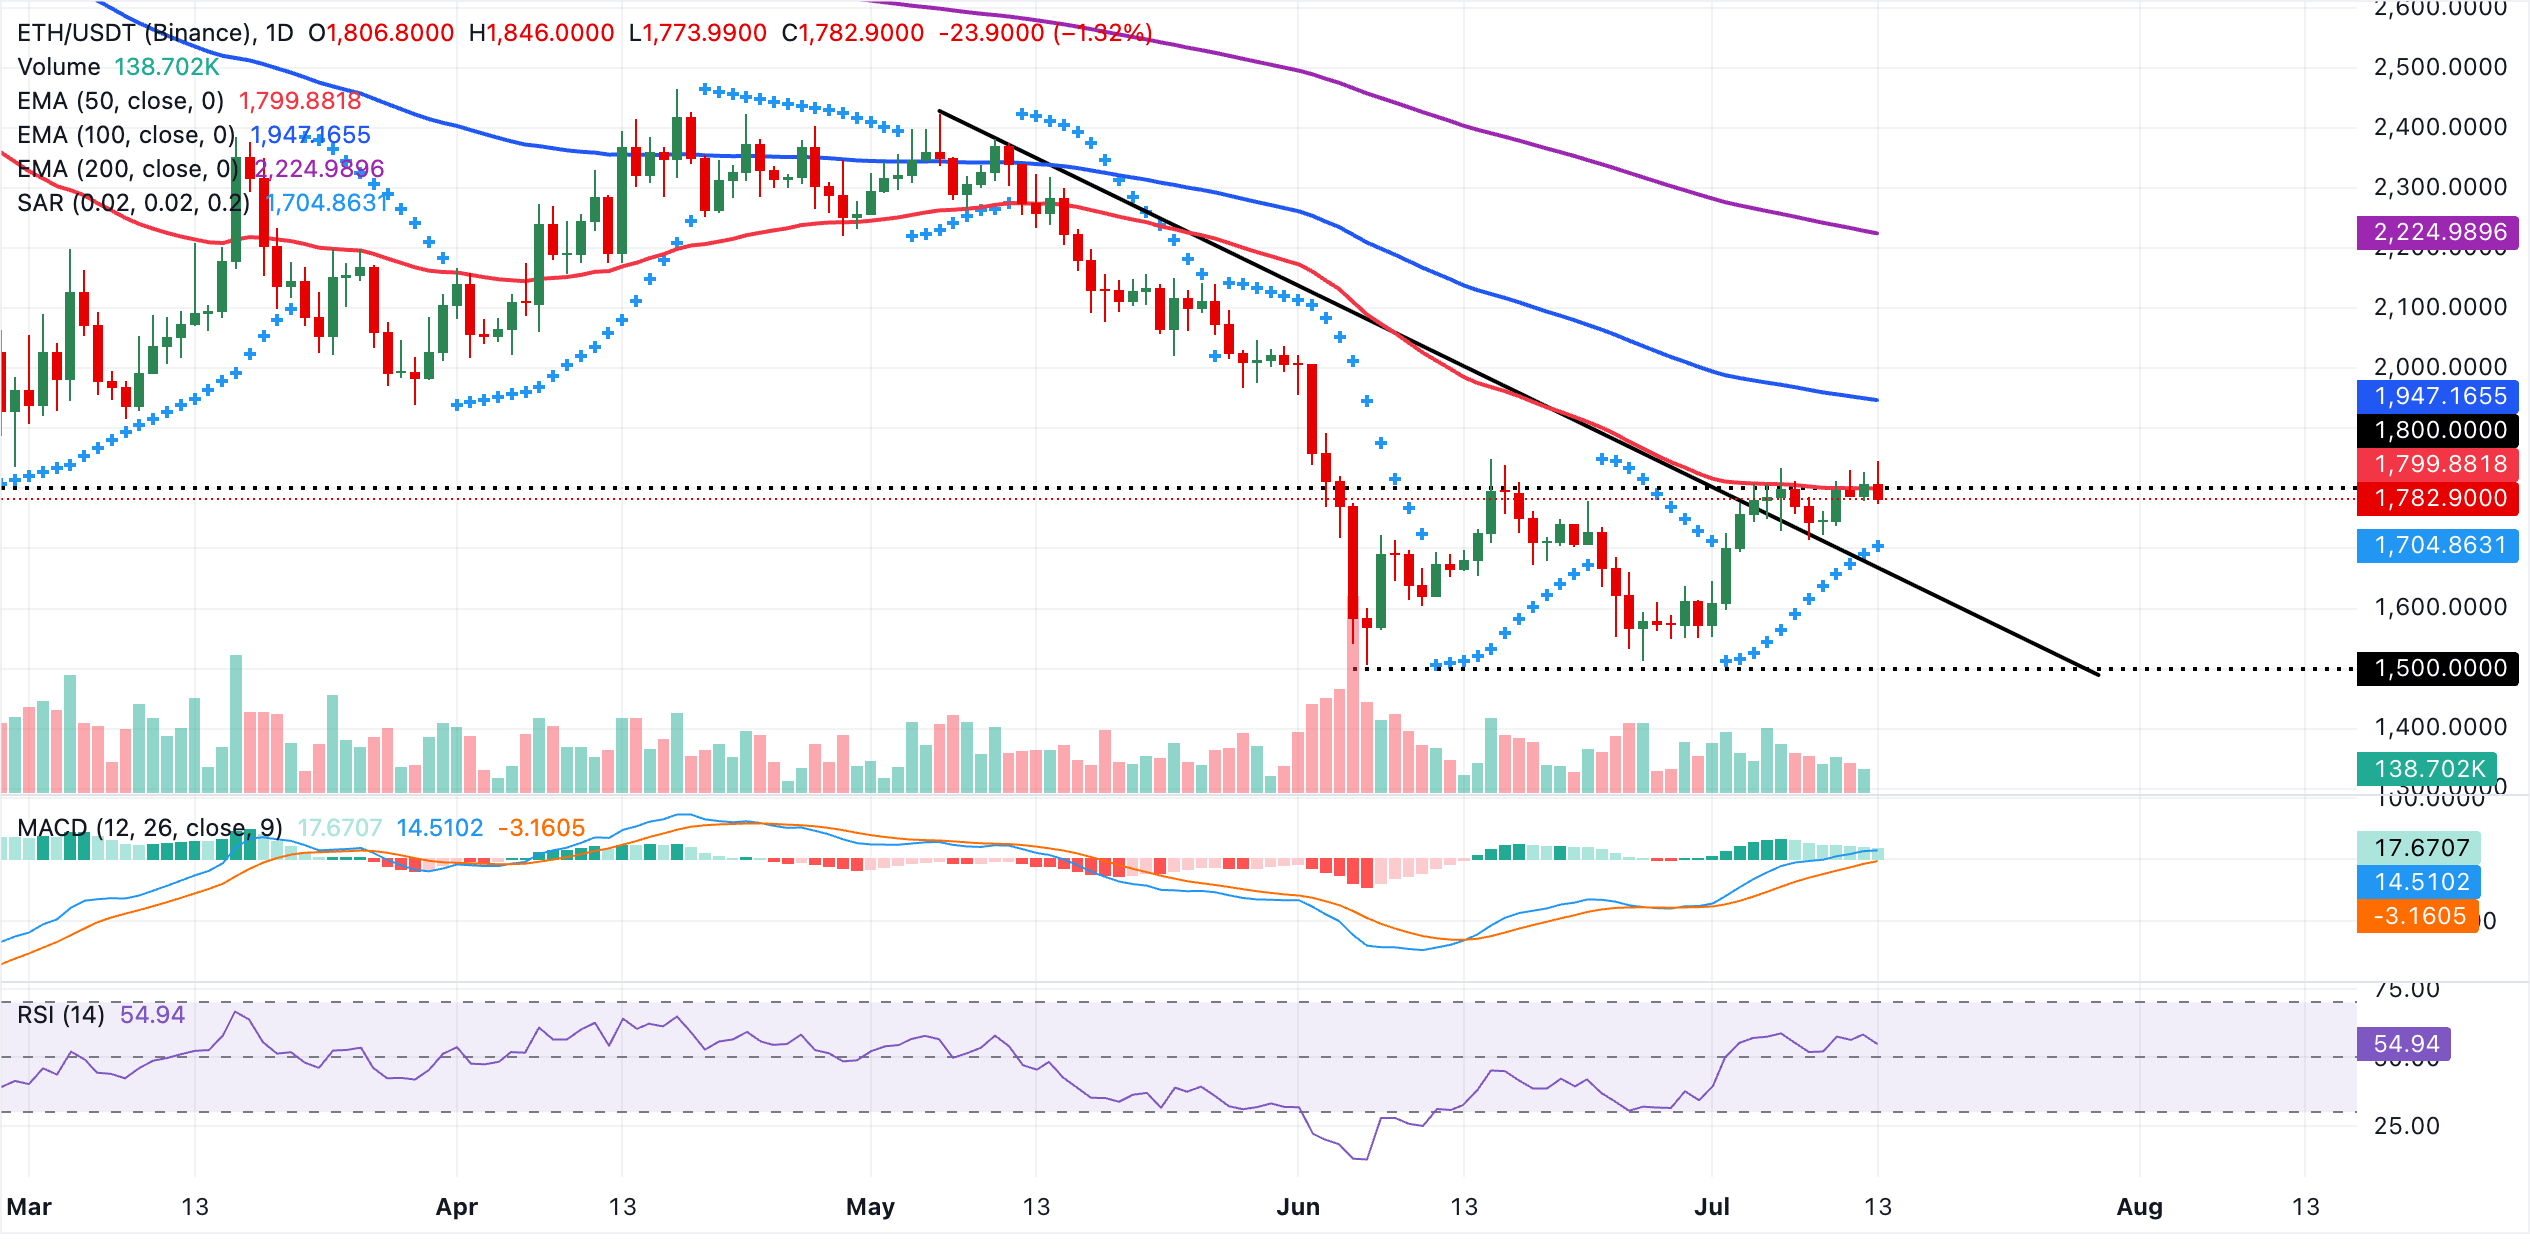
Immediate resistance sits at the 50-day EMA around $1,800, followed by the 100-day EMA near $1,947 and then the more distant 200-day EMA close to $2,225, while the broader descending trend line reinforces this overhead supply zone. On the downside, initial support is offered by the latest Parabolic SAR print near $1,705, where a break would reopen the path toward lower levels within the prevailing medium-term bearish structure.
XRP, on the other hand, trades at $1.08, keeping a bearish bias as price holds well below the 50-day, the 100-day and the 200-day EMAs, which fan out above the market and suggest a capped medium-term structure. The RSI hovering near 42 on the daily chart, hints at subdued buying power despite a marginally positive MACD histogram, which only modestly tempers downside pressure.
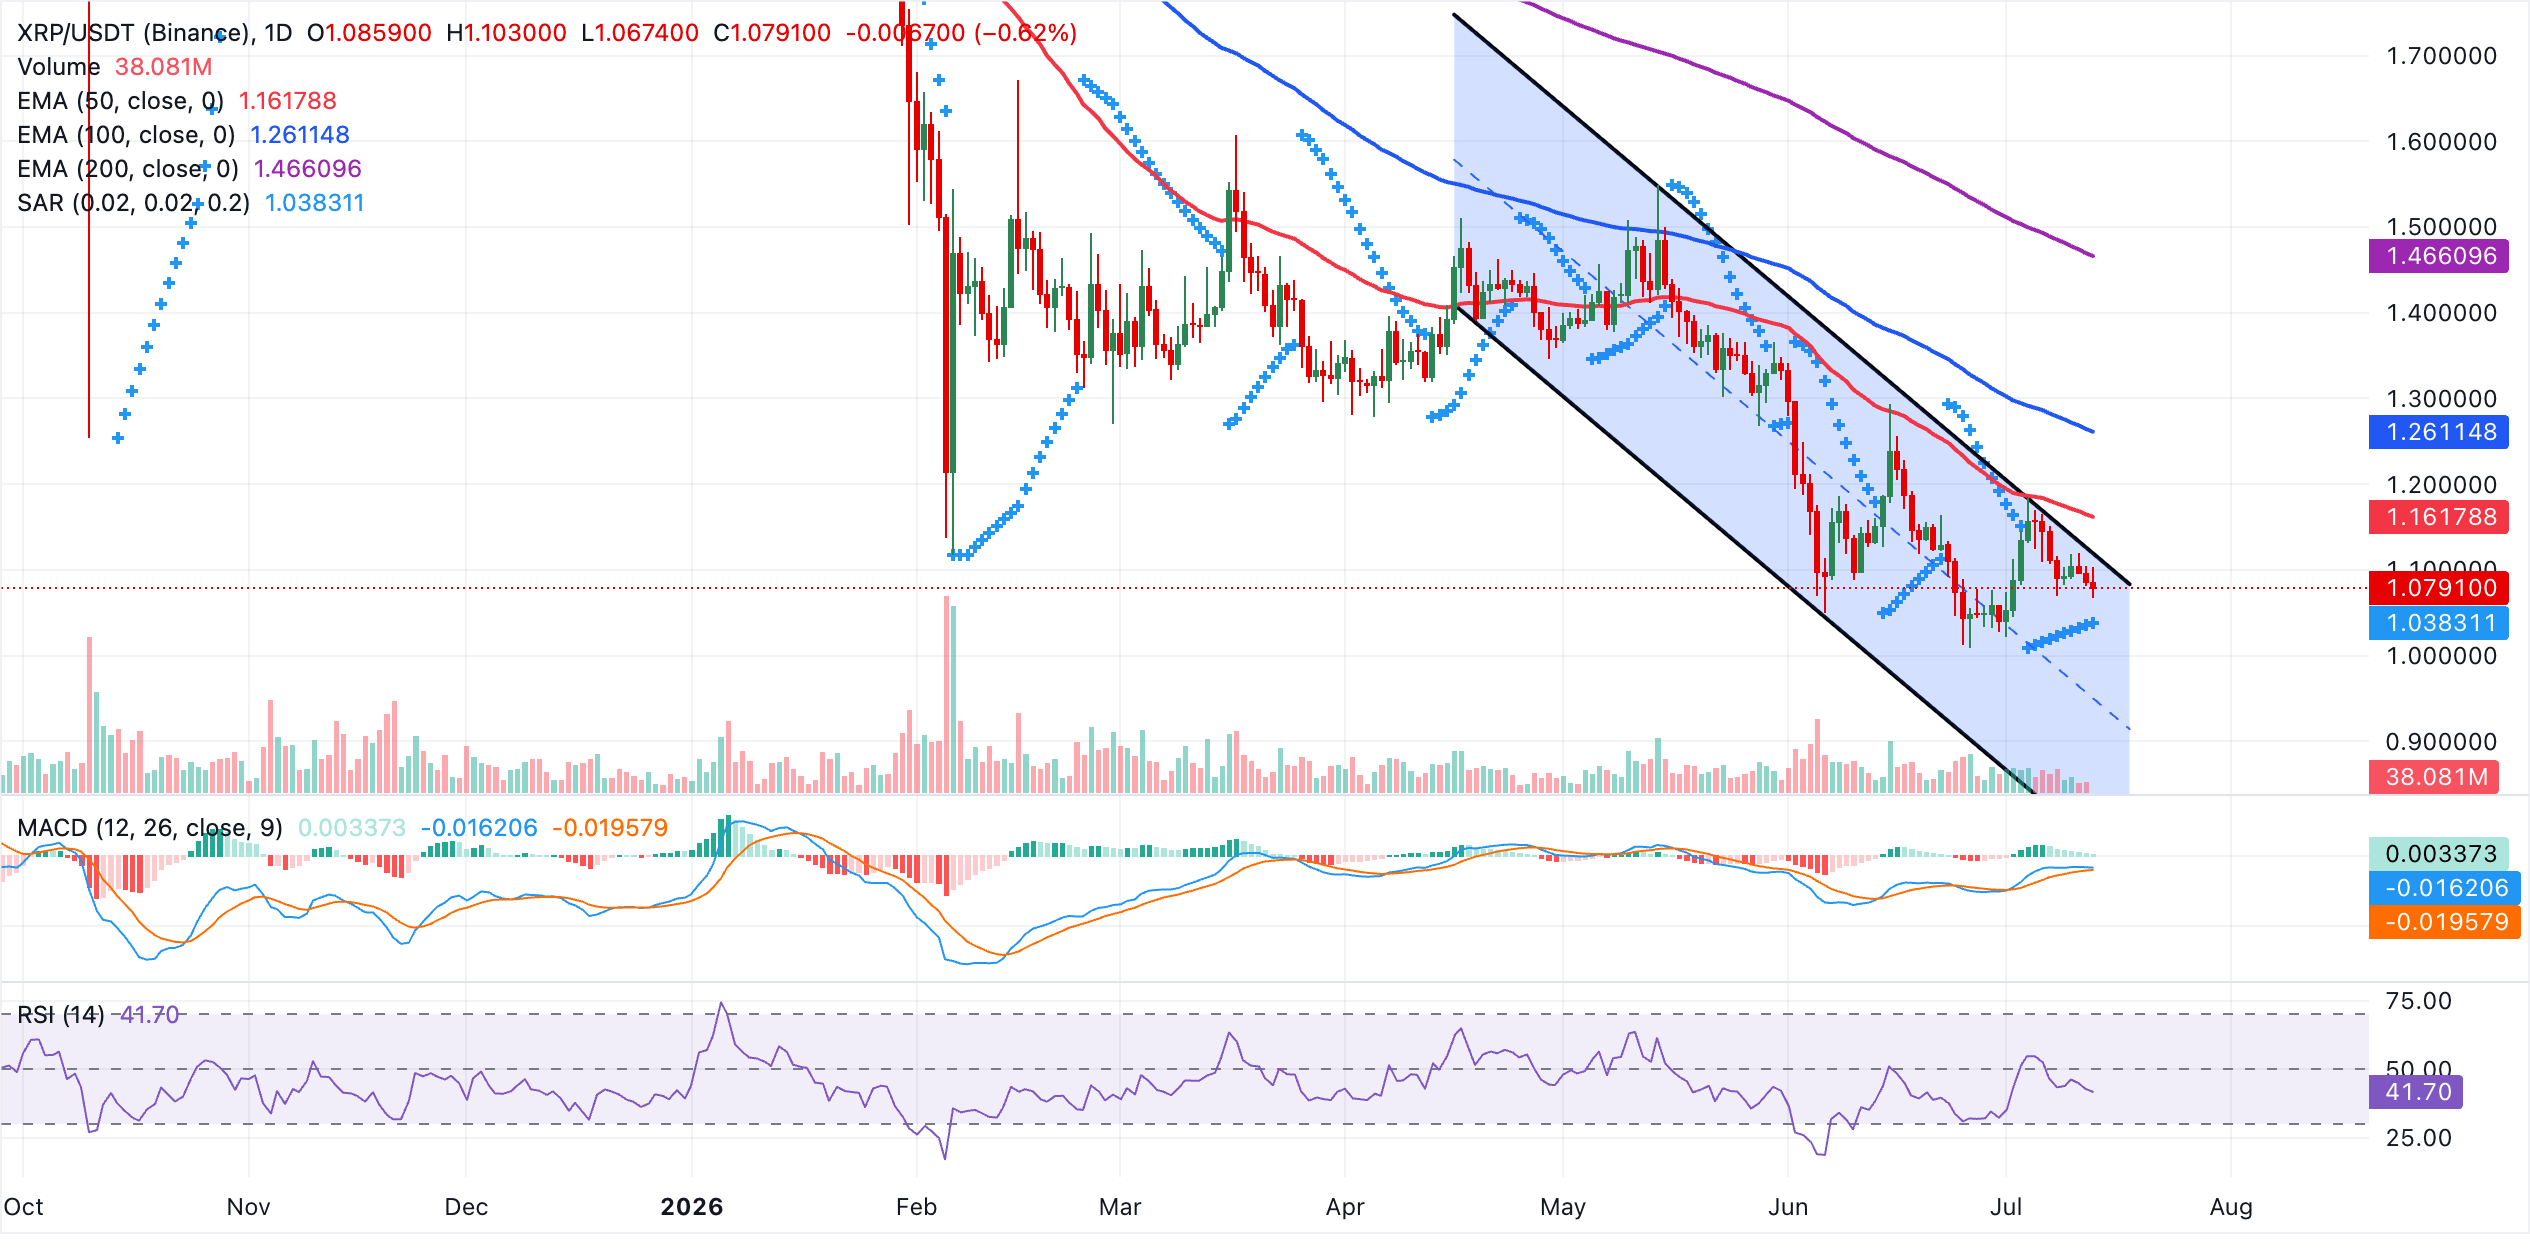
Initial resistance is seen at the channel top around $1.12, followed by the 50-day EMA near $1.16, with the 100-day EMA at $1.26 reinforcing a broader supply band ahead of the prior channel starting high around $1.41 and the 200-day EMA at $1.47. Looking down, immediate support aligns with the Parabolic SAR at $1.04, and a decisive break lower would expose the channel bottom near $0.78 as the next major demand zone.
(The technical analysis of this story was written with the help of an AI tool. Know more.)
Bitcoin, altcoins, stablecoins FAQs
Bitcoin is the largest cryptocurrency by market capitalization, a virtual currency designed to serve as money. This form of payment cannot be controlled by any one person, group, or entity, which eliminates the need for third-party participation during financial transactions.
Altcoins are any cryptocurrency apart from Bitcoin, but some also regard Ethereum as a non-altcoin because it is from these two cryptocurrencies that forking happens. If this is true, then Litecoin is the first altcoin, forked from the Bitcoin protocol and, therefore, an “improved” version of it.
Stablecoins are cryptocurrencies designed to have a stable price, with their value backed by a reserve of the asset it represents. To achieve this, the value of any one stablecoin is pegged to a commodity or financial instrument, such as the US Dollar (USD), with its supply regulated by an algorithm or demand. The main goal of stablecoins is to provide an on/off-ramp for investors willing to trade and invest in cryptocurrencies. Stablecoins also allow investors to store value since cryptocurrencies, in general, are subject to volatility.
Bitcoin dominance is the ratio of Bitcoin's market capitalization to the total market capitalization of all cryptocurrencies combined. It provides a clear picture of Bitcoin’s interest among investors. A high BTC dominance typically happens before and during a bull run, in which investors resort to investing in relatively stable and high market capitalization cryptocurrency like Bitcoin. A drop in BTC dominance usually means that investors are moving their capital and/or profits to altcoins in a quest for higher returns, which usually triggers an explosion of altcoin rallies.
Recommended Articles


