


Ripple Price Forecast: XRP extends correction as downside risks intensify
- XRP declines for the second consecutive day, weighed down by sustained risk-off sentiment and a weak technical structure.
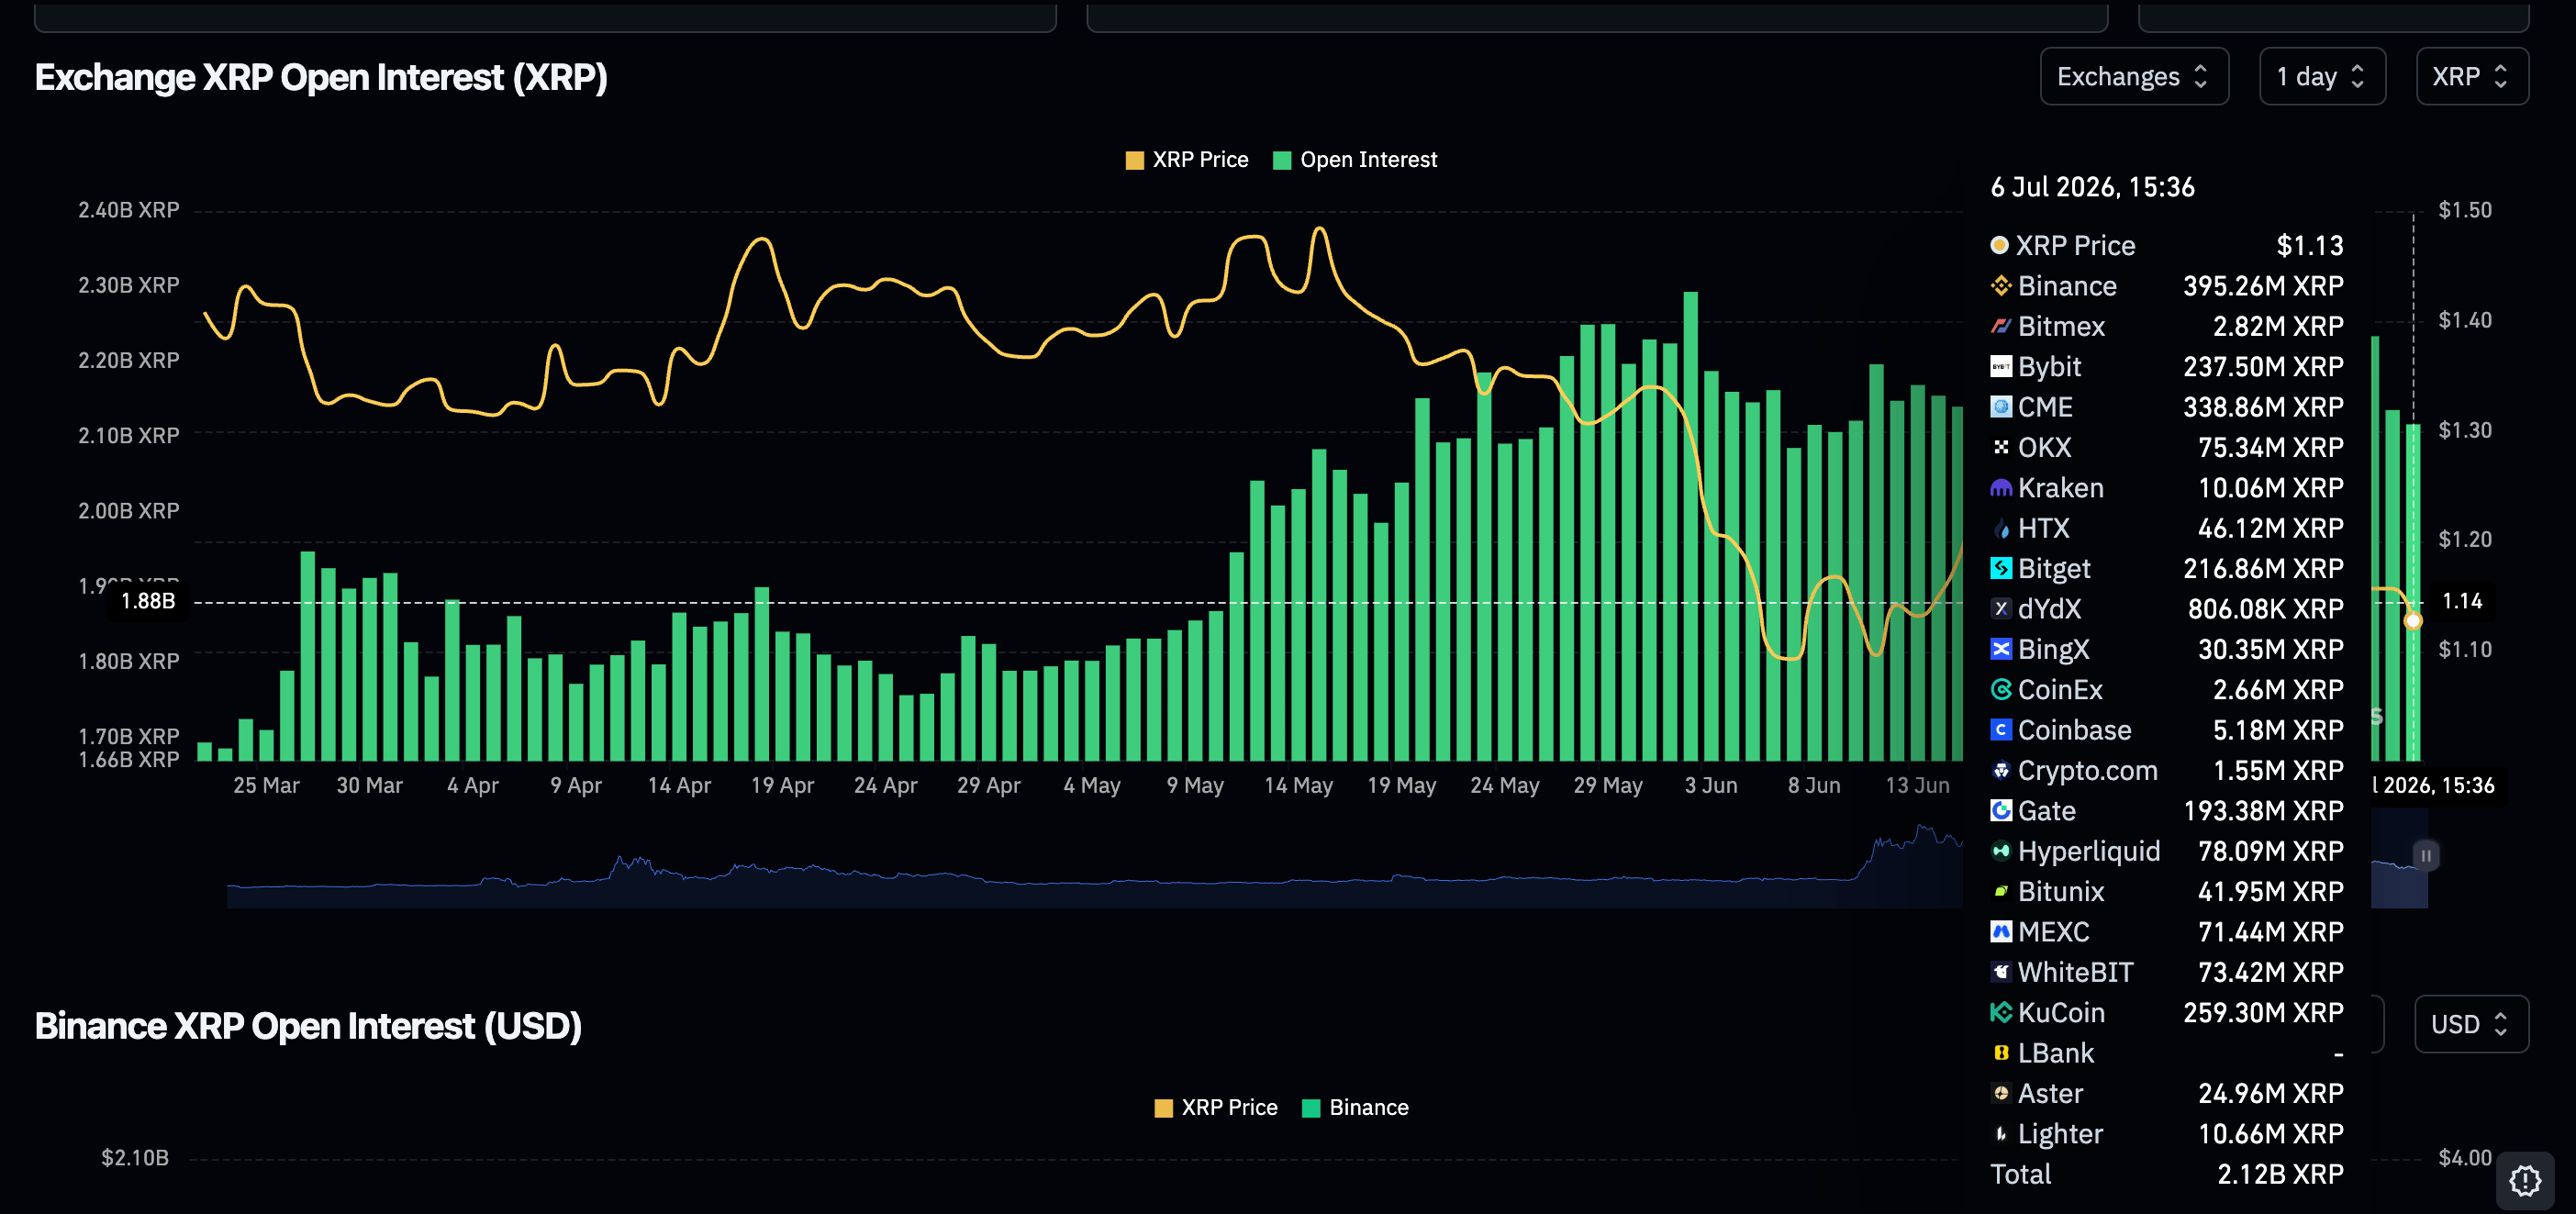
- XRP is at risk of extending its decline amid cooling retail demand, with futures Open Interest falling to 2.12 billion XRP.
- XRP momentum indicators are mixed, with the MACD upholding a buy signal while the RSI slips into bearish territory.
Ripple (XRP) sustains losses on Monday, edging lower toward the short-term $1.10 support. XRP failed to sustain momentum above $1.20 on the previous day, prompting profit-taking amid a broader crypto market drawdown attributed to mild inflows into related digital investment products, declining retail participation and macroeconomic uncertainty.
XRP retail activity slows amid mild capital inflows
Retail participation in the XRP derivatives market remains generally low despite the mild institutional inflows through spot Exchange-Traded Funds (ETFs). CoinGlass data show that perpetual Open Interest (OI) has declined to 2.12 billion XRP on Monday, from 2.14 billion XRP the previous day.
A wider scope highlights a steep drawdown from 2.38 billion XRP recorded on June 23, while further cooling could limit the token’s recovery potential.
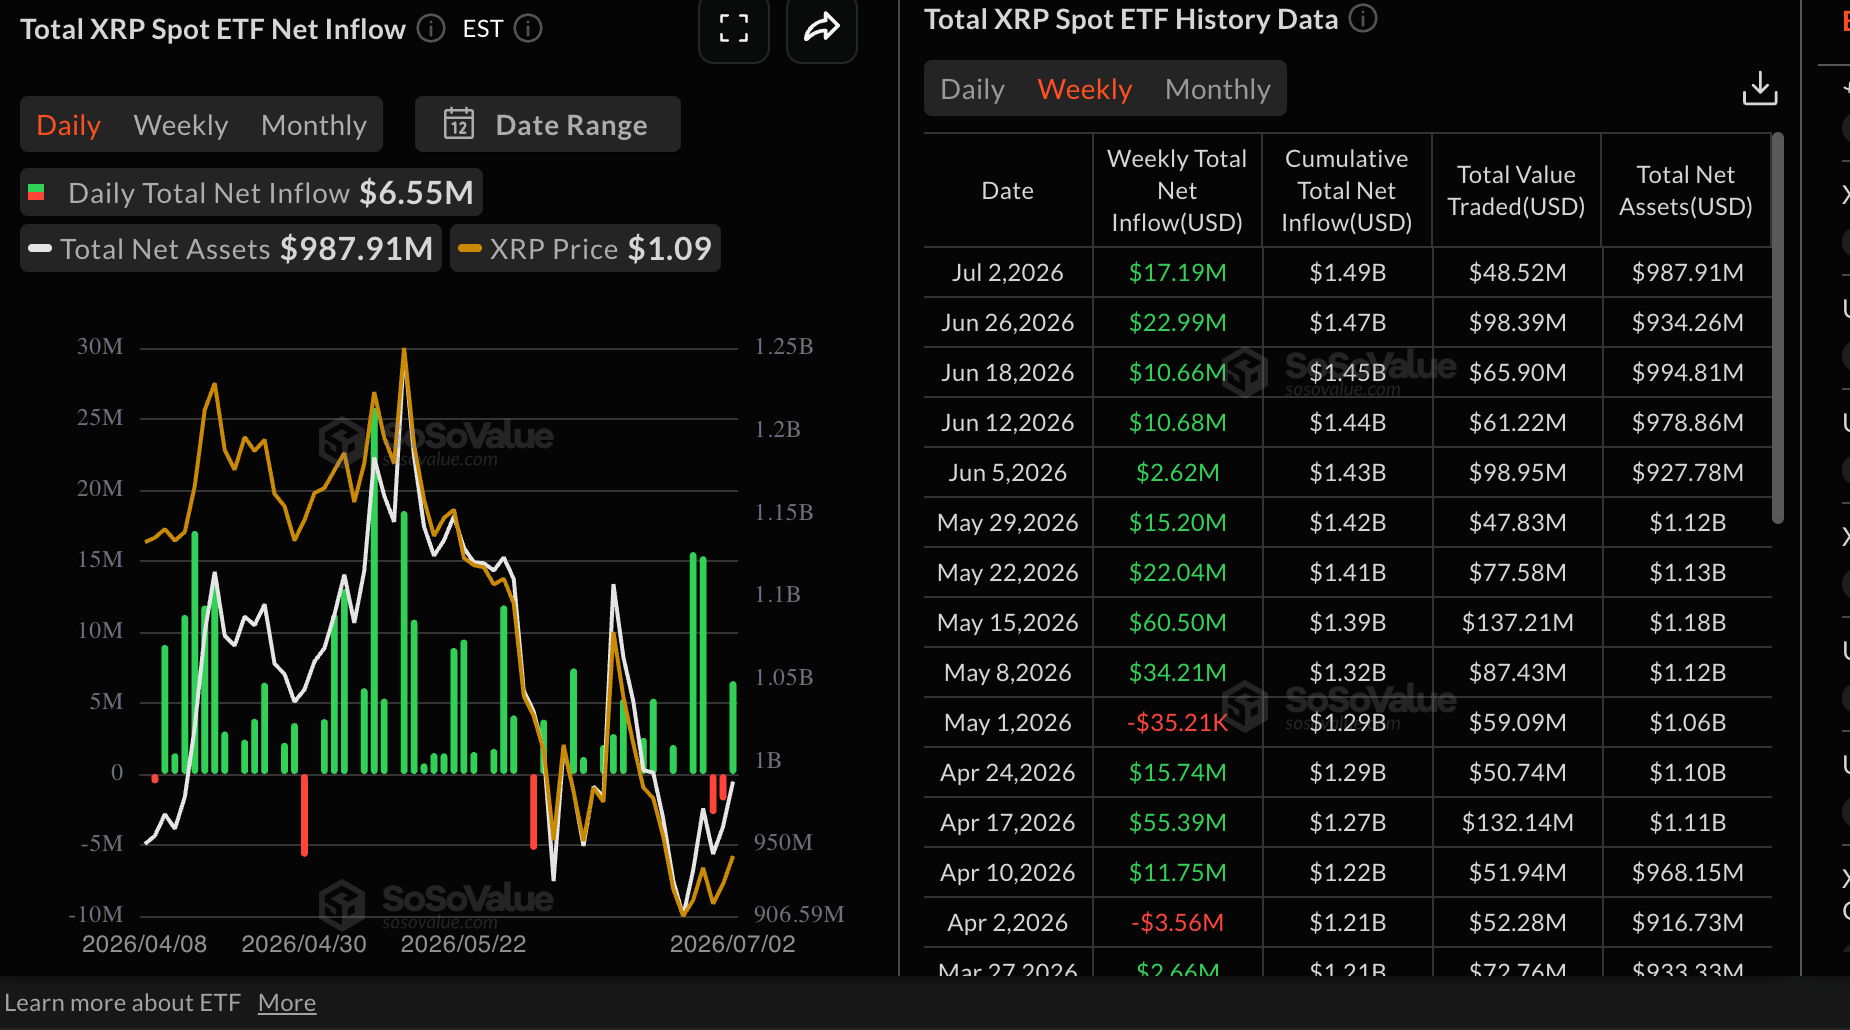
Meanwhile, interest in XRP spot ETFs has held steady, outperforming other major assets such as Bitcoin (BTC) and Ethereum (ETH), with nearly $12 million in inflows last week. With nine straight weeks of inflows, interest in XRP-related digital investment products remains intact despite the headwinds and broader risk-off sentiment.
Cumulative inflows hold steady at $1.49 billion while net assets under management average $988 million, according to SoSoValue data.
Price analysis: XRP slides, aiming for $1.10 support
XRP pair remains confined within a broader downward parallel channel and trades well below the 50-day, 100-day and 200-day Exponential Moving Averages (EMAs) at $1.18, $1.29 and $1.50 respectively, which keeps the near-term bias decisively bearish.
At the same time, the remittance token holds above the Bollinger Bands' middle boundary at $1.10, suggesting some short-term stabilization, but the sequence of descending long-term EMAs hints that rallies are more likely to be sold than sustained.
Still, a mildly positive Moving Average Convergence Divergence (MACD) histogram on the daily chart shows that XRP has the potential to rebound if traders reengage and defend the $1.10 psychological support.
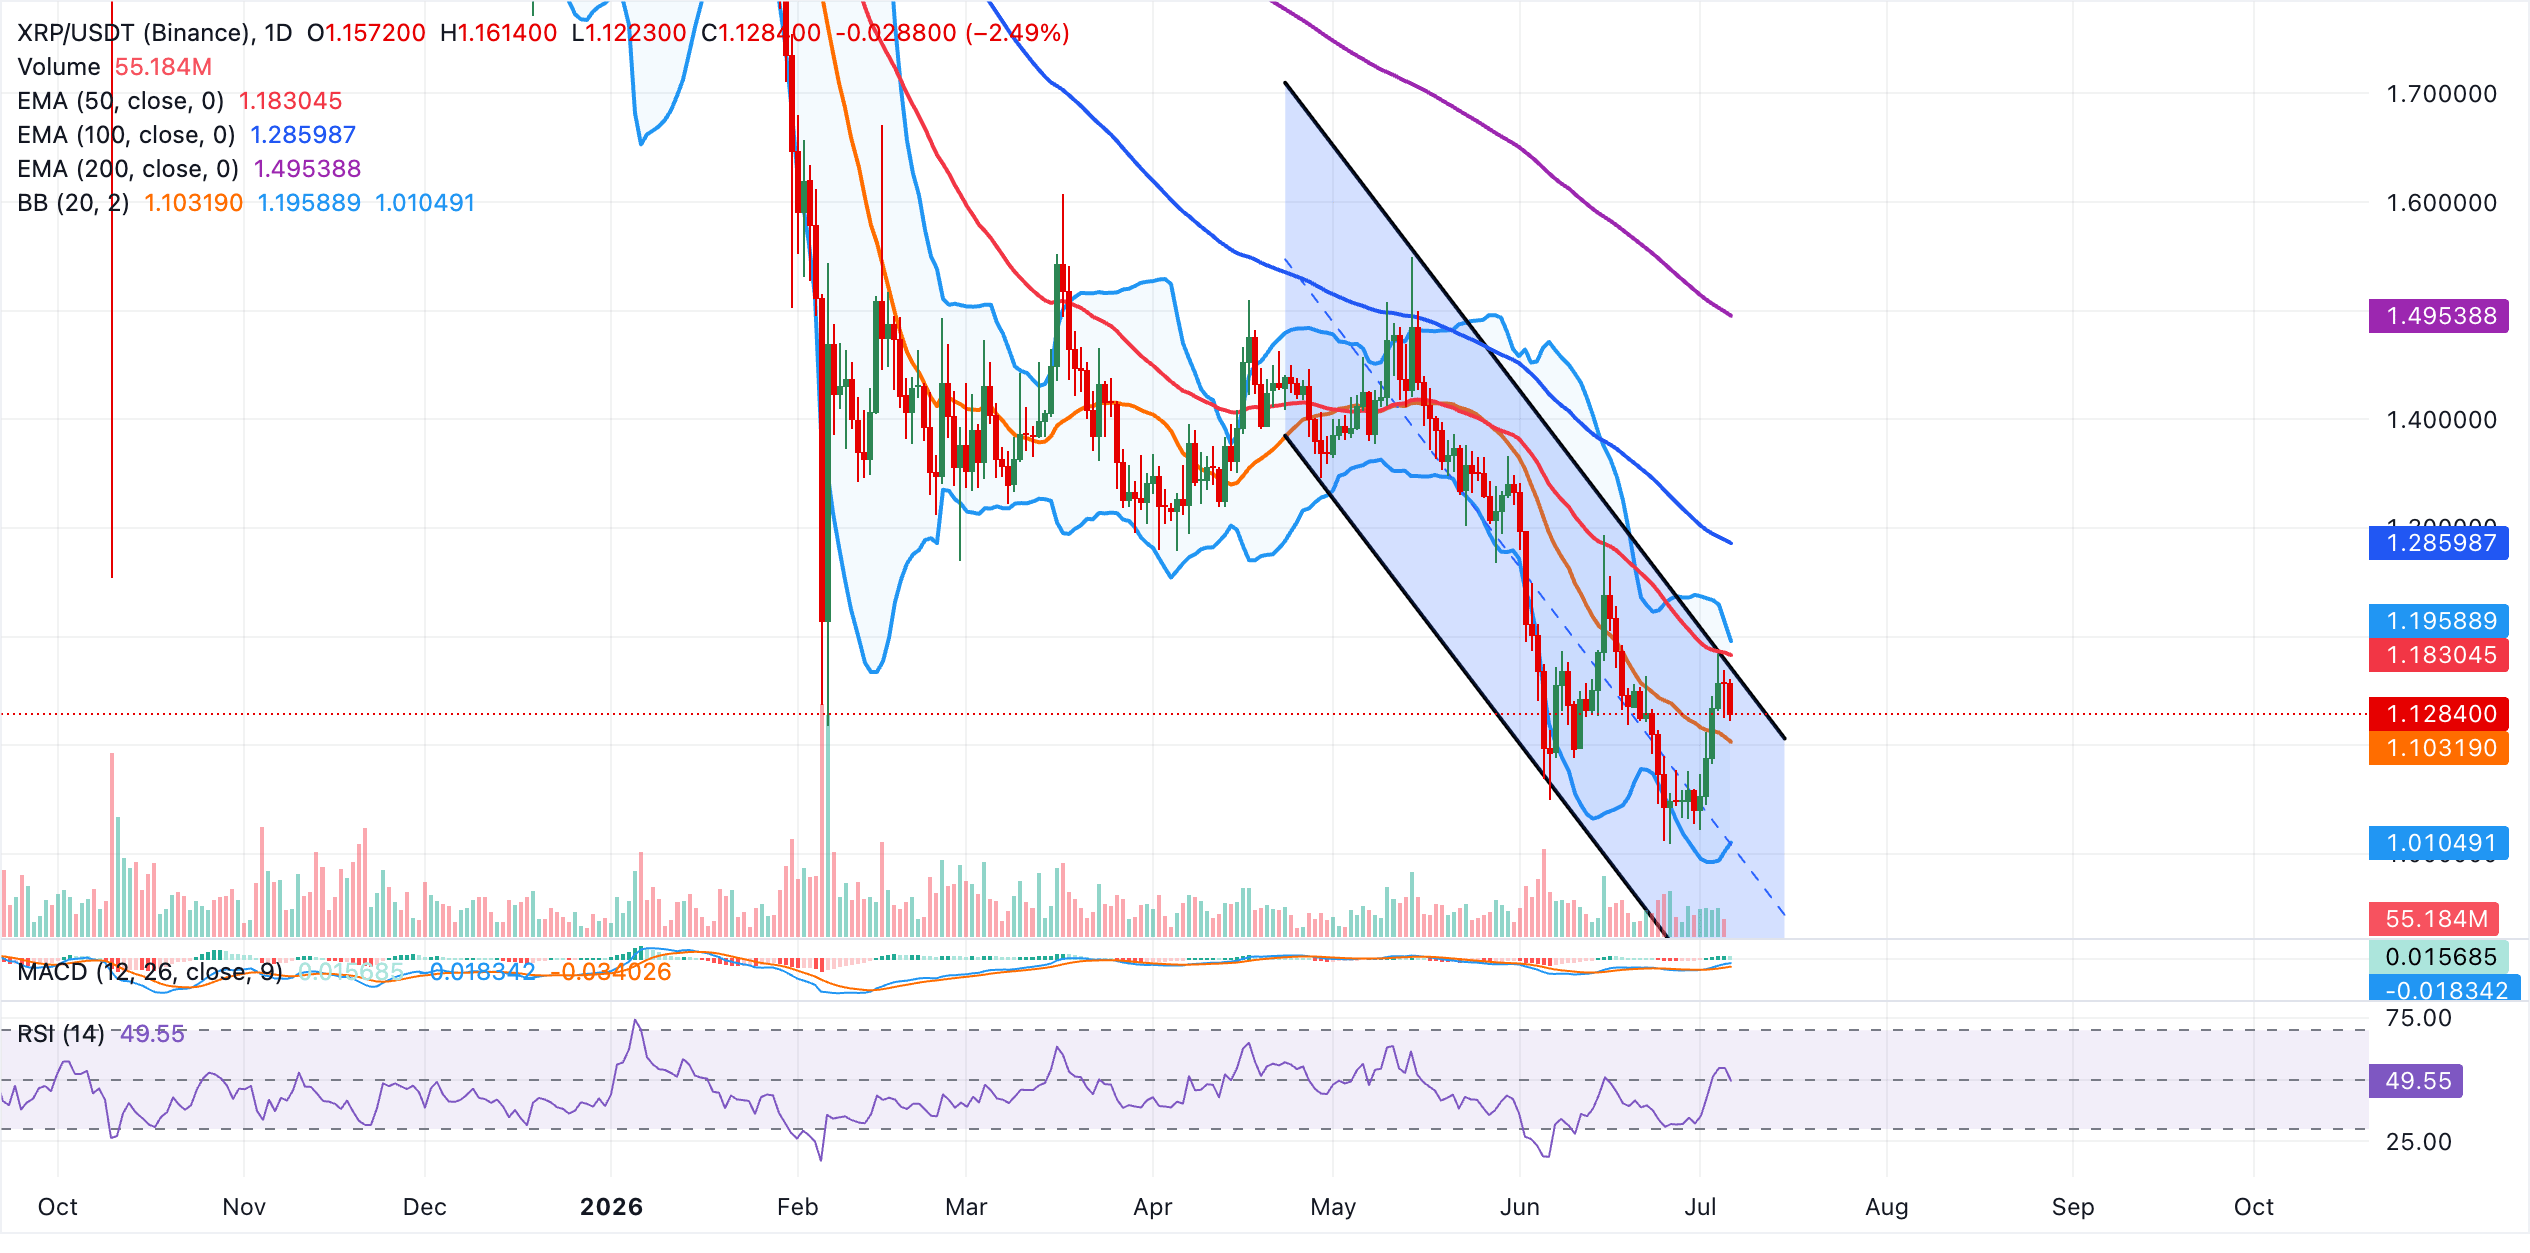
Initial resistance is aligned with the upper boundary of the active downward channel near $1.17, followed by the 50-day EMA at $1.18 and the upper Bollinger Band around $1.20. A daily close above these clustered barriers would be needed to ease the prevailing downside pressure and open the door toward the 100-day EMA near $1.29 and the 200-day EMA around $1.50. Looking down, immediate support is seen at the Bollinger midline around $1.10, ahead of the lower Bollinger Band near $1.01. A deeper deterioration toward the channel floor around $0.84 cannot be ruled out if sellers regain control below the current pivot area.
(This article was created with the help of an Artificial Intelligence tool and reviewed by an editor. Know more.)
Crypto ETF FAQs
An Exchange-Traded Fund (ETF) is an investment vehicle or an index that tracks the price of an underlying asset. ETFs can not only track a single asset, but a group of assets and sectors. For example, a Bitcoin ETF tracks Bitcoin’s price. ETF is a tool used by investors to gain exposure to a certain asset.
Yes. The first Bitcoin futures ETF in the US was approved by the US Securities & Exchange Commission in October 2021. A total of seven Bitcoin futures ETFs have been approved, with more than 20 still waiting for the regulator’s permission. The SEC says that the cryptocurrency industry is new and subject to manipulation, which is why it has been delaying crypto-related futures ETFs for the last few years.
Yes. The SEC approved in January 2024 the listing and trading of several Bitcoin spot Exchange-Traded Funds, opening the door to institutional capital and mainstream investors to trade the main crypto currency. The decision was hailed by the industry as a game changer.
The main advantage of crypto ETFs is the possibility of gaining exposure to a cryptocurrency without ownership, reducing the risk and cost of holding the asset. Other pros are a lower learning curve and higher security for investors since ETFs take charge of securing the underlying asset holdings. As for the main drawbacks, the main one is that as an investor you can’t have direct ownership of the asset, or, as they say in crypto, “not your keys, not your coins.” Other disadvantages are higher costs associated with holding crypto since ETFs charge fees for active management. Finally, even though investing in ETFs reduces the risk of holding an asset, price swings in the underlying cryptocurrency are likely to be reflected in the investment vehicle too.
Recommended Articles


