

Ripple whales added 60 million XRP to their holdings in May, digesting developments in lawsuit
- Ripple whales, holding between 1 million and 10 million XRP, continued accumulating in May.
- XRP holders digested the developments in the SEC vs. Ripple lawsuit and await court rulings.
- XRP is likely to extend gains to $0.60, testing resistance at $0.51 on Thursday.
Ripple (XRP) is being accumulated by large wallet investors as XRP holders await a court ruling in the Securities and Exchange Commission’s (SEC) lawsuit against the firm. The altcoin’s accumulation by whales is a positive sign for XRPLedger’s native token.
XRP price sustained above $0.51 on Thursday, likely to extend gains to the psychologically important resistance level of $0.60.
Daily Digest Market Movers: Ripple Whales buy 60 million XRP in May
- Ripple whales holding between 1 million and 10 million XRP have added 60 million tokens to their holdings in May, as seen on crypto intelligence tracker Santiment.
- Typically, whale accumulation is considered bullish for an asset, XRP price could rally in response to the rising buying pressure from market participants.
%20[10.56.45,%2016%20May,%202024]-638514357091236586.png)
XRP price vs. XRP holdings of wallets that own 1 million to 10 million coins
- Santiment data shows that XRP holders have realized losses on their holdings in the past week.
- XRP traders have realized nearly $30 million in losses between May 7 and 15, which could be considered a sign of capitulation and a precursor to a recovery in the altcoin’s price. The Network Realized Profit/Loss metric helps identify the net profit/loss of all coins moved on a particular day on-chain.
%20[11.07.19,%2016%20May,%202024]-638514357391729742.png)
XRP Network Realized Profit/Loss
- The two indicators point towards gains in XRP price.
- XRP holders are awaiting a ruling in the SEC vs. Ripple lawsuit after the two sides completed filing of their briefs, replies and opposition in the remedies-phase.
Technical analysis: XRP could test resistance at $0.60
On the 4-hour and 1-day timeframes, the XRP/USDT chart shows signs of recovery in the altcoin. Ripple has sustained above $0.51 on Thursday and is likely to test resistance at the psychologically important $0.60 level.
XRP faces resistance at $0.5310 and $0.5951, the 50% and 78.6% Fibonacci retracement levels of the decline from the April 9 top of $0.6431 to the April 13 bottom of $0.4188.
The green bars above the neutral line on the Moving Average Convergence Divergence (MACD) indicator support XRP gains. RSI, a momentum indicator, reads 48.47, inching closer to the neutral zone at 50, signaling an increasing balance between bullish and bearish positions.
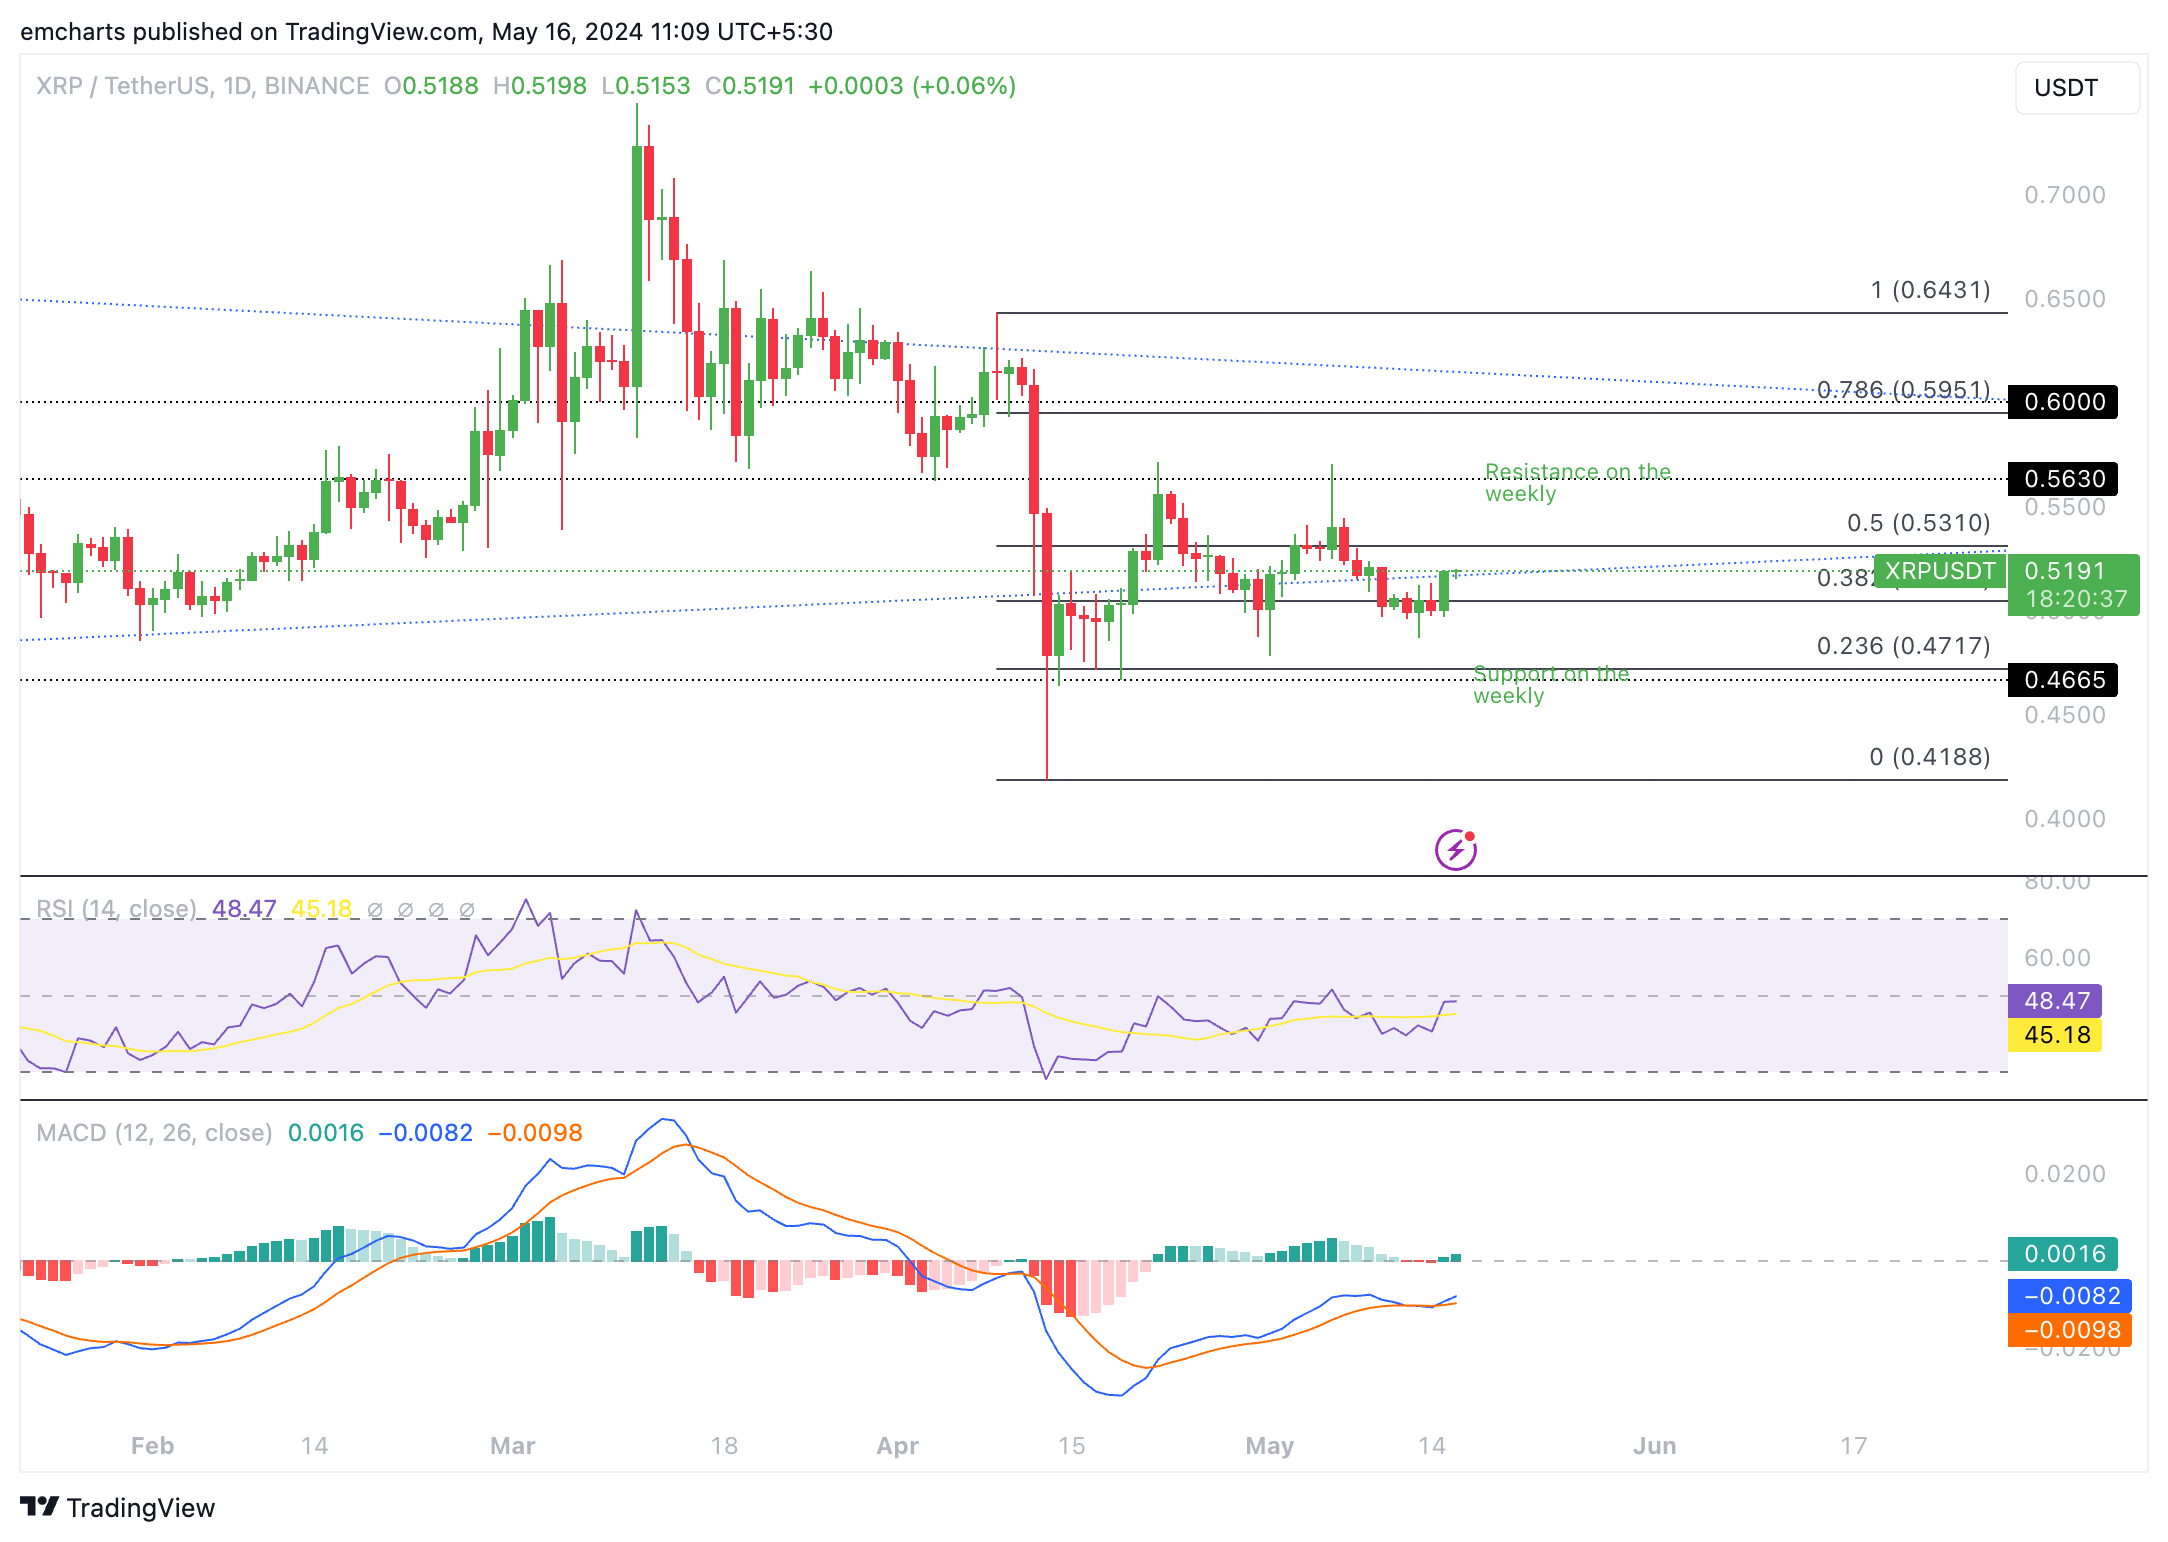
XRP/USDT 1-day chart
If the XRP price fails to break past resistance at $0.53, the altcoin could sweep liquidity at $0.4665, a support level respected on the weekly XRP/USDT chart.
Bitcoin, altcoins, stablecoins FAQs
Bitcoin is the largest cryptocurrency by market capitalization, a virtual currency designed to serve as money. This form of payment cannot be controlled by any one person, group, or entity, which eliminates the need for third-party participation during financial transactions.
Altcoins are any cryptocurrency apart from Bitcoin, but some also regard Ethereum as a non-altcoin because it is from these two cryptocurrencies that forking happens. If this is true, then Litecoin is the first altcoin, forked from the Bitcoin protocol and, therefore, an “improved” version of it.
Stablecoins are cryptocurrencies designed to have a stable price, with their value backed by a reserve of the asset it represents. To achieve this, the value of any one stablecoin is pegged to a commodity or financial instrument, such as the US Dollar (USD), with its supply regulated by an algorithm or demand. The main goal of stablecoins is to provide an on/off-ramp for investors willing to trade and invest in cryptocurrencies. Stablecoins also allow investors to store value since cryptocurrencies, in general, are subject to volatility.
Bitcoin dominance is the ratio of Bitcoin's market capitalization to the total market capitalization of all cryptocurrencies combined. It provides a clear picture of Bitcoin’s interest among investors. A high BTC dominance typically happens before and during a bull run, in which investors resort to investing in relatively stable and high market capitalization cryptocurrency like Bitcoin. A drop in BTC dominance usually means that investors are moving their capital and/or profits to altcoins in a quest for higher returns, which usually triggers an explosion of altcoin rallies.
Recommended Articles


