

Bitcoin Price Forecast: BTC steadies near $78K as ETF inflows persist
- Bitcoin price steadies at $78,000 on Thursday after surging nearly 6% so far this week.
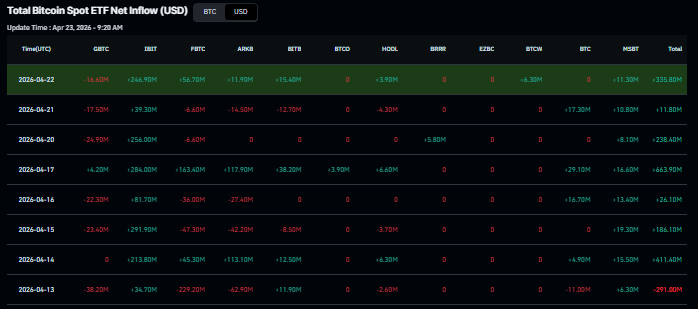
- US-listed spot BTC ETFs recorded inflows of $335 million on Wednesday, marking seven consecutive days of positive flows.
- Uncertainty in the Middle East hinders risk sentiment as BTC nears the overhead resistance at $80K.
Bitcoin (BTC) steadies at $78,000 on Thursday, taking a breather after rallying nearly 6% so far this week, boosted by the strong institutional demand. Despite the positive outlook, traders should be cautious as lingering uncertainty in the Middle East caps the potential for a continuation of the rally at a moment when the largest cryptocurrency nears its overhead supply at $80,000.
Institutional demand lifts BTC
Institutional demand for Bitcoin has continued to support its price rise so far this week. CoinGlass data showed that spot Bitcoin Exchange Traded Funds (ETFs) recorded inflows of $335.80 million on Wednesday, marking seven consecutive days of positive flows since April 13. If these inflows continue and intensify, BTC could see a further rally ahead.
The Middle East conflict still weighs on risk sentiment
Apart from strong institutional demand, the Middle East's continued uncertainty could cap short-term risk sentiment among market participants. Iran fired on three ships in the Strait of Hormuz and escorted two of them to Iranian waters, the Wall Street Journal reported on Wednesday. The attacks came a day after US President Donald Trump extended a ceasefire while maintaining an American blockade of Iranian ports.
These developments dampened short-term risk sentiment, with risk-sensitive assets such as Bitcoin (BTC) pausing their recent price surge.
Is BTC market structure shifting to bullish?
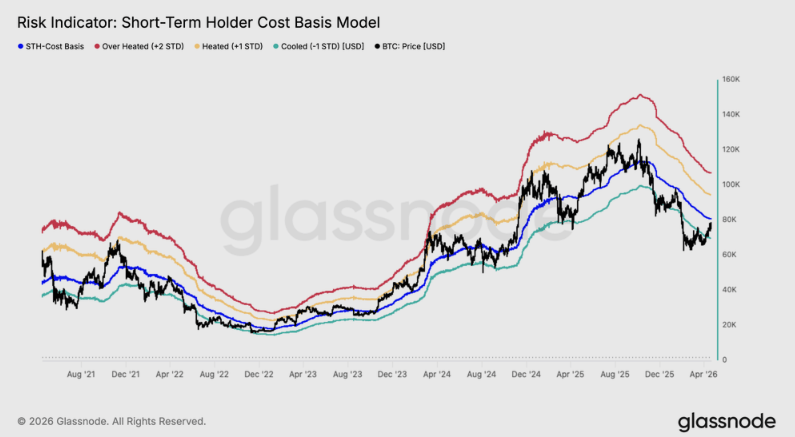
The Glassnode weekly report highlighted that BTC's move back above the True Market Mean marks an important shift in market structure, with price reclaiming a key cost basis level that often defines the boundary between bearish and constructive regimes.
The analyst noted, “This recovery is now being supported by improving spot demand and a tentative return of ETF inflows, suggesting that both retail and institutional participation are beginning to re-engage. At the same time, derivatives positioning paints a more cautious picture.”
“The market appears to be transitioning into a more constructive phase, but one that still requires confirmation. A sustained push through the $80K level would likely depend on continued spot absorption and consistent ETF demand, while failure to hold current levels could see downside moves accelerate given the relatively thin liquidity environment,” Glassnode’s analyst concludes.
Bitcoin Price Forecast: BTC could extend gains if it closes above key resistance zone
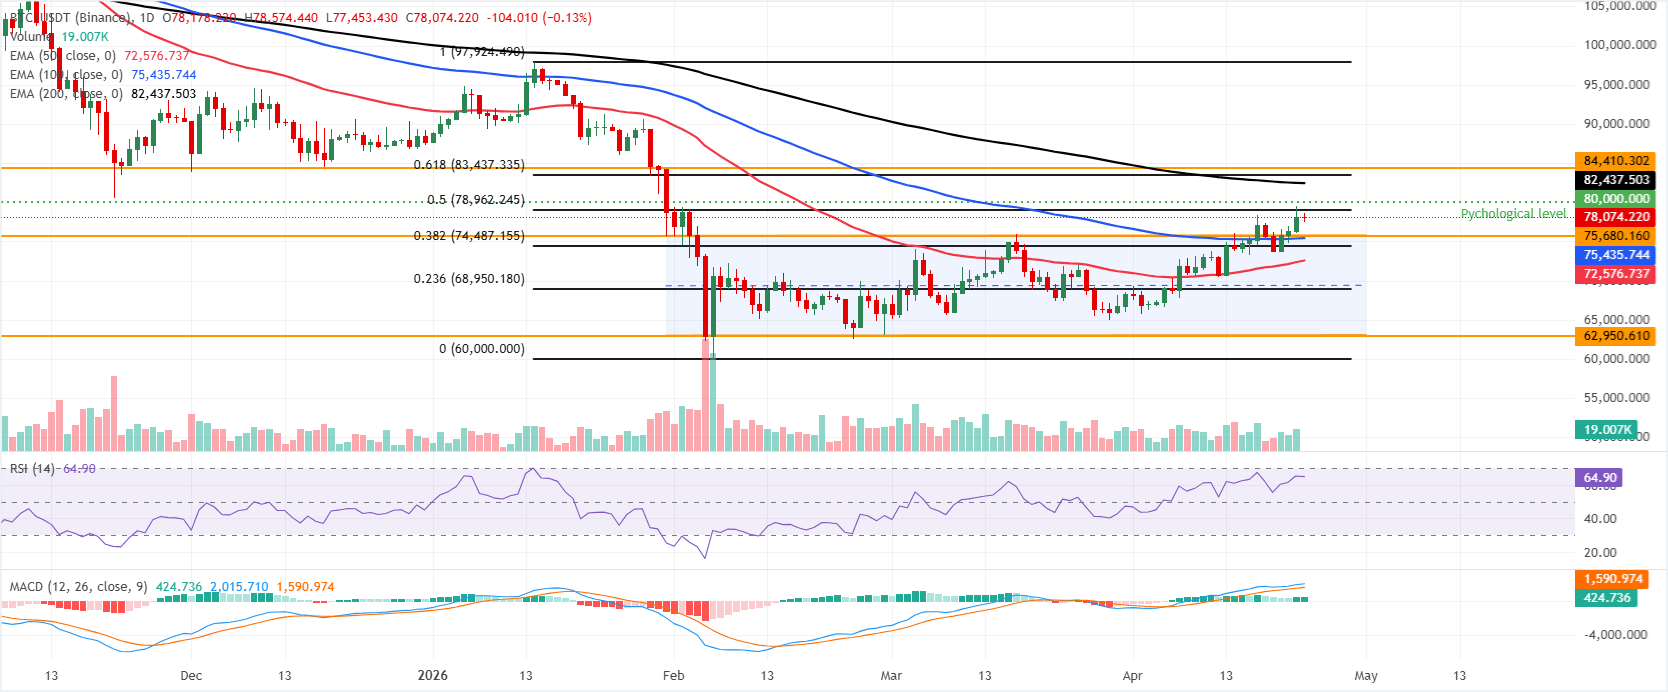
Bitcoin is maintaining a constructive bullish bias as it holds well above the 50-day and 100-day Exponential Moving Averages (EMAs) at $72,576 and $75,435, respectively. Price is also stretching away from the upper boundary of the horizontal parallel channel around $75,680, hinting at persistent upside pressure after the recent breakout.
Momentum supports the topside tone, with the Relative Strength Index (RSI) hovering in bullish territory near 65 and the Moving Average Convergence Divergence (MACD) staying positive, suggesting buyers retain control even as conditions edge toward overbought territory.
On the topside, immediate resistance is located at the 50% retracement (drawn from the January high to the February low) near $78,962, followed by the psychological $80,000 mark. Above that area, the 200-day EMA at $82,437 and the 61.8% Fibonacci retracement around $83,437 form a thicker barrier ahead of horizontal resistance near $84,410.
On the downside, initial support is seen around the prior channel top at $75,680, reinforced by the nearby 100-day EMA at $75,435. A deeper pullback would expose the 38.2% retracement around $74,487, with the 50-day EMA at $72,576 and the 23.6% retracement near $68,950 acting as subsequent layers of demand.
(The technical analysis of this story was written with the help of an AI tool.)
Cryptocurrency prices FAQs
Token launches influence demand and adoption among market participants. Listings on crypto exchanges deepen the liquidity for an asset and add new participants to an asset’s network. This is typically bullish for a digital asset.
A hack is an event in which an attacker captures a large volume of the asset from a DeFi bridge or hot wallet of an exchange or any other crypto platform via exploits, bugs or other methods. The exploiter then transfers these tokens out of the exchange platforms to ultimately sell or swap the assets for other cryptocurrencies or stablecoins. Such events often involve an en masse panic triggering a sell-off in the affected assets.
Macroeconomic events like the US Federal Reserve’s decision on interest rates influence crypto assets mainly through the direct impact they have on the US Dollar. An increase in interest rate typically negatively influences Bitcoin and altcoin prices, and vice versa. If the US Dollar index declines, risk assets and associated leverage for trading gets cheaper, in turn driving crypto prices higher.
Halvings are typically considered bullish events as they slash the block reward in half for miners, constricting the supply of the asset. At consistent demand if the supply reduces, the asset’s price climbs.
Recommended Articles


