

Ethereum (ETH) Price Faces a Critical Ceiling Ahead of the $3,000 Dream
Ethereum (ETH) price reclaimed a key technical level near $2,110, repeating a setup that triggered a 20% rally earlier this month.
However, two on-chain signals suggest this breakout attempt faces stiffer resistance than the last one. The difference between March 9 (previous reclaim) and today comes down to who still wants to sell and how much room exists before holders start taking profits.
Red Volume Bars Flash a Warning After SMA Reclaim
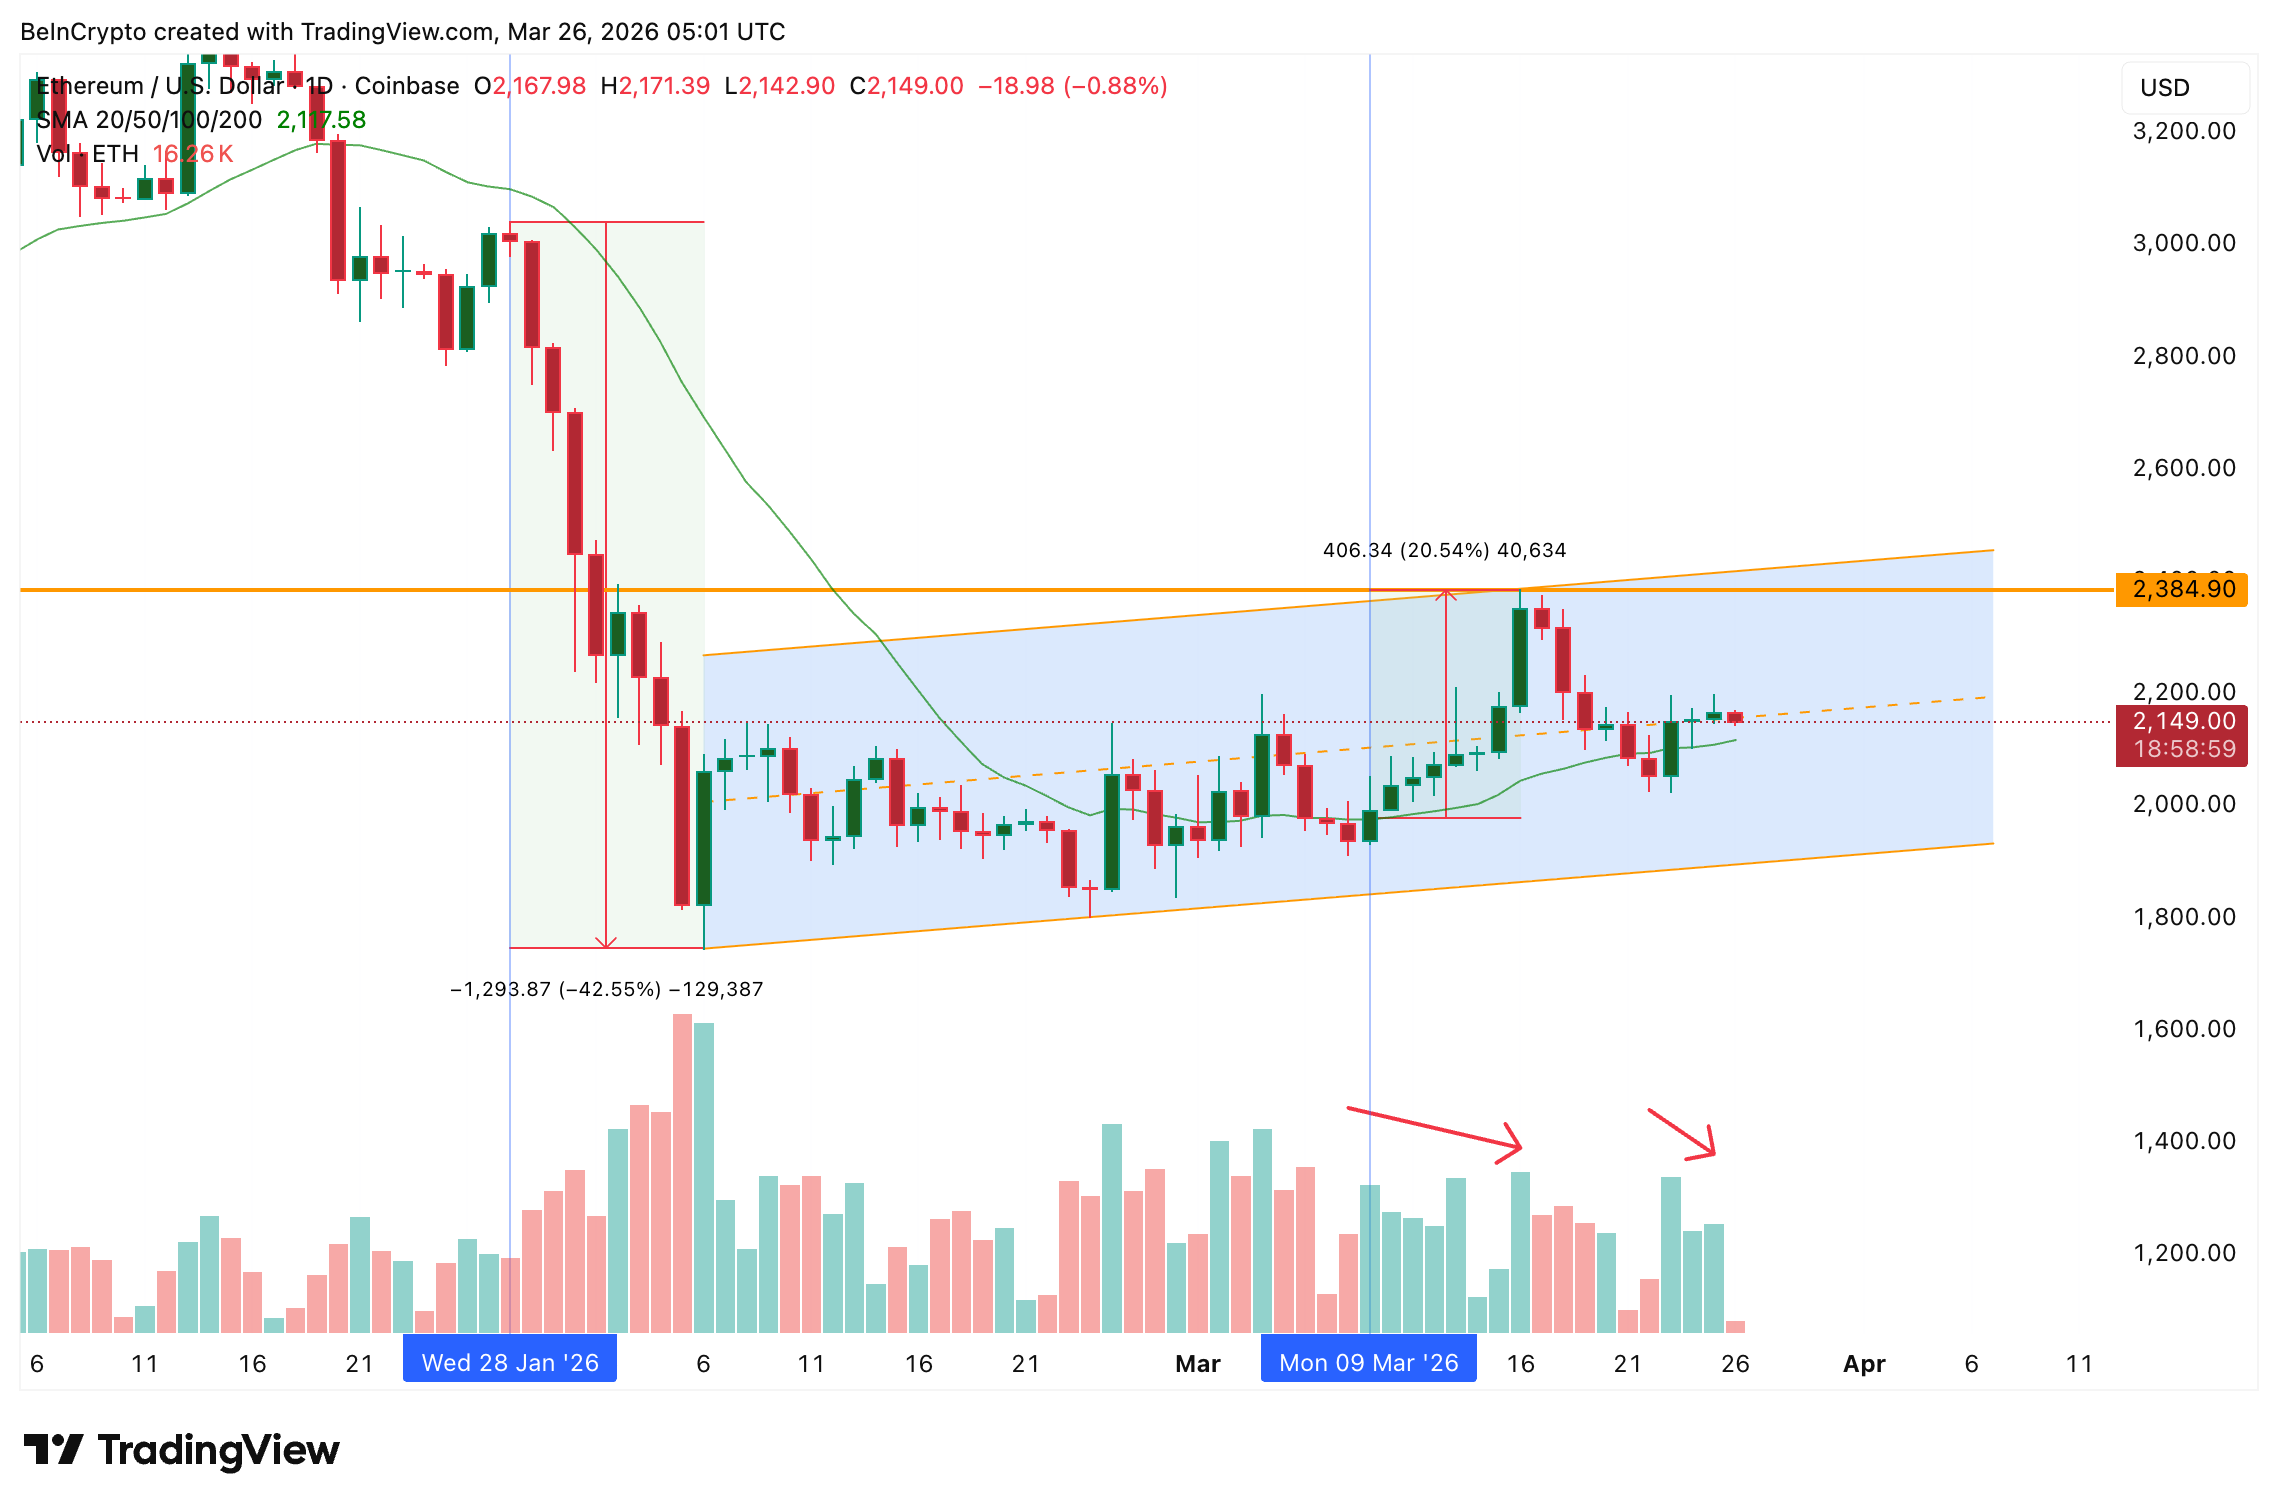
ETH has been trading inside an ascending parallel channel on the daily chart since Feb. 6, a pattern that formed after a 43% drop from the Jan. 28 swing high. The channel itself is not automatically bullish. Ascending channels that follow steep sell-offs often act as continuation patterns rather than reversal structures, so ETH needs to break above the upper trendline (or the most critical swing high) to confirm a real shift in trend.
The 20-day Simple Moving Average (SMA), a trend indicator that averages the last 20 daily closing prices, was reclaimed on March 9 and produced a rally of roughly 20% by March 16. That move was accompanied by consecutive green volume bars, indicating buyers controlled the tape throughout the higher leg.
 Daily Ascending Channel: TradingView
Want more token insights like this? Sign up for Editor Harsh Notariya’s Daily Crypto Newsletter here.
This time, the setup looks different. The current reclaim started with decent volume, but red volume bars have already appeared on the March 26 candle. Red volume bars indicate that selling pressure is entering the market during the rally, a signal that was absent during the March 9 breakout.
The day’s candle is still forming, so a late reversal in buying interest could change this picture. If green volume returns and sustains, the SMA reclaim could still develop into a larger move.
Yet volume alone does not explain why the ceiling may be lower this time. The answer lies in on-chain profitability data.
NUPL Shows Sellers Have Less Reason to Hold
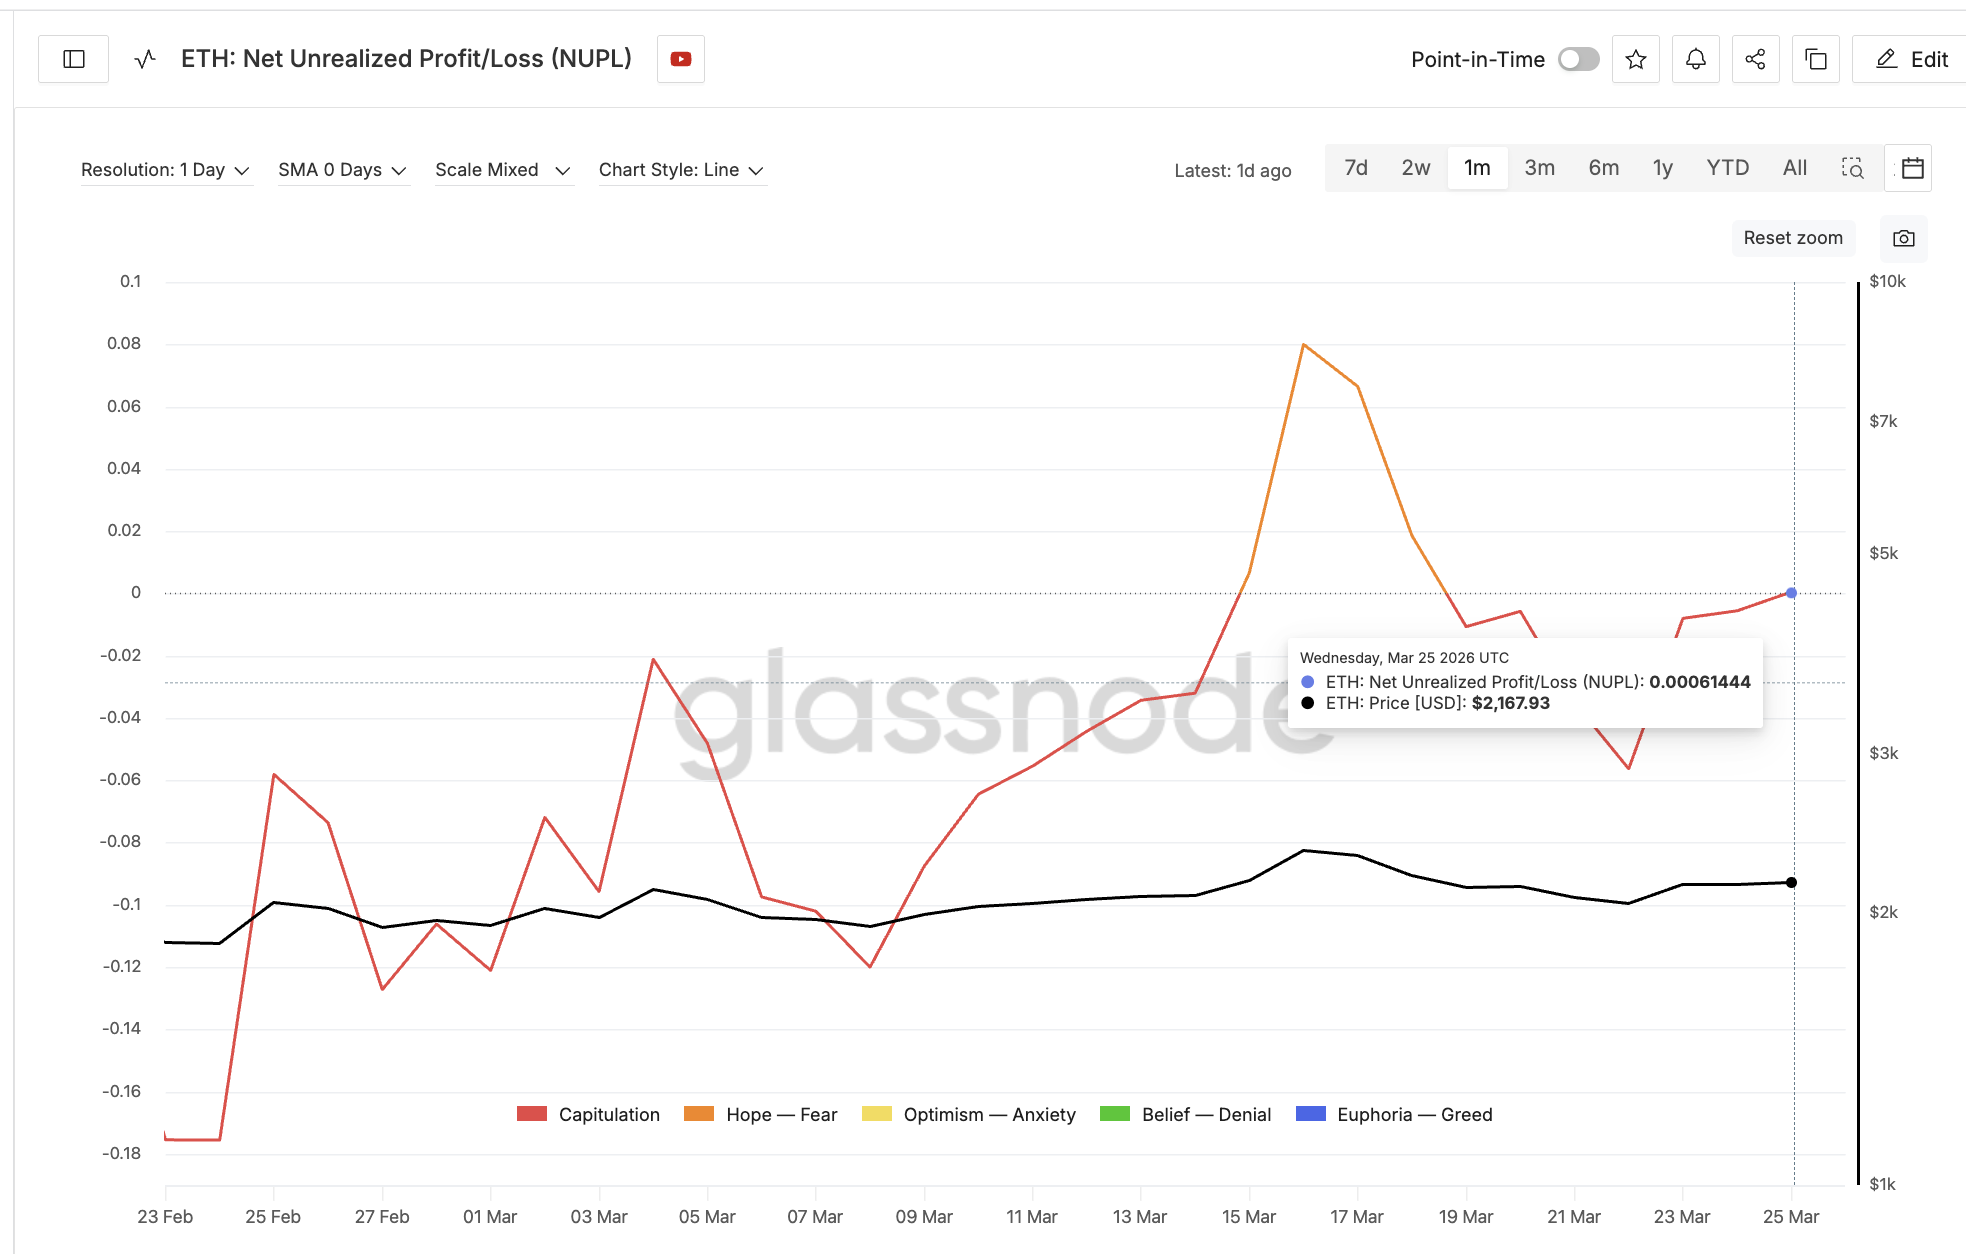
Net unrealized profit/loss (NUPL), an indicator of aggregate holder profitability across all Ethereum addresses, sat at roughly -0.11 on March 8, deep inside the capitulation zone. At that level, most holders were underwater, and there was little incentive to sell. That absence of sell-side pressure allowed the 20-day SMA reclaim to run uninterrupted to $2,380.
The current NUPL reading tells a different story. As of March 25, NUPL sits at 0.00061, which is barely positive. While that number appears small, it represents a meaningful shift from the -0.11 reading that preceded the last rally. On March 22 (before the current reclaim), NUPL was at -0.05, already well above the capitulation low.
The implication is straightforward. Holders who were deeply underwater in early March are now closer to breakeven. Some have already recovered enough to consider selling, not to book profits but to minimize losses. If ETH traders sense that momentum is fading, this breakeven zone could become a distribution point, with supply overwhelming demand.
 ETH NUPL and Price: Glassnode
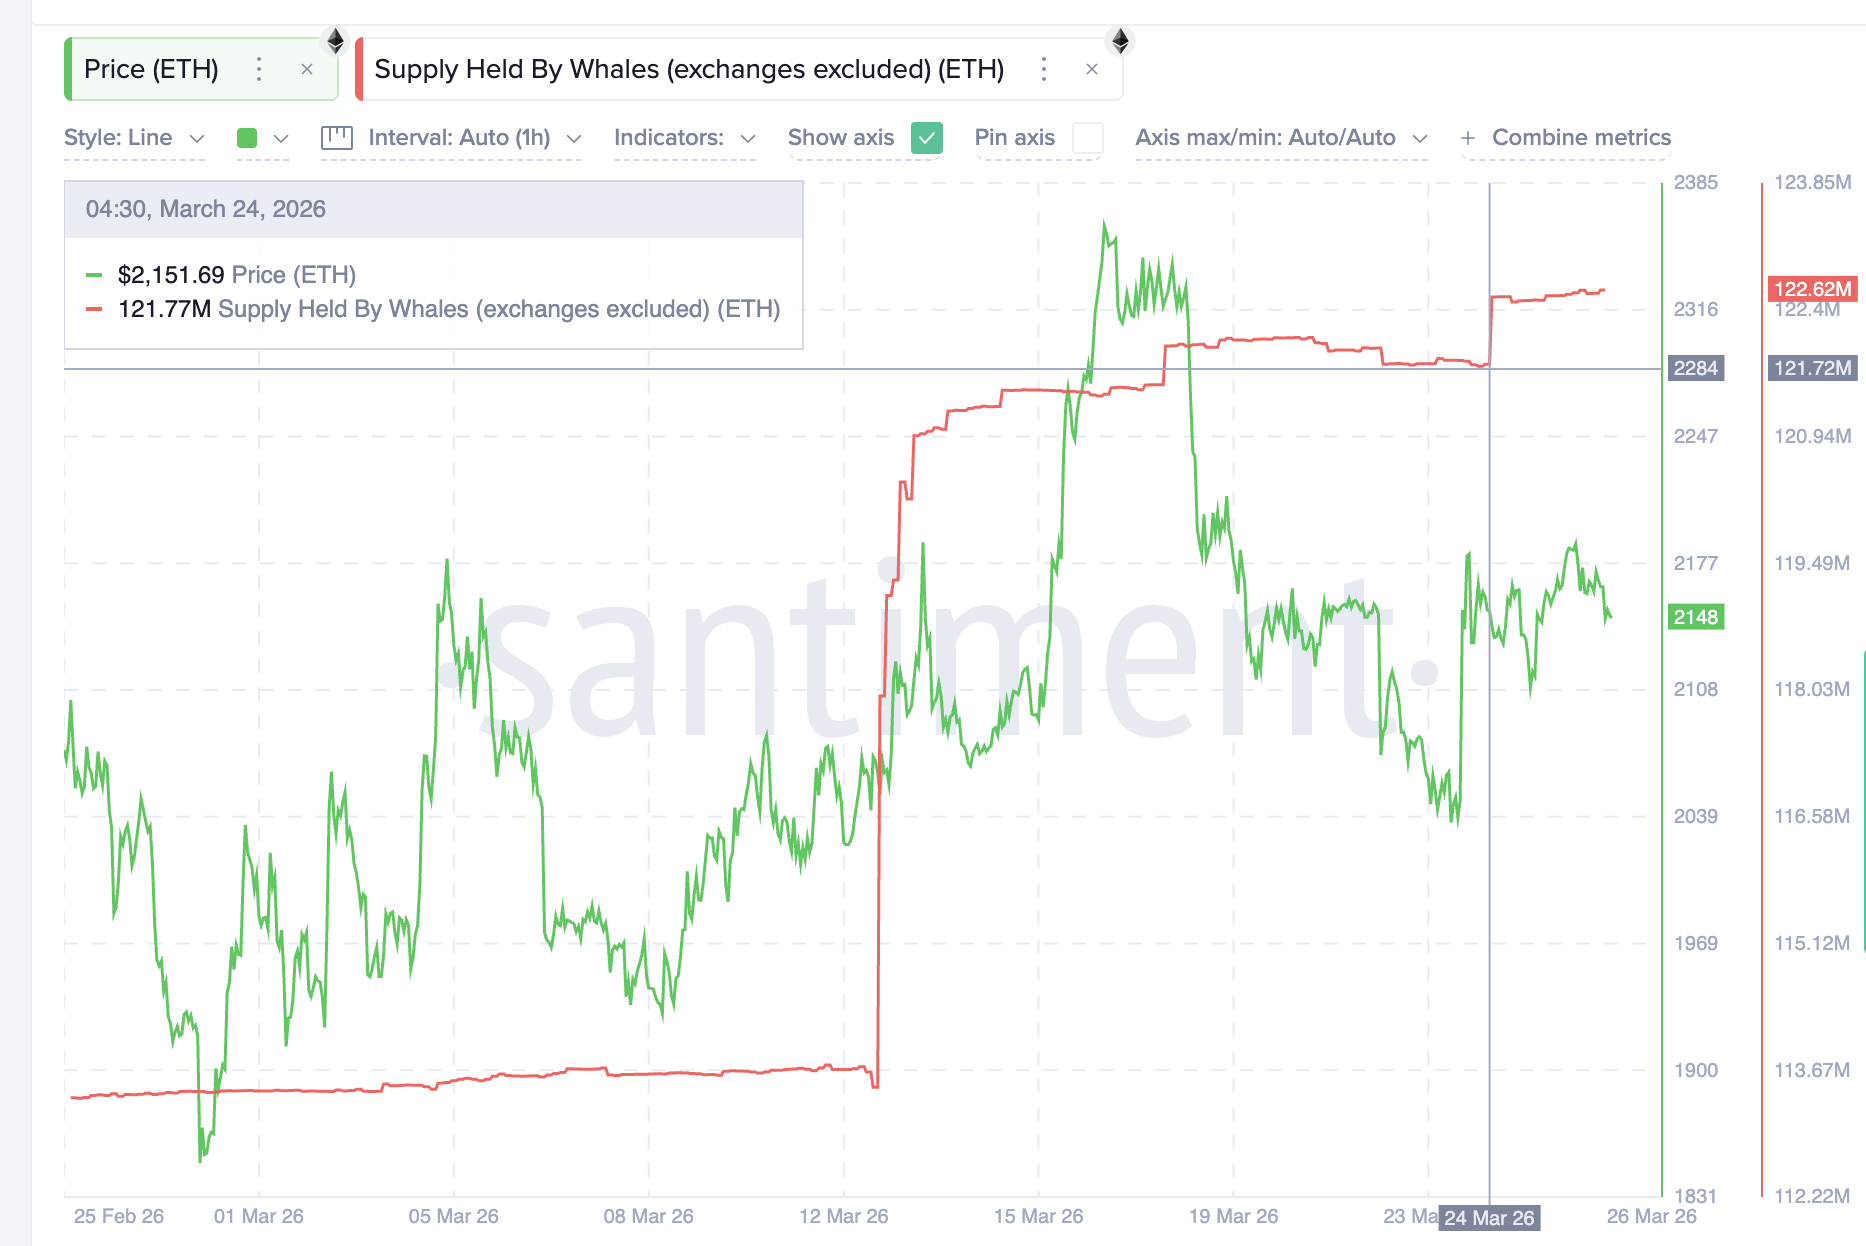
However, one cohort is not selling. Ethereum whales, defined as large non-exchange wallets, increased their collective holdings from 121.72 million ETH to 122.62 million ETH between March 24 and March 26, according to Santiment data. That increase of roughly 900,000 ETH, worth approximately $1.94 billion at current prices, signals conviction from the largest holders.
 ETH Whale Supply: Santiment
However, the whale accumulation currently isn’t as aggressive as it was in early March. That aggressiveness was one of the reasons why the previous Ethereum price rally moved 20% even as the NUPL surged. This time, the NUPL is already high, but whales are not adding massive ETH stashes. What if they are waiting for a price confirmation?
Ethereum Price Levels Hinge on the Realized Price Barrier
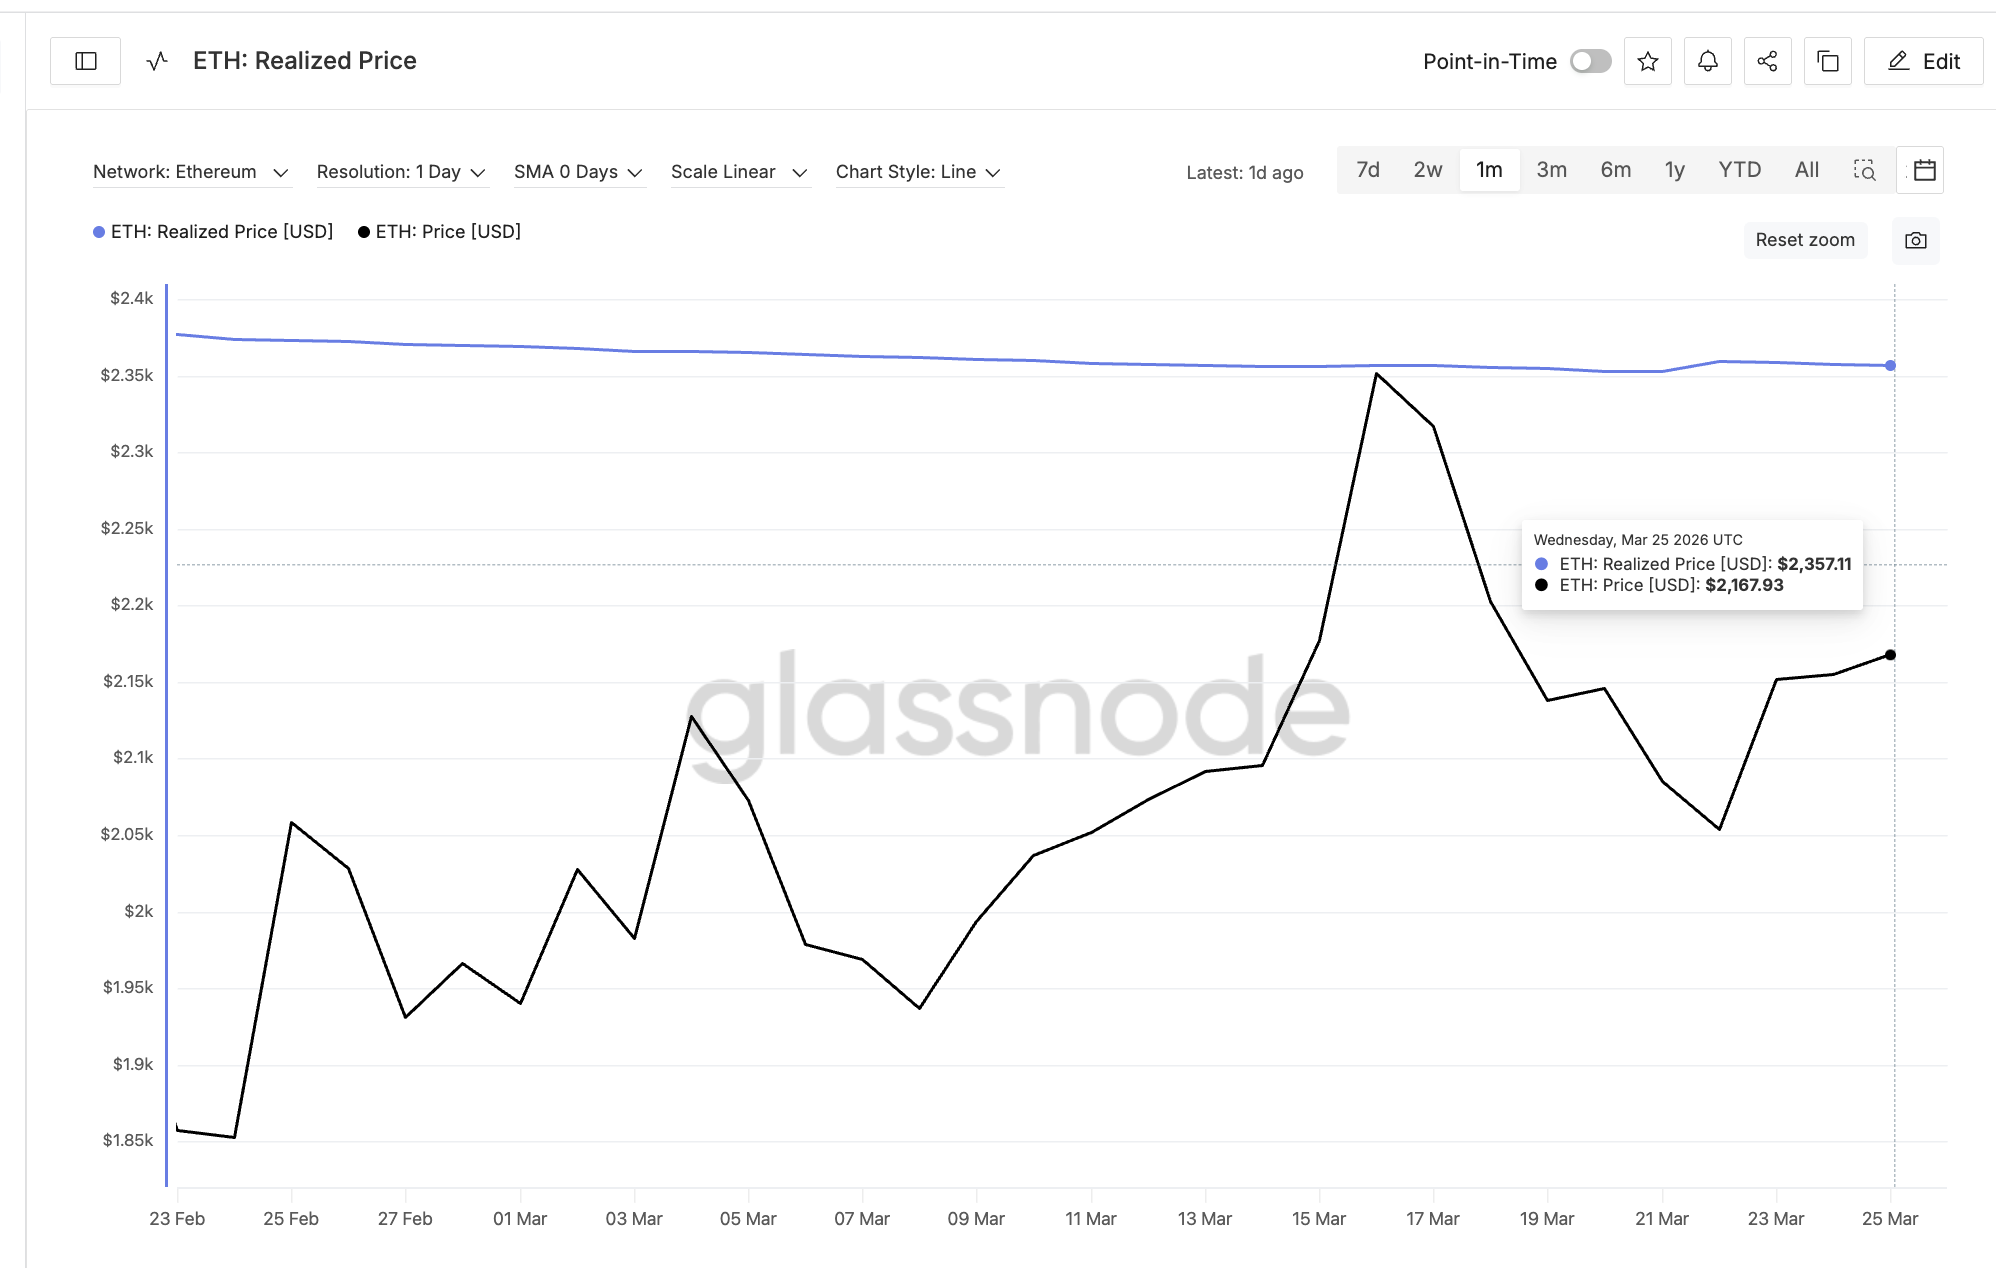
The Ethereum price prediction for the current leg depends on whether ETH can close above the confluence zone between $2,330 and $2,410, two key technical levels. ETH realized price, which represents the average cost basis of all coins on the network, sits above $2,350 according to Glassnode data, right between the confluence zone. The realized price band often acts as a key support/resistance during volatile markets.
 Realized Price Band: Glassnode
This cluster matters because a daily close above $2,410 would accomplish three things at once. It would push ETH above the realized price, meaning the average holder feels more convinced. It would clear the 0.618 Fibonacci resistance, confirming the ascending channel breakout. And it would surpass the $2,380 swing high that capped the March rally.
If that happens, the next Ethereum resistance levels sit at $2,520, $2,650, and the 1.618 extension at $3,050. Therefore, theoretically, the $3,000 dream for ETH is still on.
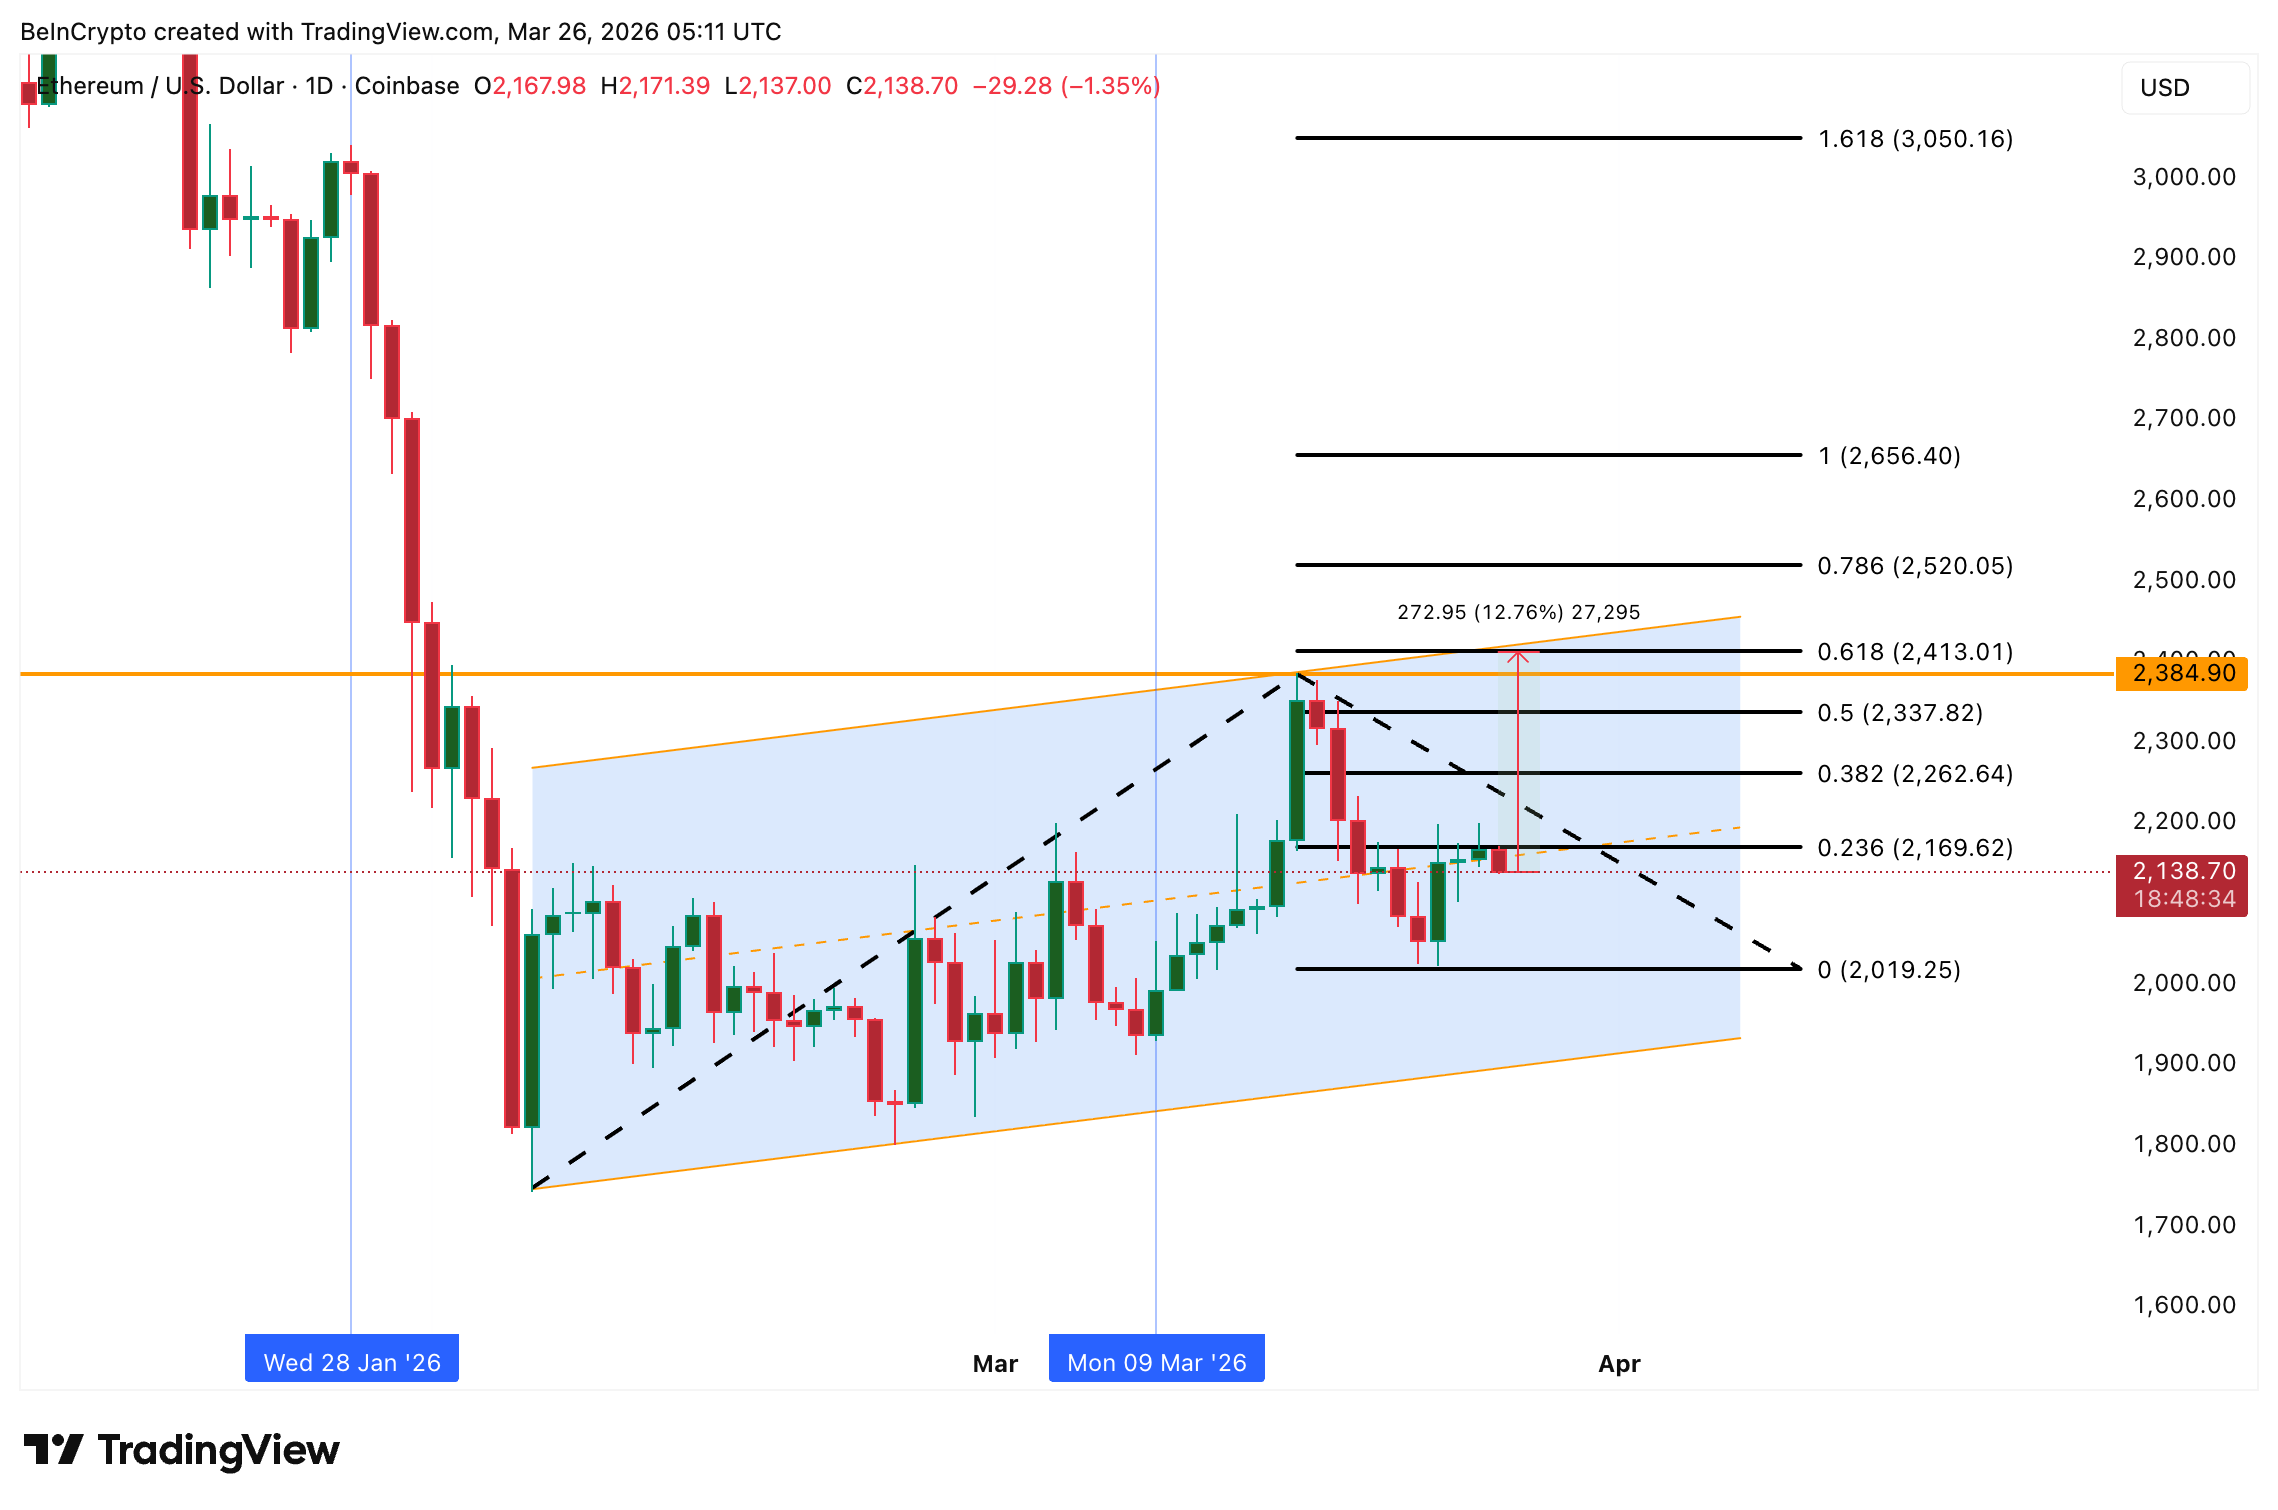 Ethereum Price Analysis: TradingView
On the downside, the first level to hold is $2,160. A daily close below this level would signal that buyers from the SMA reclaim are stepping away. Below that, the $2,010 floor exists, and a break there reopens sub-$2,000 risk.
Therefore, a daily close above $2,410 separates a whale-backed rally toward $3,000 from a fade back to the channel floor.
Recommended Articles


