

Pump.Fun Price Outlook For the End of March 2026
Pump.fun (PUMP) experienced a highly volatile month in March, as the altcoin dropped nearly 17% since March 18. This was mostly due to a large-scale sell-off.
Long-term holders have not taken a single day off from selling since late February, and volume-weighted momentum is now turning lower from a recent peak.
PUMP’s Biggest Holders Trigger Concern
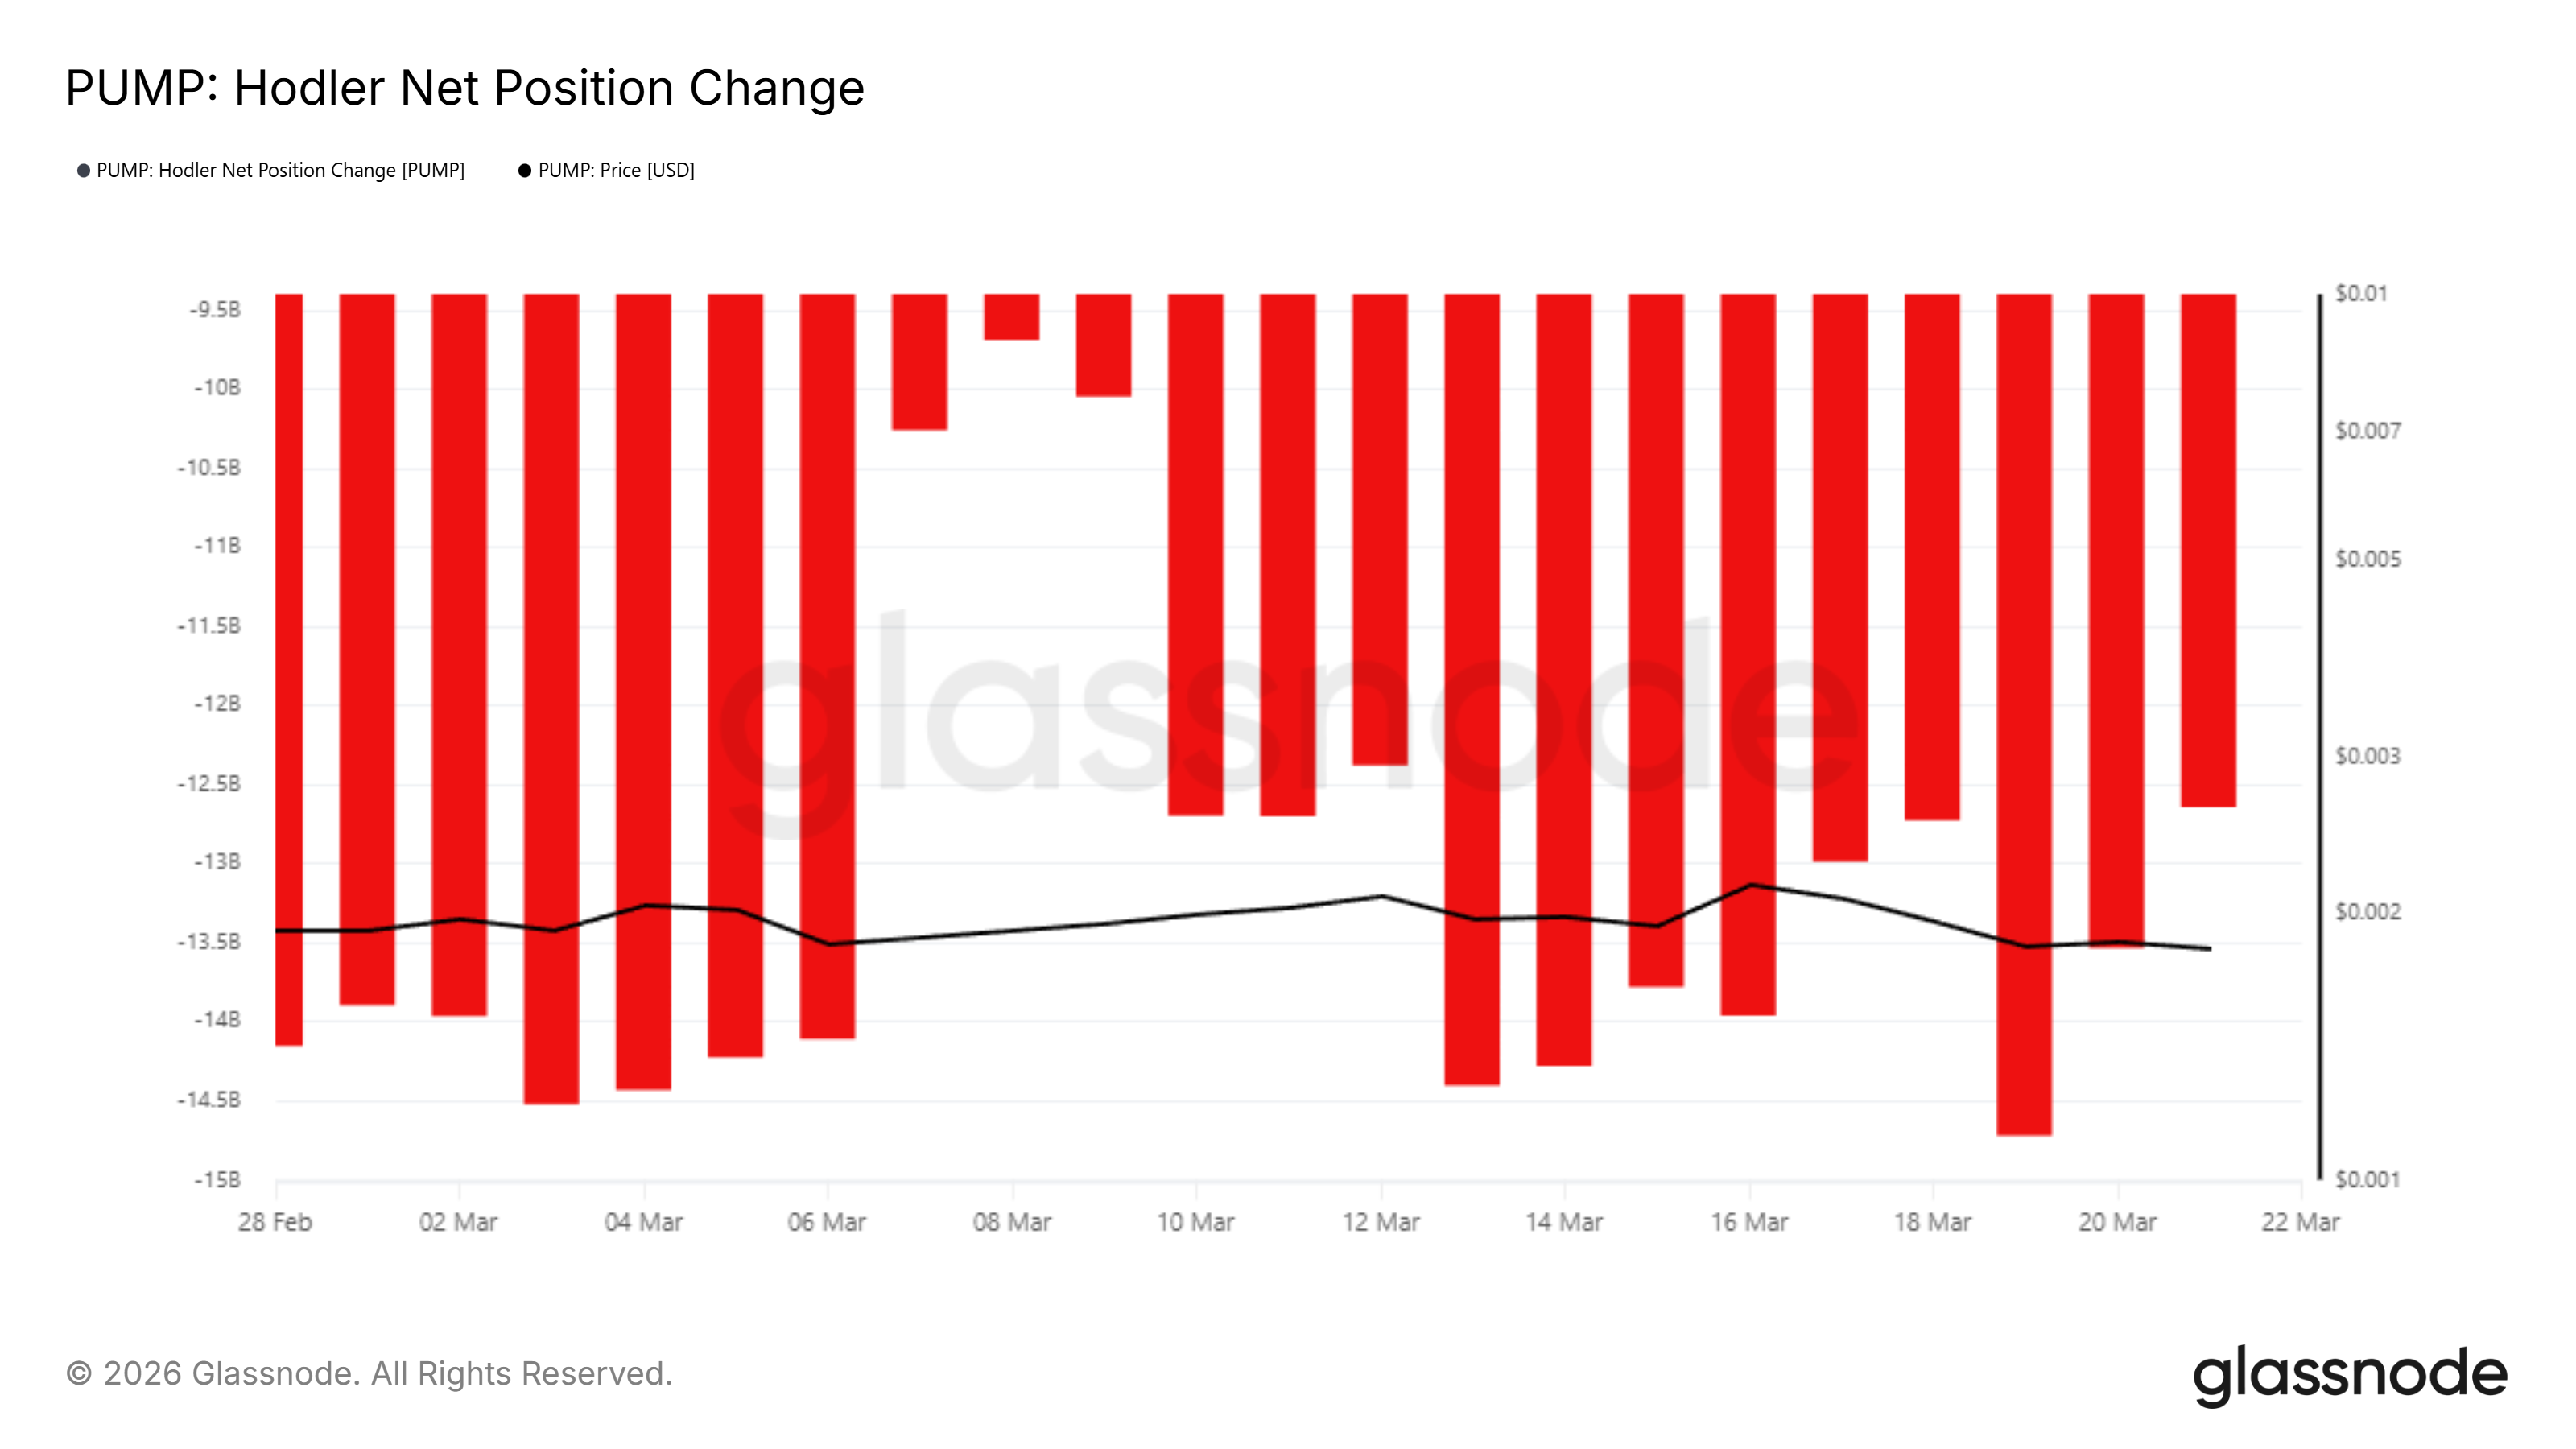
Hodler Net Position Change data from Glassnode shows uninterrupted red bars across every trading day from February 28 through March 22. There is no green bar in the entire chart — not one day of net accumulation by long-term PUMP holders.
Daily net outflows from this cohort range between 9.5 billion and 14.8 billion PUMP. The steepest selling occurred around March 18–19, when outflows spiked to approximately -14.8 billion tokens in a single day.
Want more token insights like this? Sign up for Editor Harsh Notariya’s Daily Crypto Newsletter here.
 XRP HODLer Net Position Change. Source: Glassnode
This sustained pattern confirms that holders who accumulated at higher prices are systematically distributing into every recovery attempt. The March 14 token unlock of $19.07 million in PUMP added fresh supply, likely accelerating distribution.
PUMP Buying Pressure Fails To Sustain
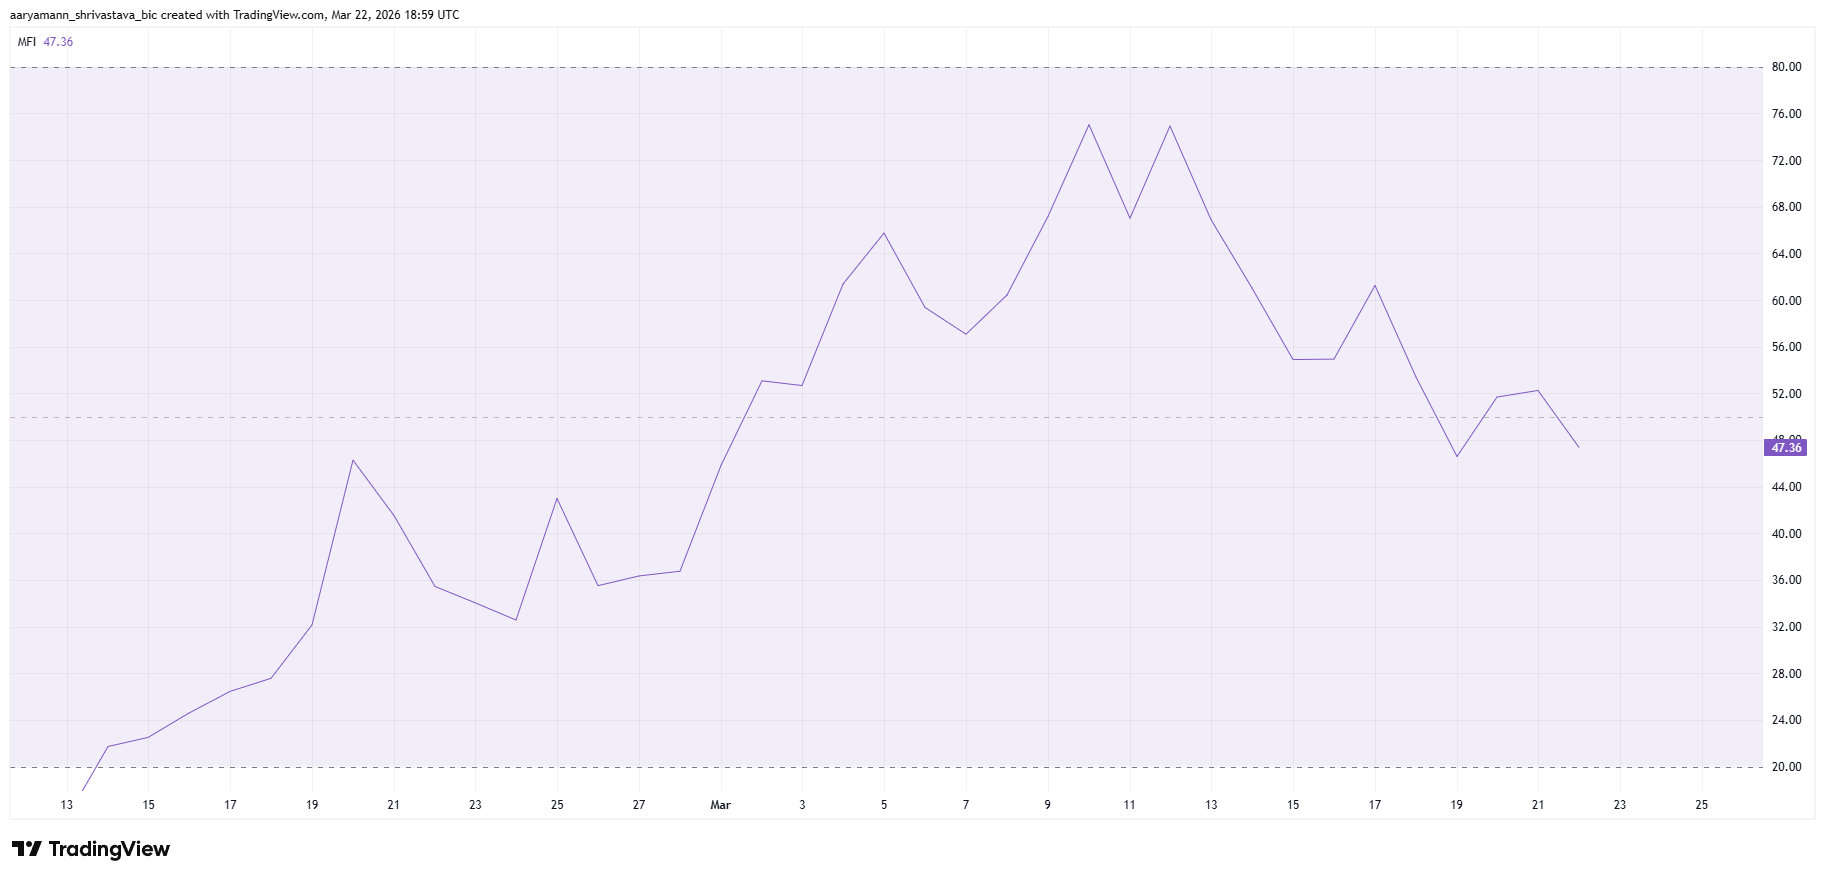
Despite the relentless holder selling, the Money Flow Index (MFI) had recovered meaningfully through early March. Starting from approximately 23 in mid-February, the indicator climbed to a peak near 76 around March 10–11 — touching the overbought threshold.
That reading has since reversed. The MFI now sits at 47.36, a neutral but declining reading. It made a secondary lower peak near 62 around March 17 before rolling over again.
 PUMP MFI. Source: TradingView
The pattern of lower highs on the MFI, while the price also makes lower highs, is a classic sign of weakening demand. A drop below 40 would tip the indicator into outflow-dominant territory and remove the last buffer against further selling.
PUMP Price’s Floor To Watch
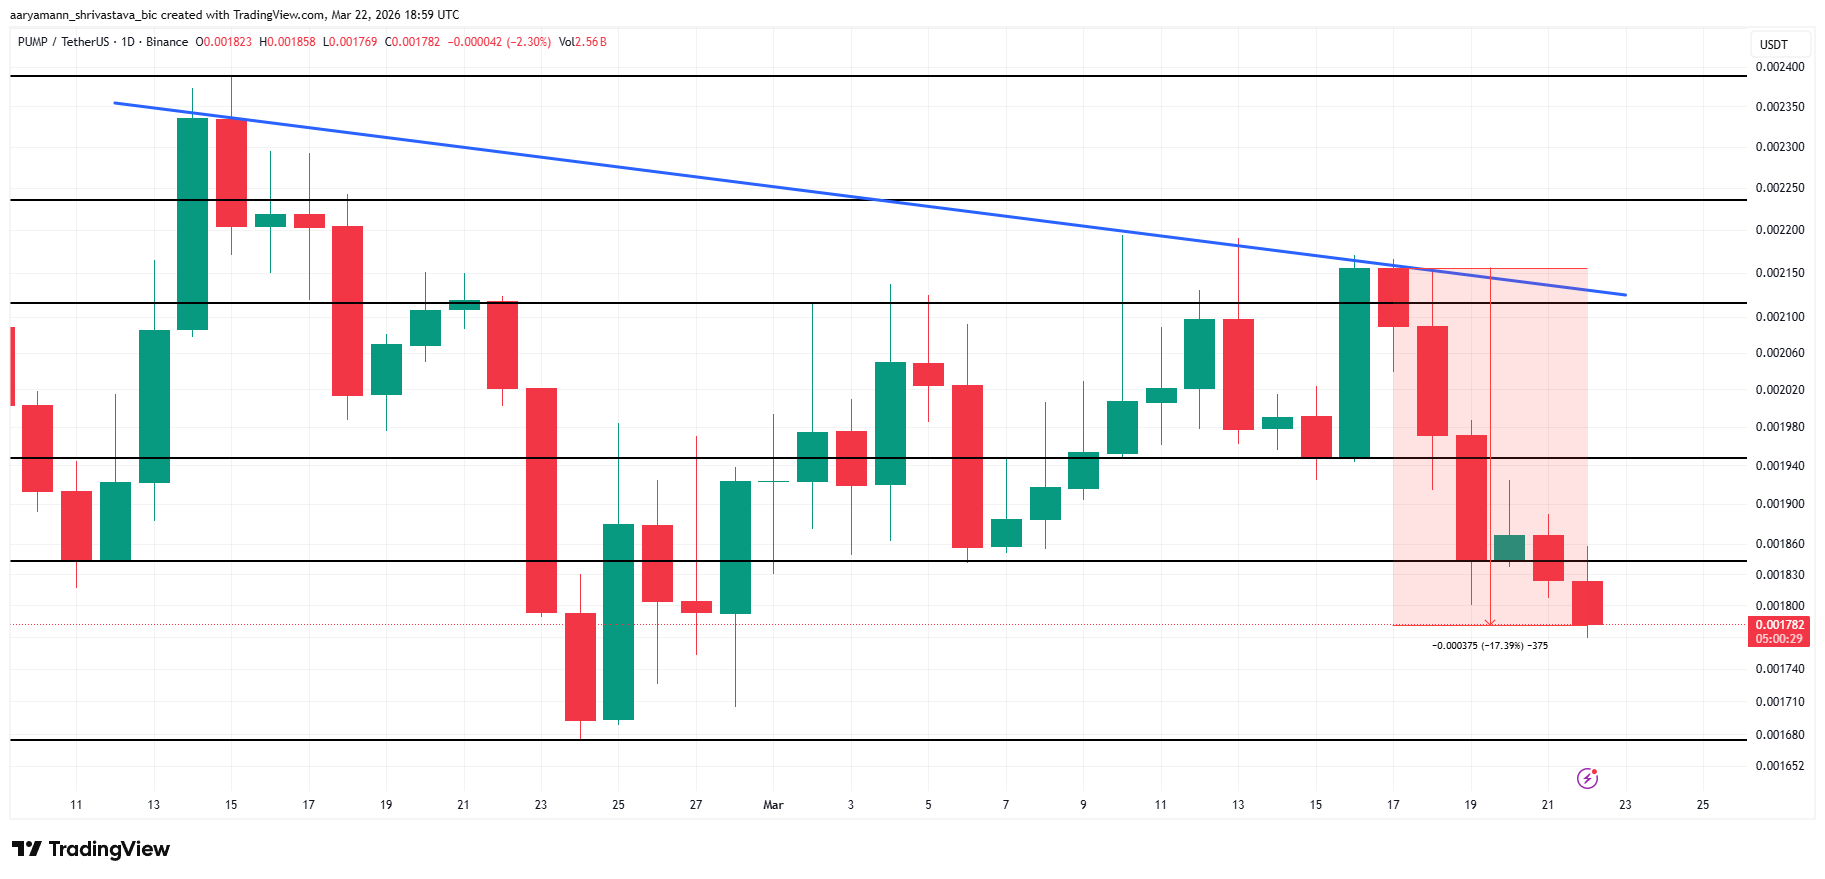
The daily chart shows PUMP has been trading beneath a descending trendline since February 13. Every rally attempt has been capped at or near that falling resistance, which now sits around $0.002140. The March 17–22 distribution zone between $0.001860 and $0.002160 marks where the most recent sellers were active.
The annotated measured move of -17.39% has already reached its $0.001782 target.
A sustained break below the current dotted support near $0.001780 would expose the next meaningful floor at the February 24–25 lows near $0.001690 — roughly a further 5.7% lower.
 PUMP Price Analysis. Source: TradingView
To shift the structure bullish, PUMP would need to break and close above the descending trendline near $0.002140.
Given that pump.Fun’s daily platform revenue has fallen sharply from its January 2025 highs; the fundamental backdrop does not currently support a sustained recovery. The all-clear for buyers comes only if the trendline breaks with volume.
Recommended Articles


