

Arbitrum Price Could Hit an All-Time Low Before March Ends
Arbitrum (ARB) is trading at $0.0929, down 3.53% on the day, sitting less than half a percent above its all-time low of $0.0883.
Sellers have reasserted control following a failed recovery attempt in mid-March, and two separate indicators now point in the same direction.
Arbitrum Holders are Selling at a Loss
Network Realized Profit/Loss data from Santiment shows ARB holders have been selling at a loss throughout February and March. The deepest loss event occurred around February 22, when the metric spiked sharply negative.
A brief recovery pushed the price above $0.11 in mid-March. However, sellers re-emerged immediately. The network is back to realizing losses, with the most recent reading near -$619K.
That pattern is significant. Holders who could not exit at a profit during the March recovery are now cutting positions at a loss. This type of sustained loss-taking typically accompanies trend continuation, not reversal.
Want more token insights like this? Sign up for Editor Harsh Notariya’s Daily Crypto Newsletter here.
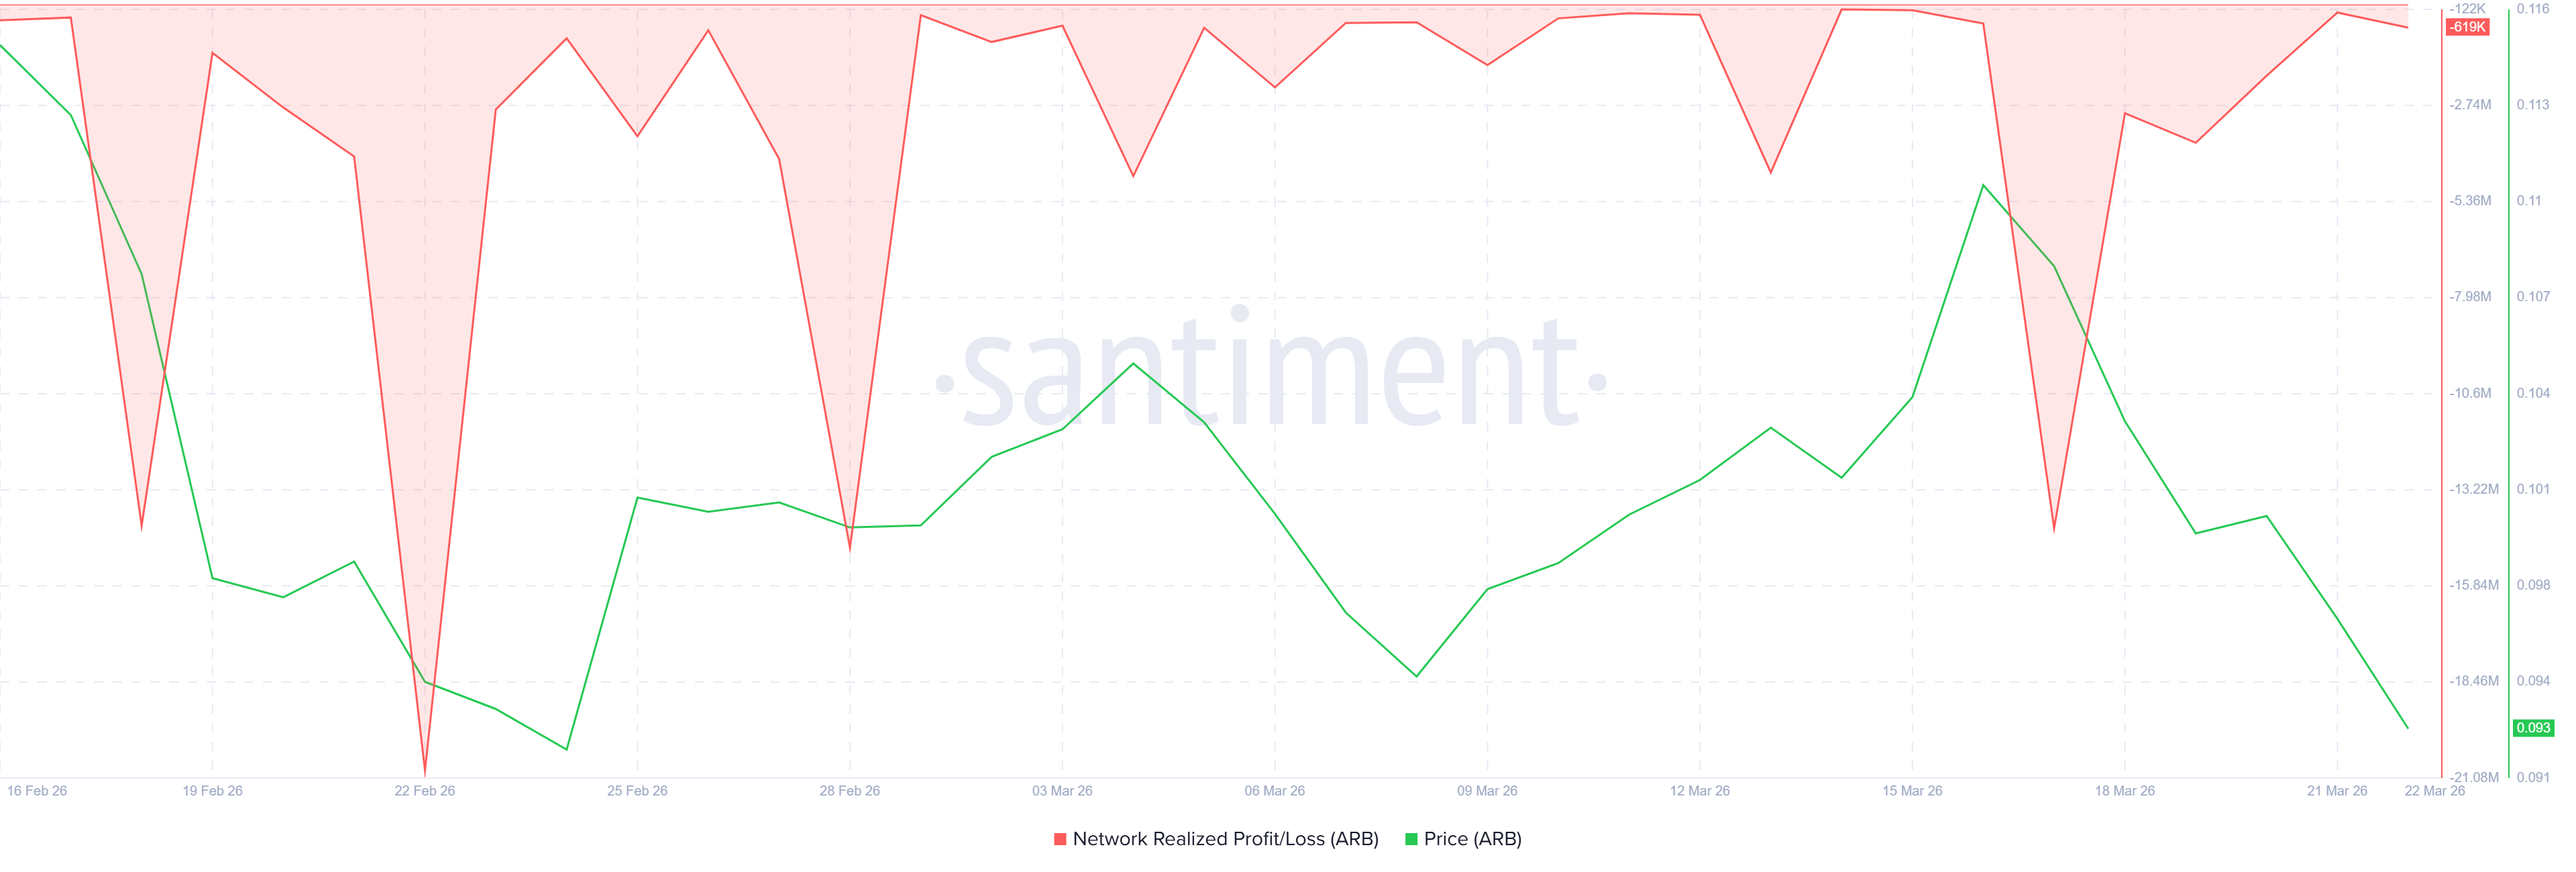 ARB Realized Profit/Loss. Source: Santiment
Despite the bearish on-chain data, the Chaikin Money Flow (CMF) had briefly recovered through most of March. The indicator hovered near zero between February 26 and March 18, suggesting neither meaningful accumulation nor distribution.
That balance has now broken to the downside. The CMF stands at -0.08 as of March 22. That reading matches levels from late February, just before the token’s prior leg lower.
The last time CMF dropped to this level, Arbitrum price was trading between $0.094 and $0.099. It subsequently declined further. A sustained reading below -0.10 would strengthen the case for a move toward the all-time low.
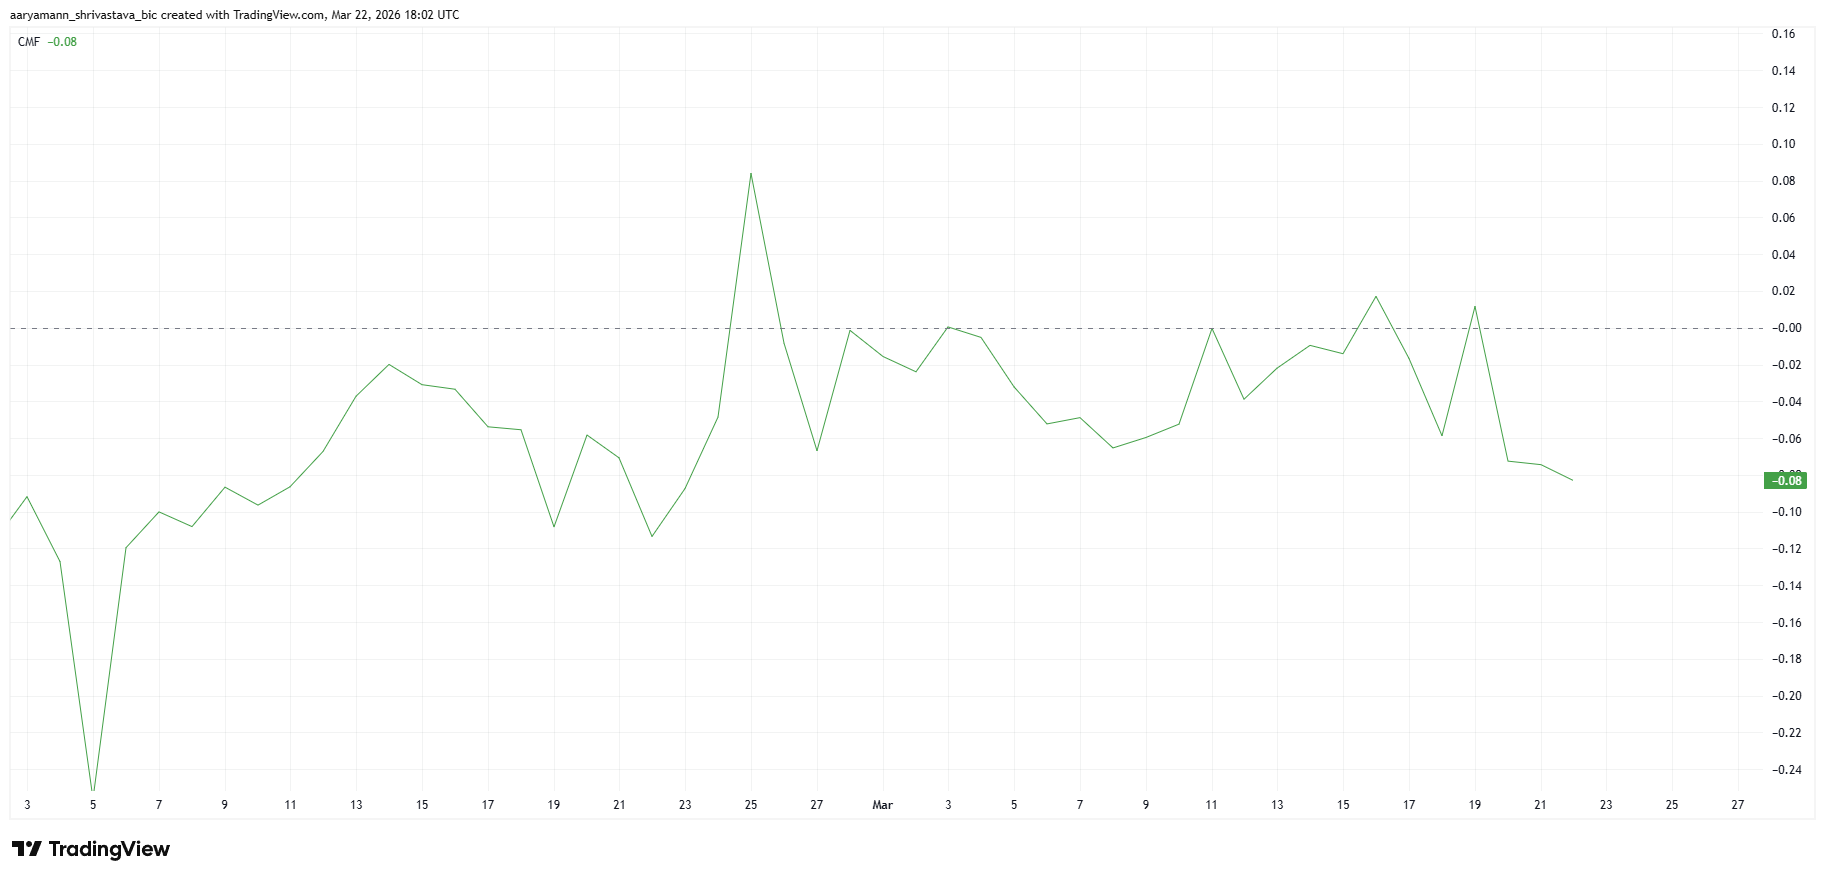 ARB CMF. Source: TradingView
ARB Price To Form History – Again
Arbitrum price shows a drop of 15.76% from the $0.11 distribution zone has already reached its target near $0.0928. Price is now trading right at that level, with only the all-time low at $0.0883 standing below.
A second measured move annotation on the chart projects a further -4.99% decline from the current price, targeting $0.0883 directly. That level coincides with the Fibonacci 1.0 extension at $0.0887 — the range base from which the entire March recovery was measured.
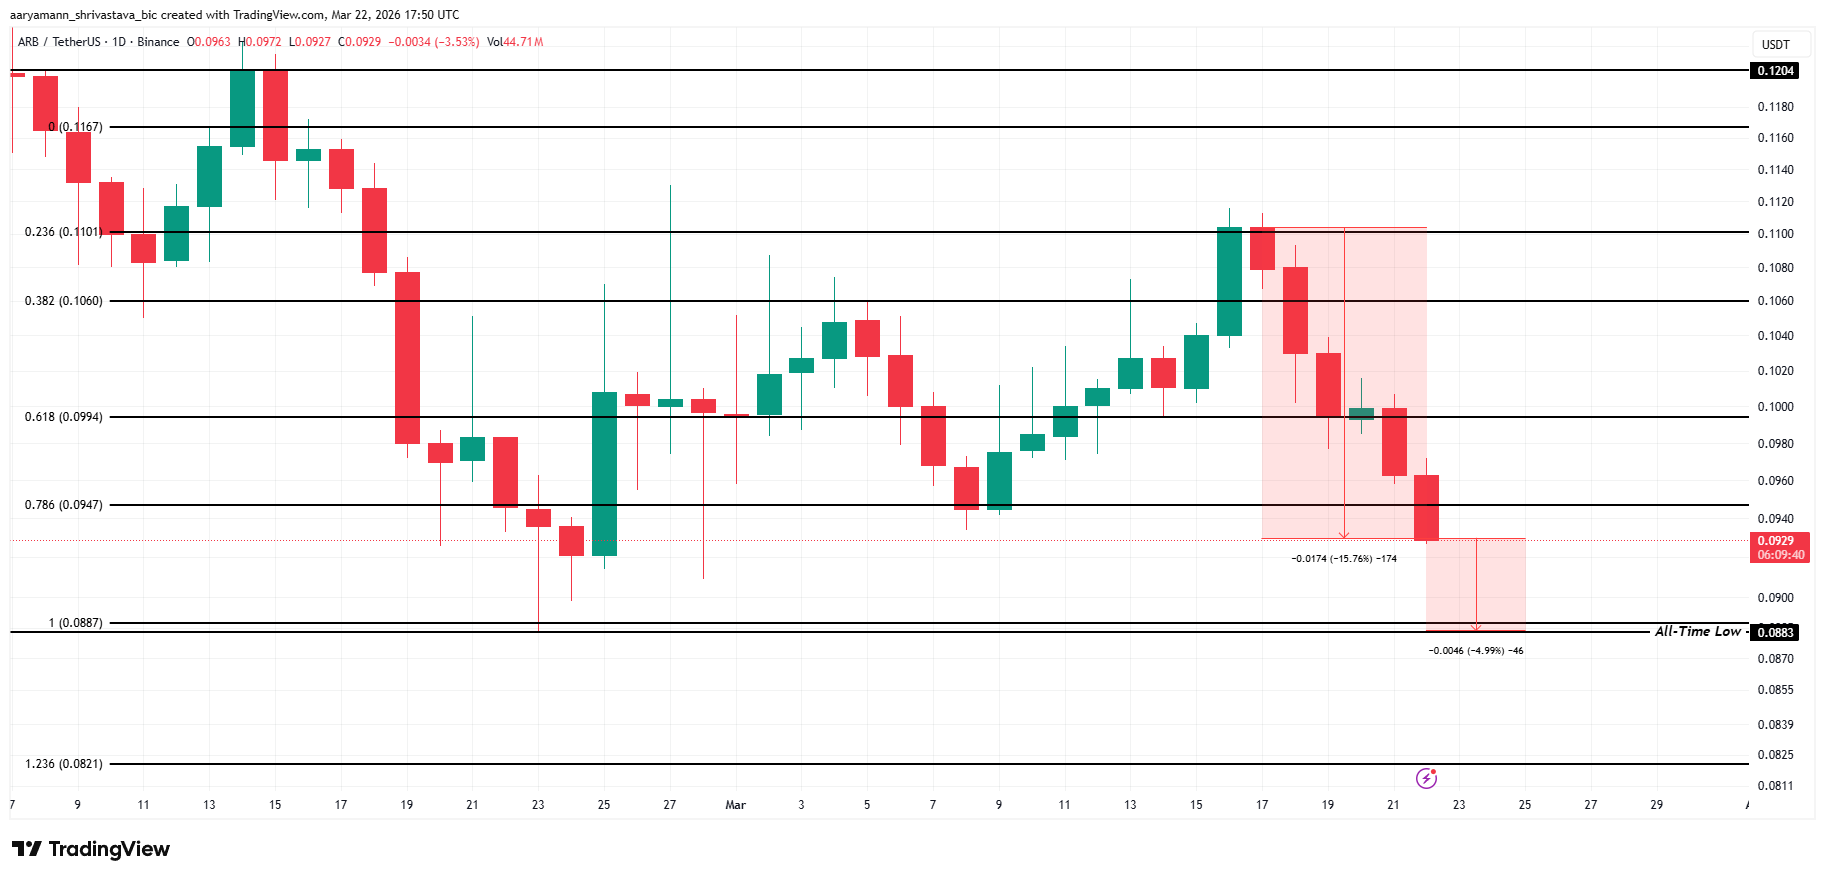 ARB Price Analysis. Source: TradingView
A daily close below $0.0929 would leave no meaningful support before $0.0883. The 0.786 Fibonacci level at $0.0947 has already been breached and is now acting as overhead resistance.
To reverse this structure, ARB would need a daily close back above $0.0994 — the 0.618 Fibonacci level.
The next significant token unlock for Arbitrum is scheduled for April 16, 2026, which will add further supply-side pressure in the near term. Without a broad market catalyst, the all-time low is the most likely near-term destination.
Recommended Articles


