

Dogecoin and Two Other Tokens Spark Meme Coin Season Hopes
Dogecoin price may still hold the clues to whether meme coin season returns. Between February 6 and February 15, Dogecoin rallied about 47%. During the same period, the total meme coin market cap climbed by around 43%. This shows Dogecoin is still moving in step with the broader sector and continues to lead it.
Now, two of the most closely aligned meme coins, BONK and Shiba Inu, are already forming breakout patterns. Their next move may depend on whether Dogecoin confirms its own bullish structure. Together, correlation, holder behavior, and price structure suggest Dogecoin still remains the key signal for the meme coin cycle.
BONK and Shiba Inu Are Already Showing Breakout Structures
BONK and Shiba Inu currently have an extremely high correlation with Dogecoin. Correlation measures how closely assets move together.
A correlation of 1 means they move almost identically. Over the past month, BONK and Dogecoin reached a correlation as high as 0.99. Shiba Inu reached about 0.97 to 0.99 on weekly and monthly timeframes.
Want more token insights like this? Sign up for Editor Harsh Notariya’s Daily Crypto Newsletter here.
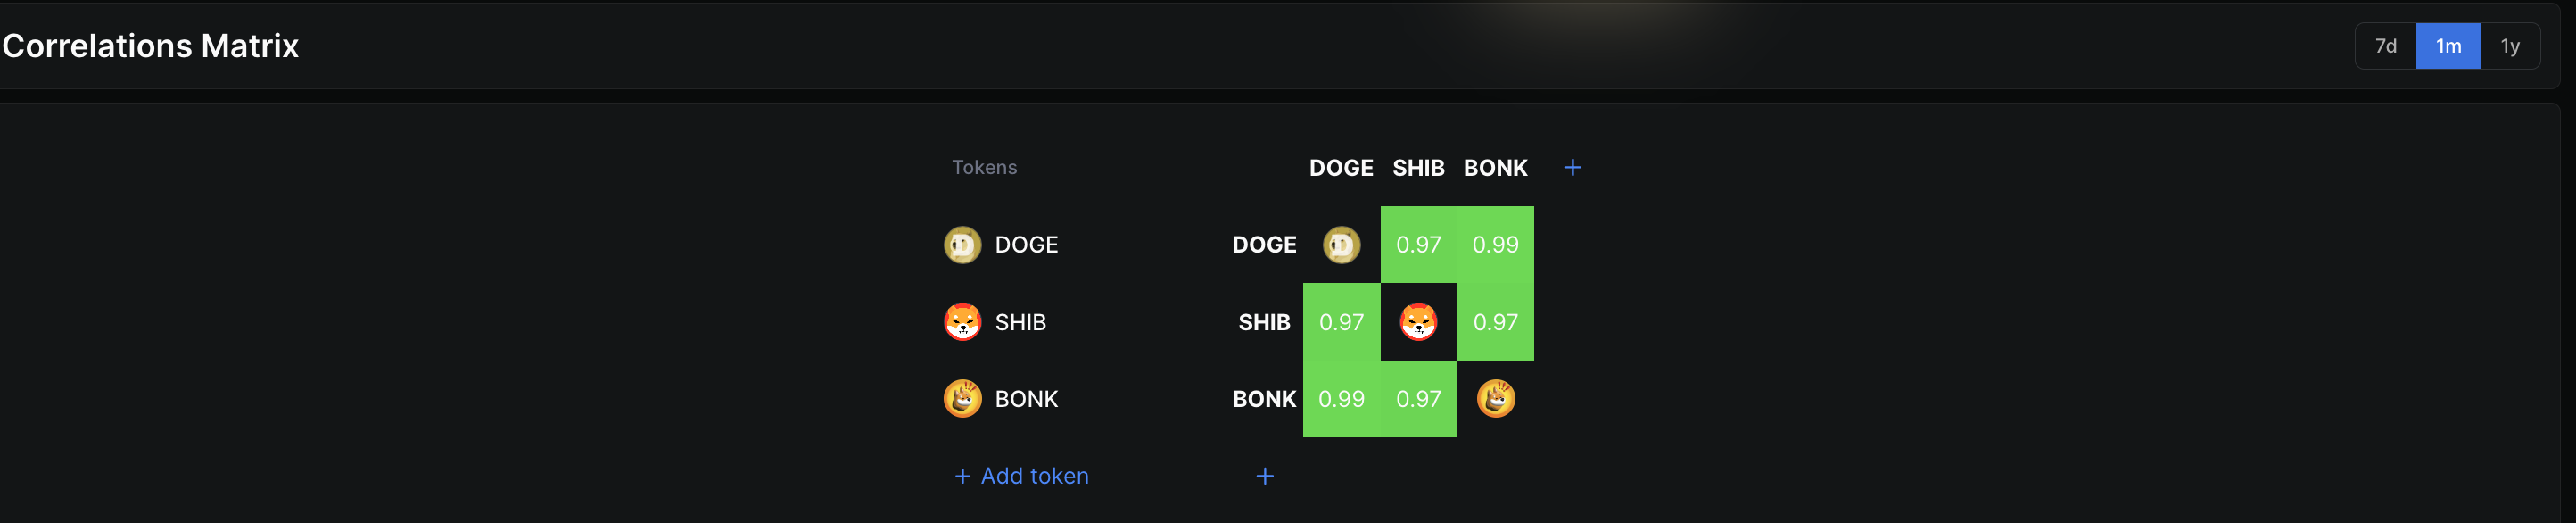 DOGE-BONK-SHIB Correlation: DeFiLlama
This makes their price structures important early signals.
BONK is forming an inverse head and shoulders pattern on the 12-hour chart. This pattern forms when sellers lose strength and buyers gradually take control. The breakout level sits near $0.0000075. If BONK breaks above this level, the pattern projects a move toward $0.000010, which would be about a 43% rally from the neckline.
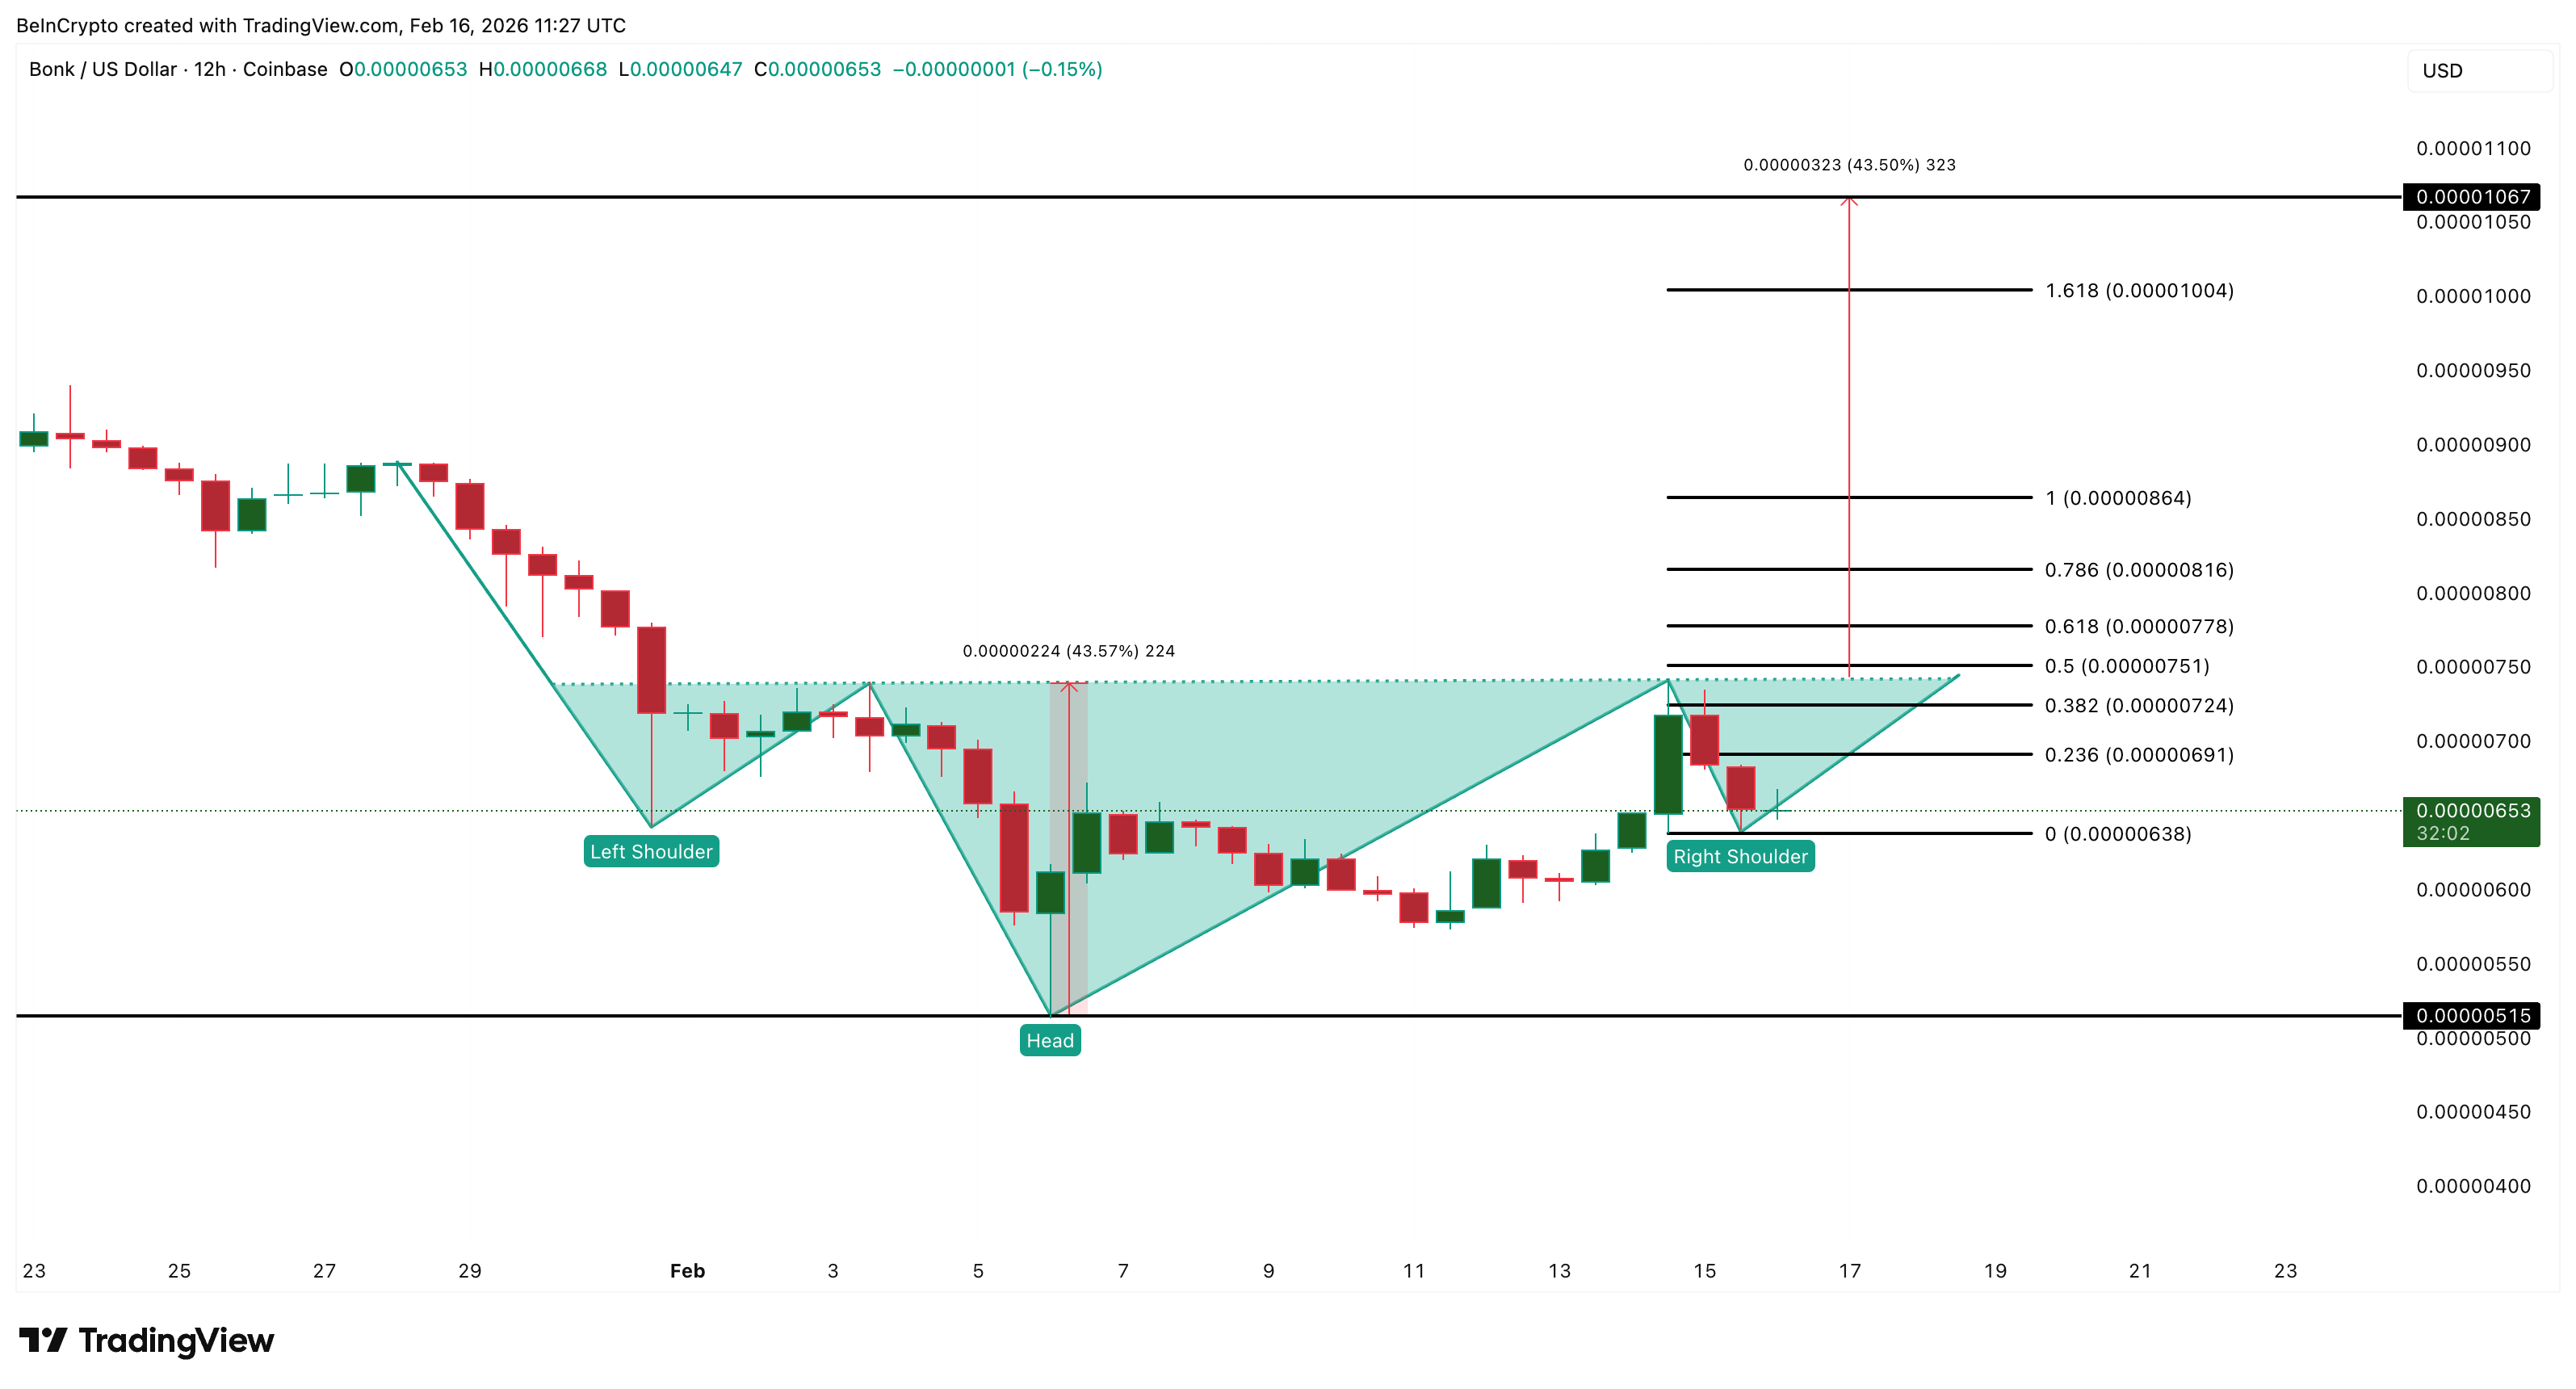 BONK Price Analysis: TradingView
The pattern weakens with a drop under $0.0000063 and invalidates under $0.0000051.
Shiba Inu (SHIB) is forming a bullish flag pattern. A bullish flag happens when the price pauses briefly after a rally before continuing higher. The breakout level sits near $0.0000069. If Shiba Inu breaks above this level, it could rise toward $0.0000099, representing a 43% gain.
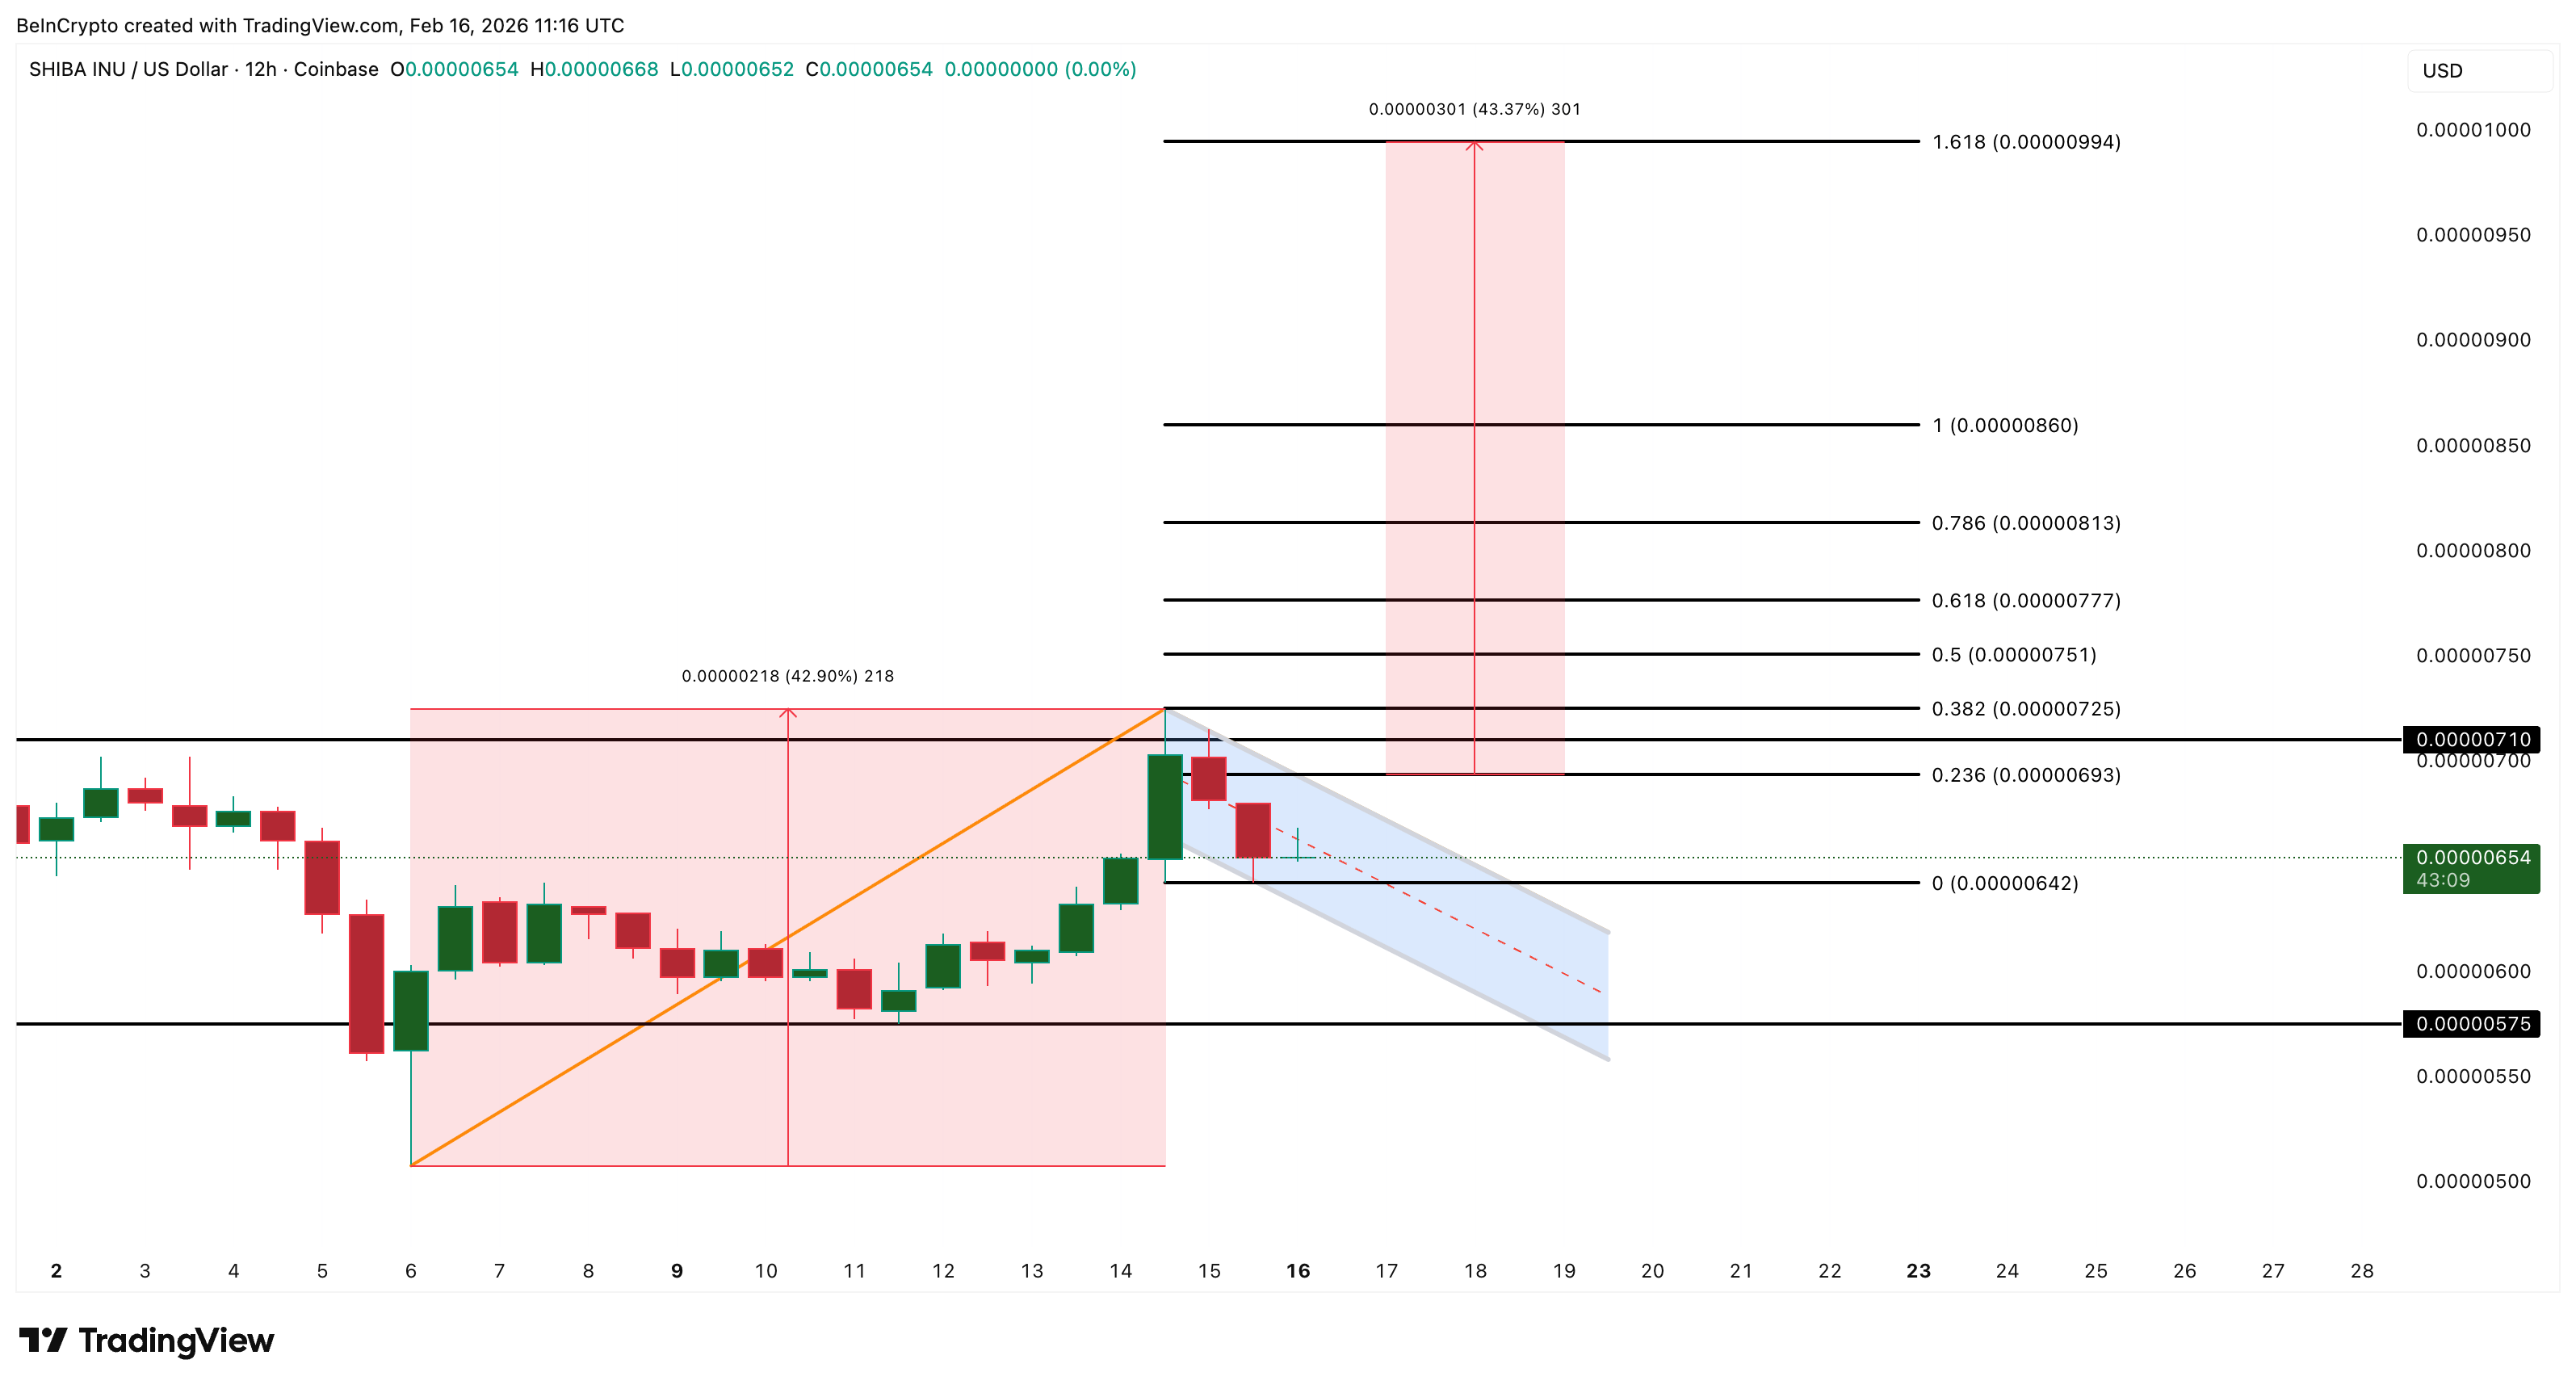 SHIB Price Analysis: TradingView
A dip under $0.0000057 can come close to invalidating the SHIB breakout theory. However, these breakouts may still depend on Dogecoin confirming its own direction.
Meme Coin Market Cap Still Follows Dogecoin’s Lead
The broader meme coin market continues to mirror Dogecoin’s movement.
Between February 6 and February 15, the meme coin market cap increased roughly 43%. Dogecoin price increased slightly more, climbing 47% during the same period.
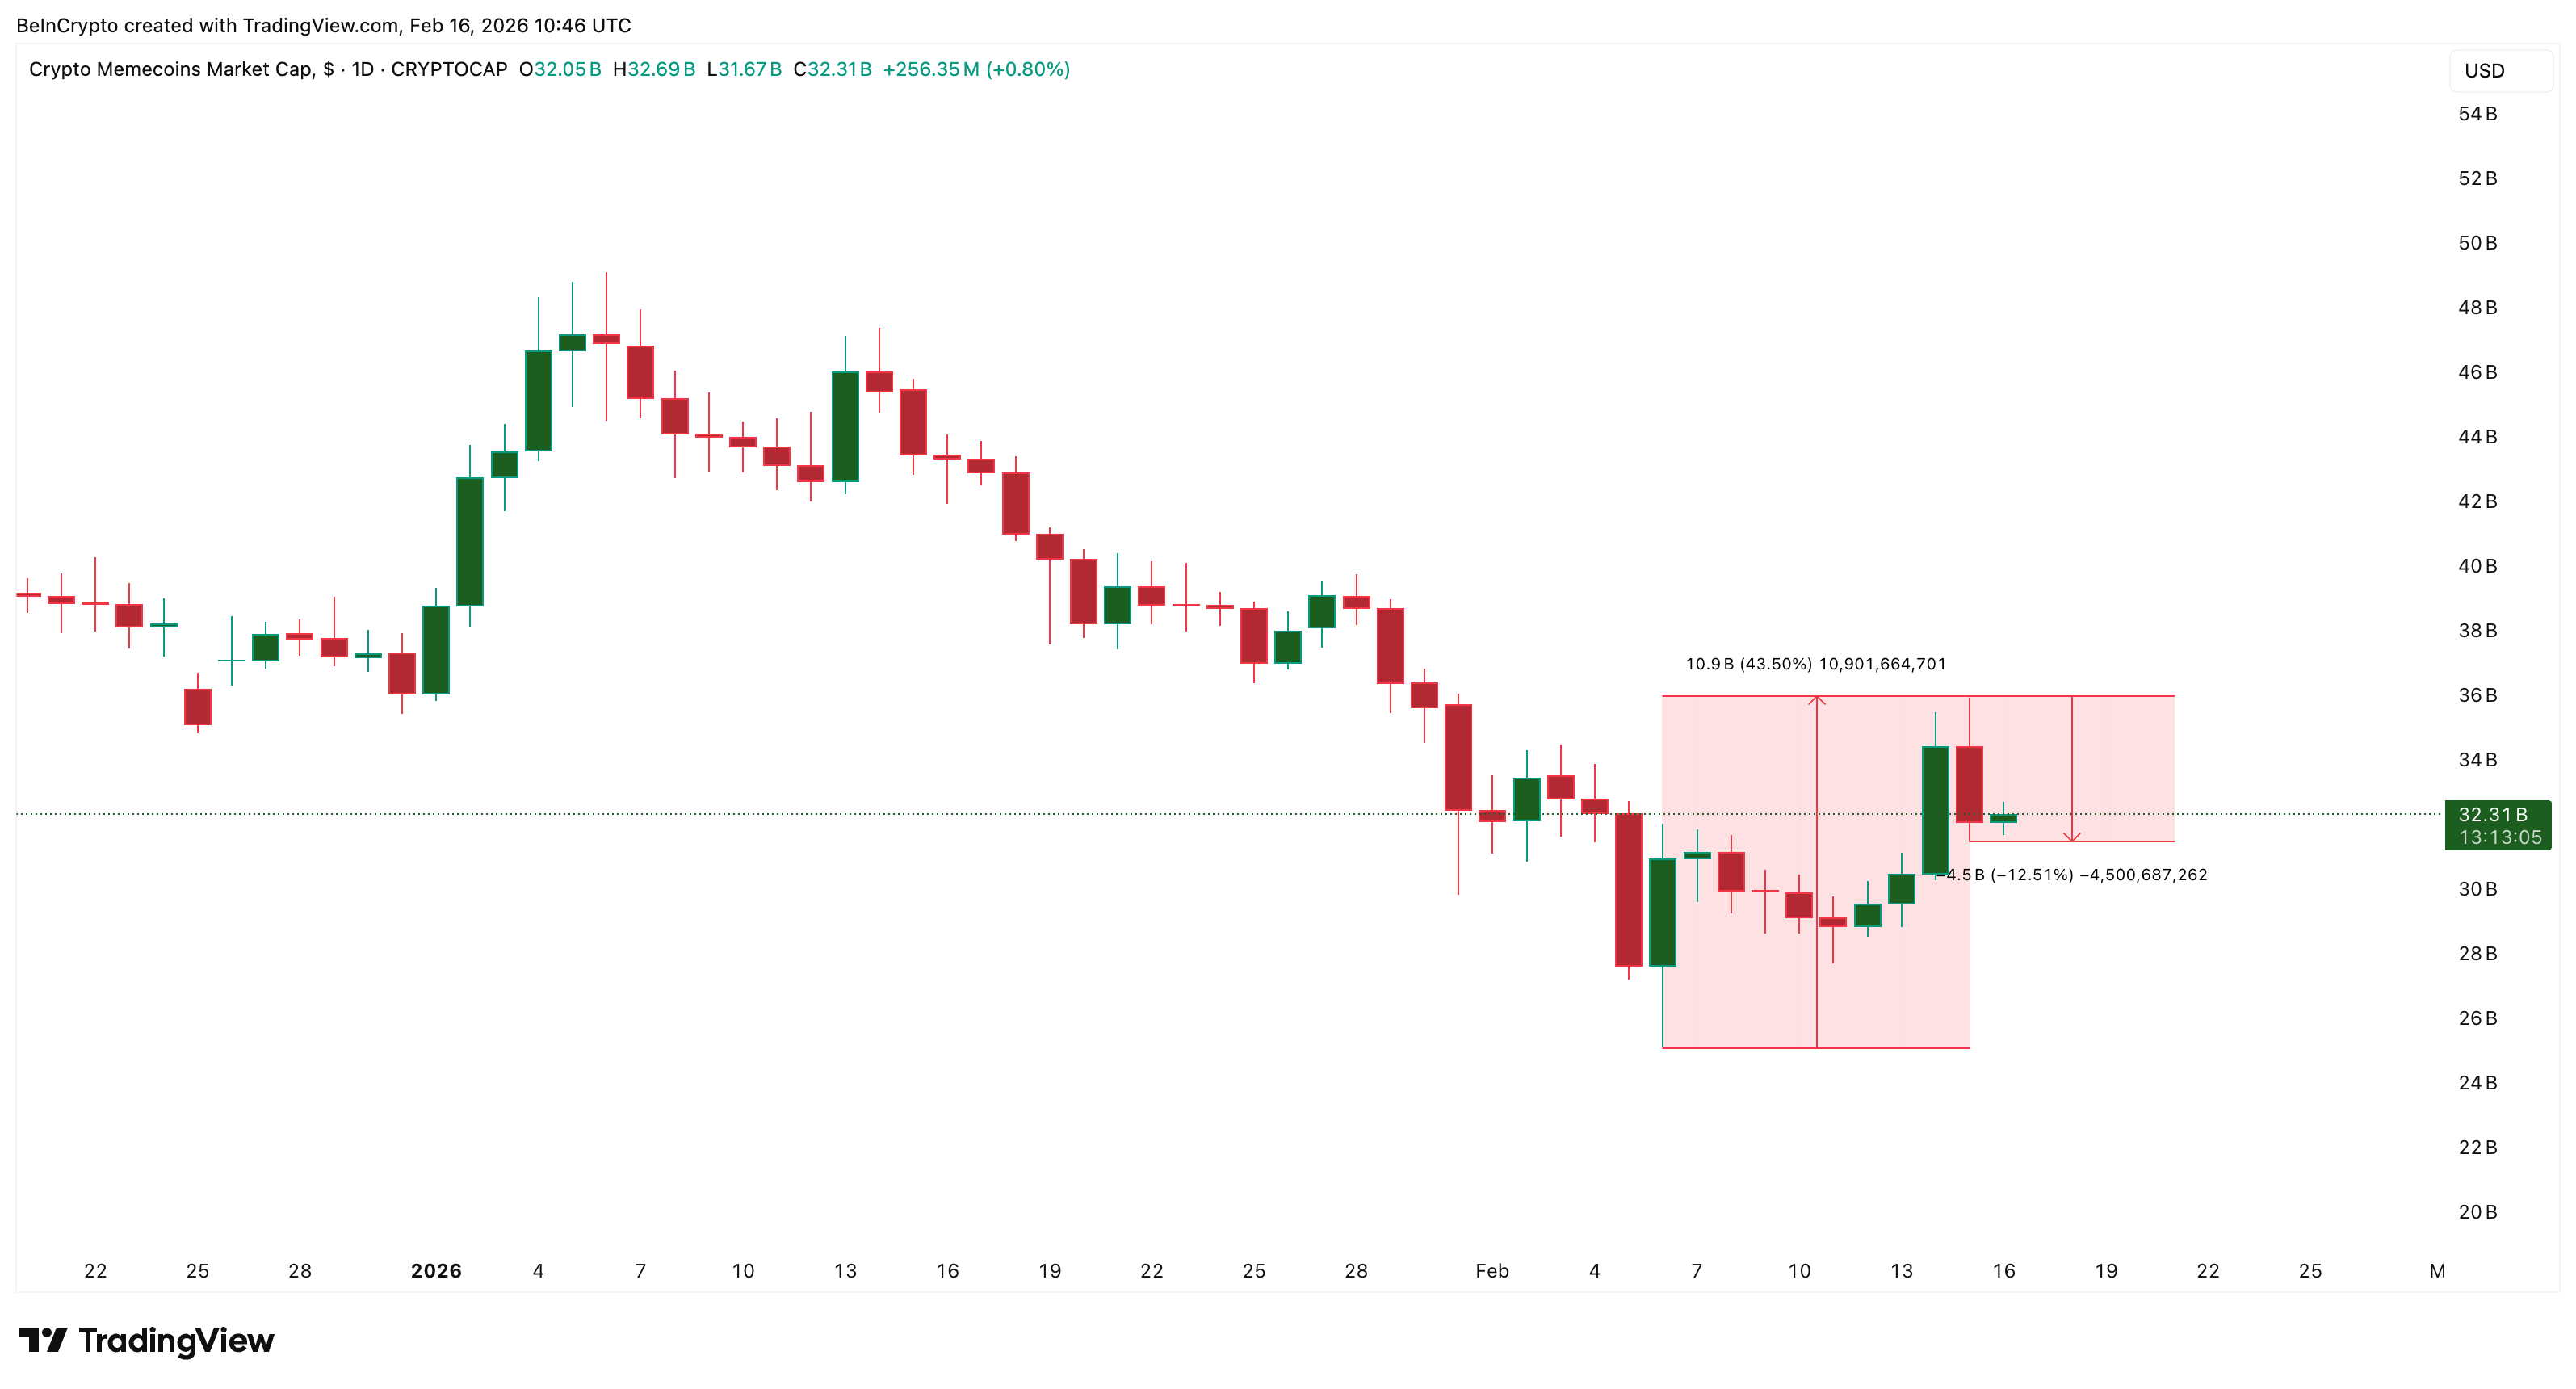 Memecoin Market Cap: TradingView
Even after the recent pullback, the meme coin market cap has fallen only about 12.5%, holding most of its gains. This shows the overall cycle has weakened but not collapsed.
Dogecoin still dominates the meme coin sector with a market cap of nearly $17 billion, representing over 50% of the entire meme coin market, at press time. Because of this dominance, Dogecoin often determines whether meme coin rallies expand or fade.
 Meme Coins Still Bullish: Coingecko
This makes Dogecoin’s own structure the most important signal.
Holders and Whales Are Quietly Positioning Again
On-chain data shows stronger holders are increasing control while short-term traders exit.
One key metric is Spent Coins Age Band. This measures how many coins of different holding ages are being spent. When these coins move, it often means that holder cohorts are selling. When the metric falls, it shows holders are staying inactive and holding.
This metric dropped sharply from 461 million coins to 168 million coins, a decline of about 64%. Similar drops previously appeared near local bottoms.
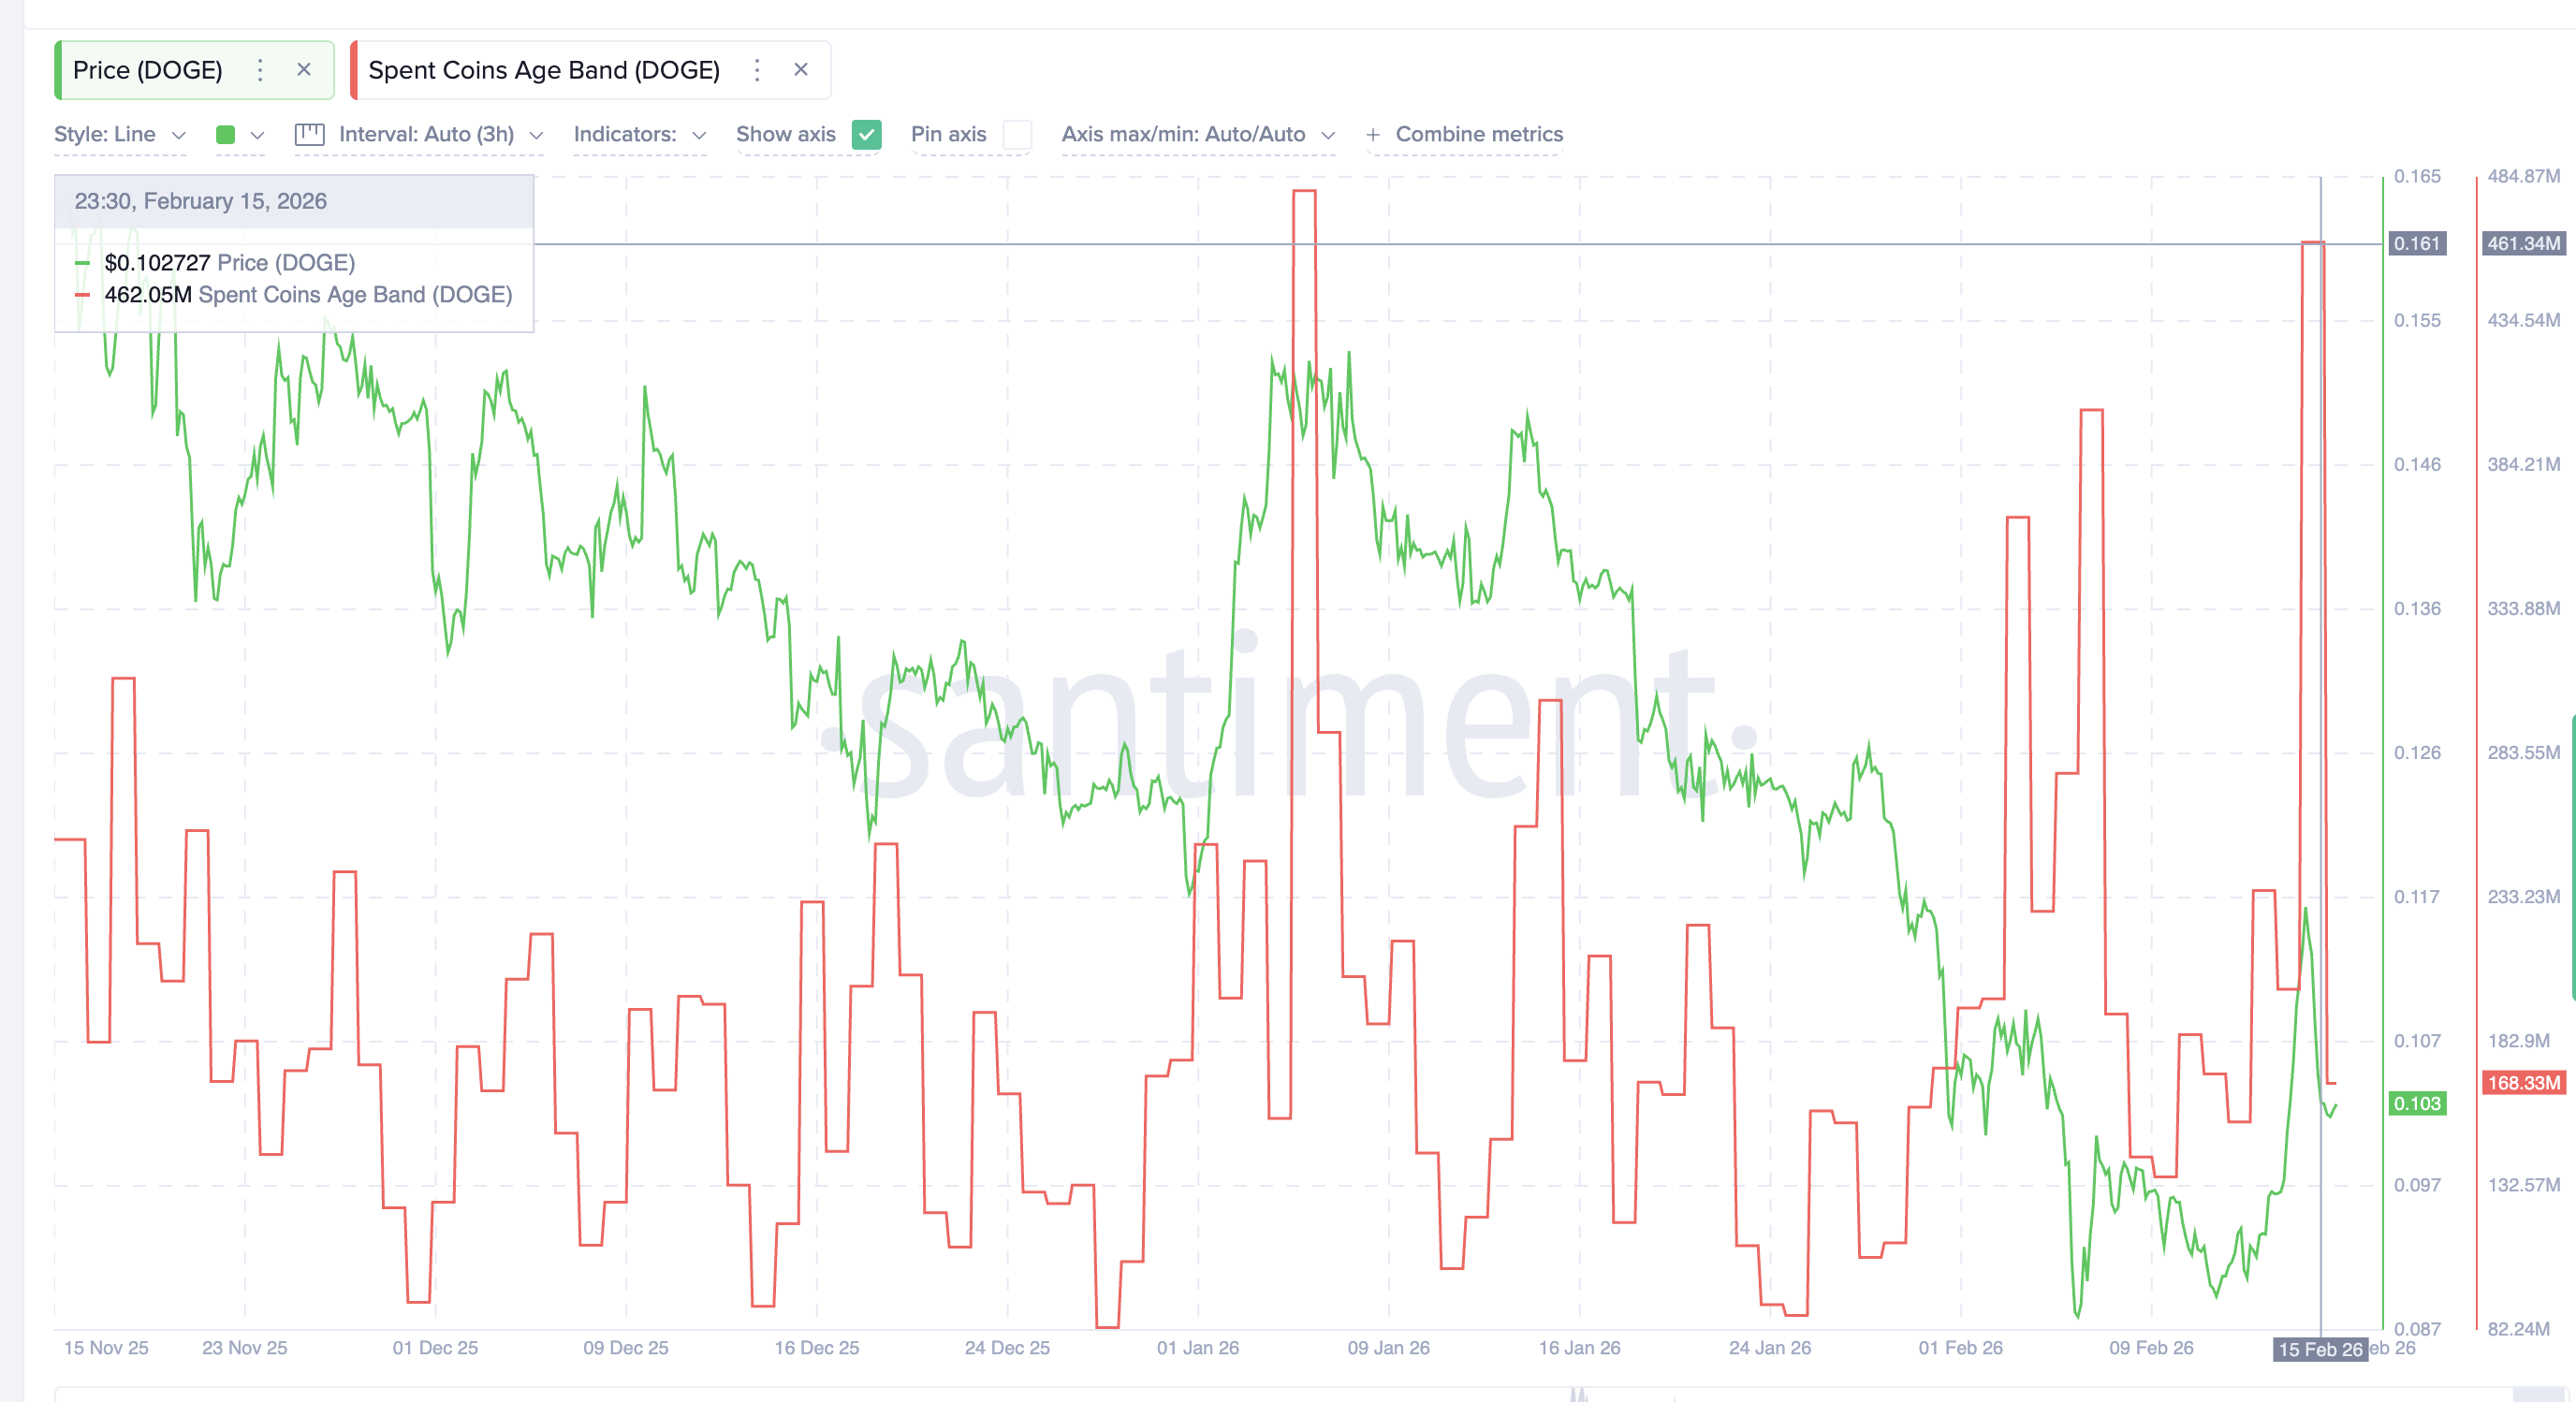 Coin Activity Dips: Santiment
For example:
- On February 10, the metric reached a local low. Dogecoin price then rose about 22% within four days.
- On January 26, another local low appeared. Dogecoin price rose about 6% within two days.
Another indicator called HODL Waves shows how long investors hold their coins. Short-term holders, holding coins for one to three months, reduced their share from 10.41% to 5.70%, a drop of about 45%. This shows speculative traders exited.
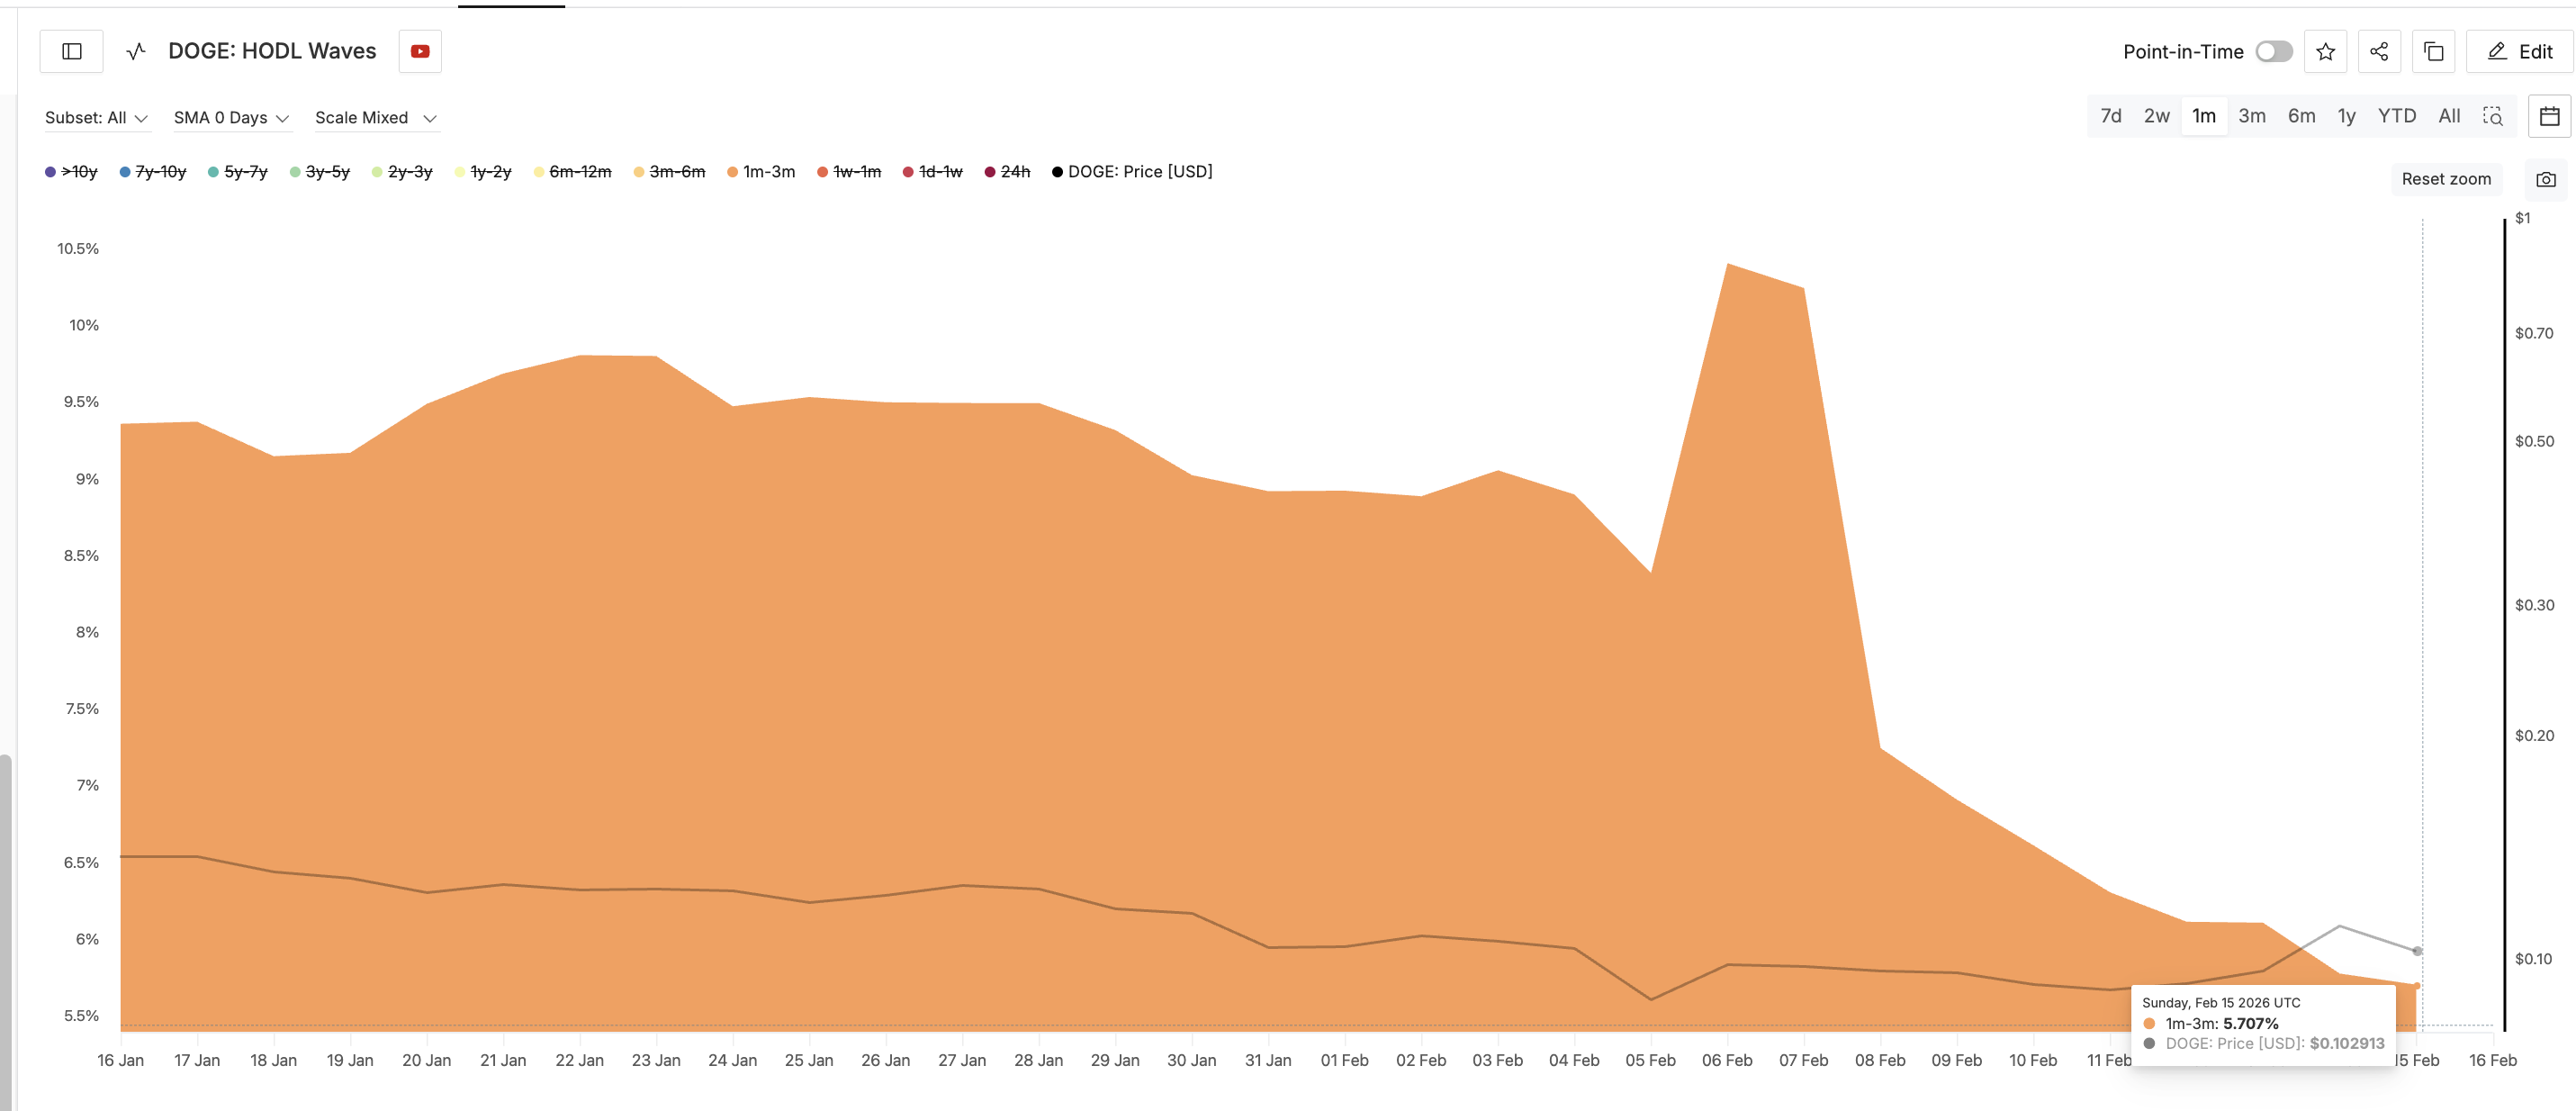 Speculative Holders Leaving: Glassnode
Meanwhile, stronger holders increased exposure. Coins held for six to twelve months increased from 10.48% to 11.22%, a 7% increase. This shows growing conviction.
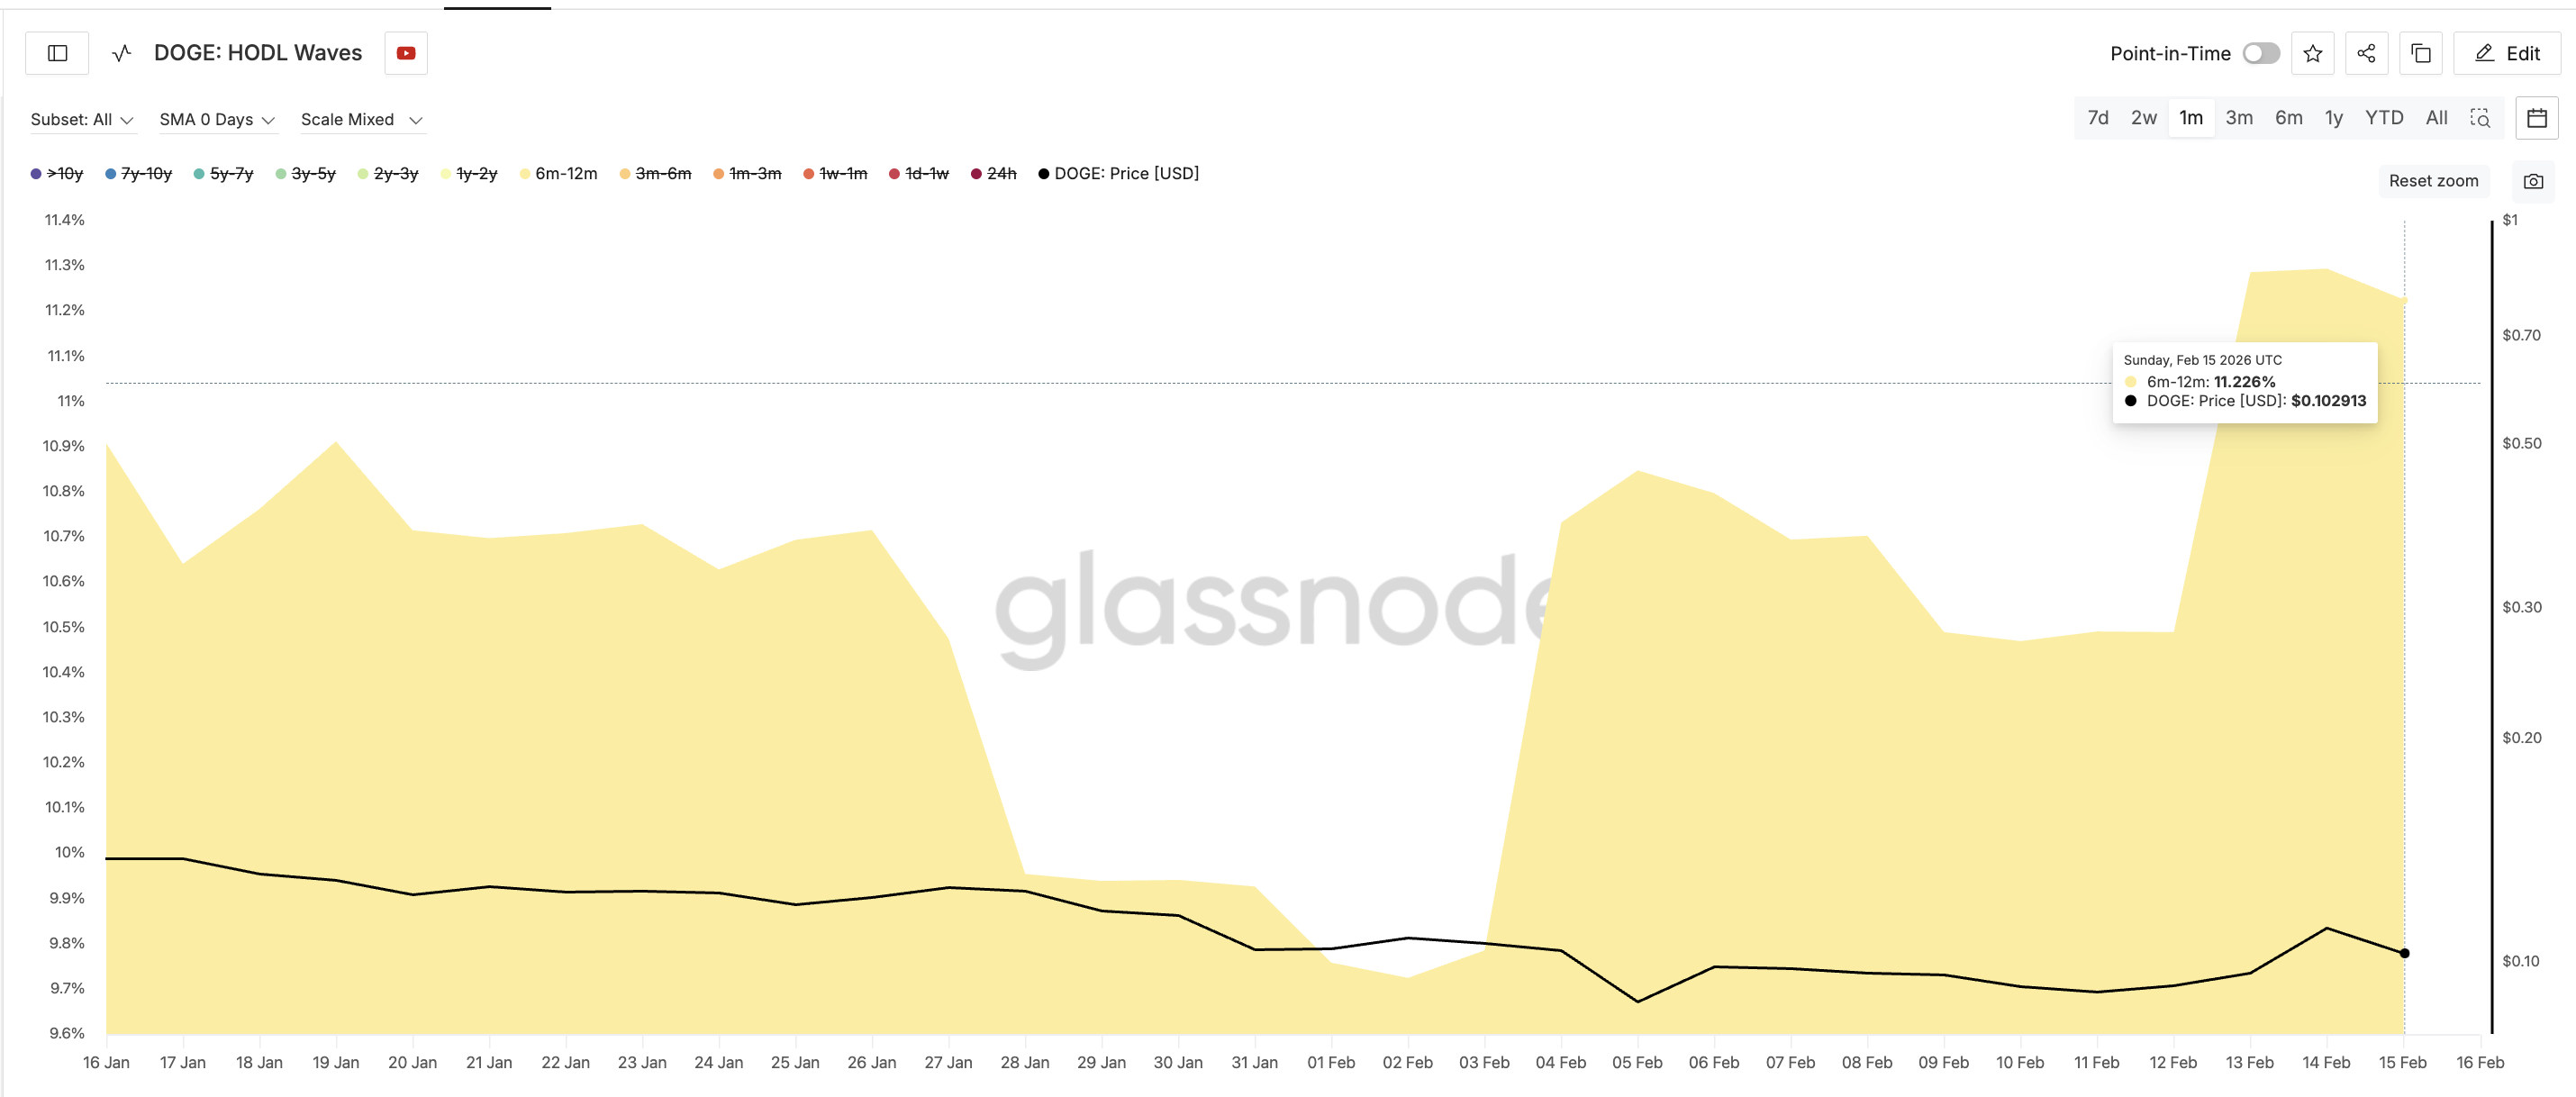 Mid-To-Long Term Holders Buying: Glassnode
Whales also accumulated. Wallets holding over one billion DOGE (the biggest whales) increased holdings from 70.56 billion to 70.84 billion coins, adding roughly 280 million coins.
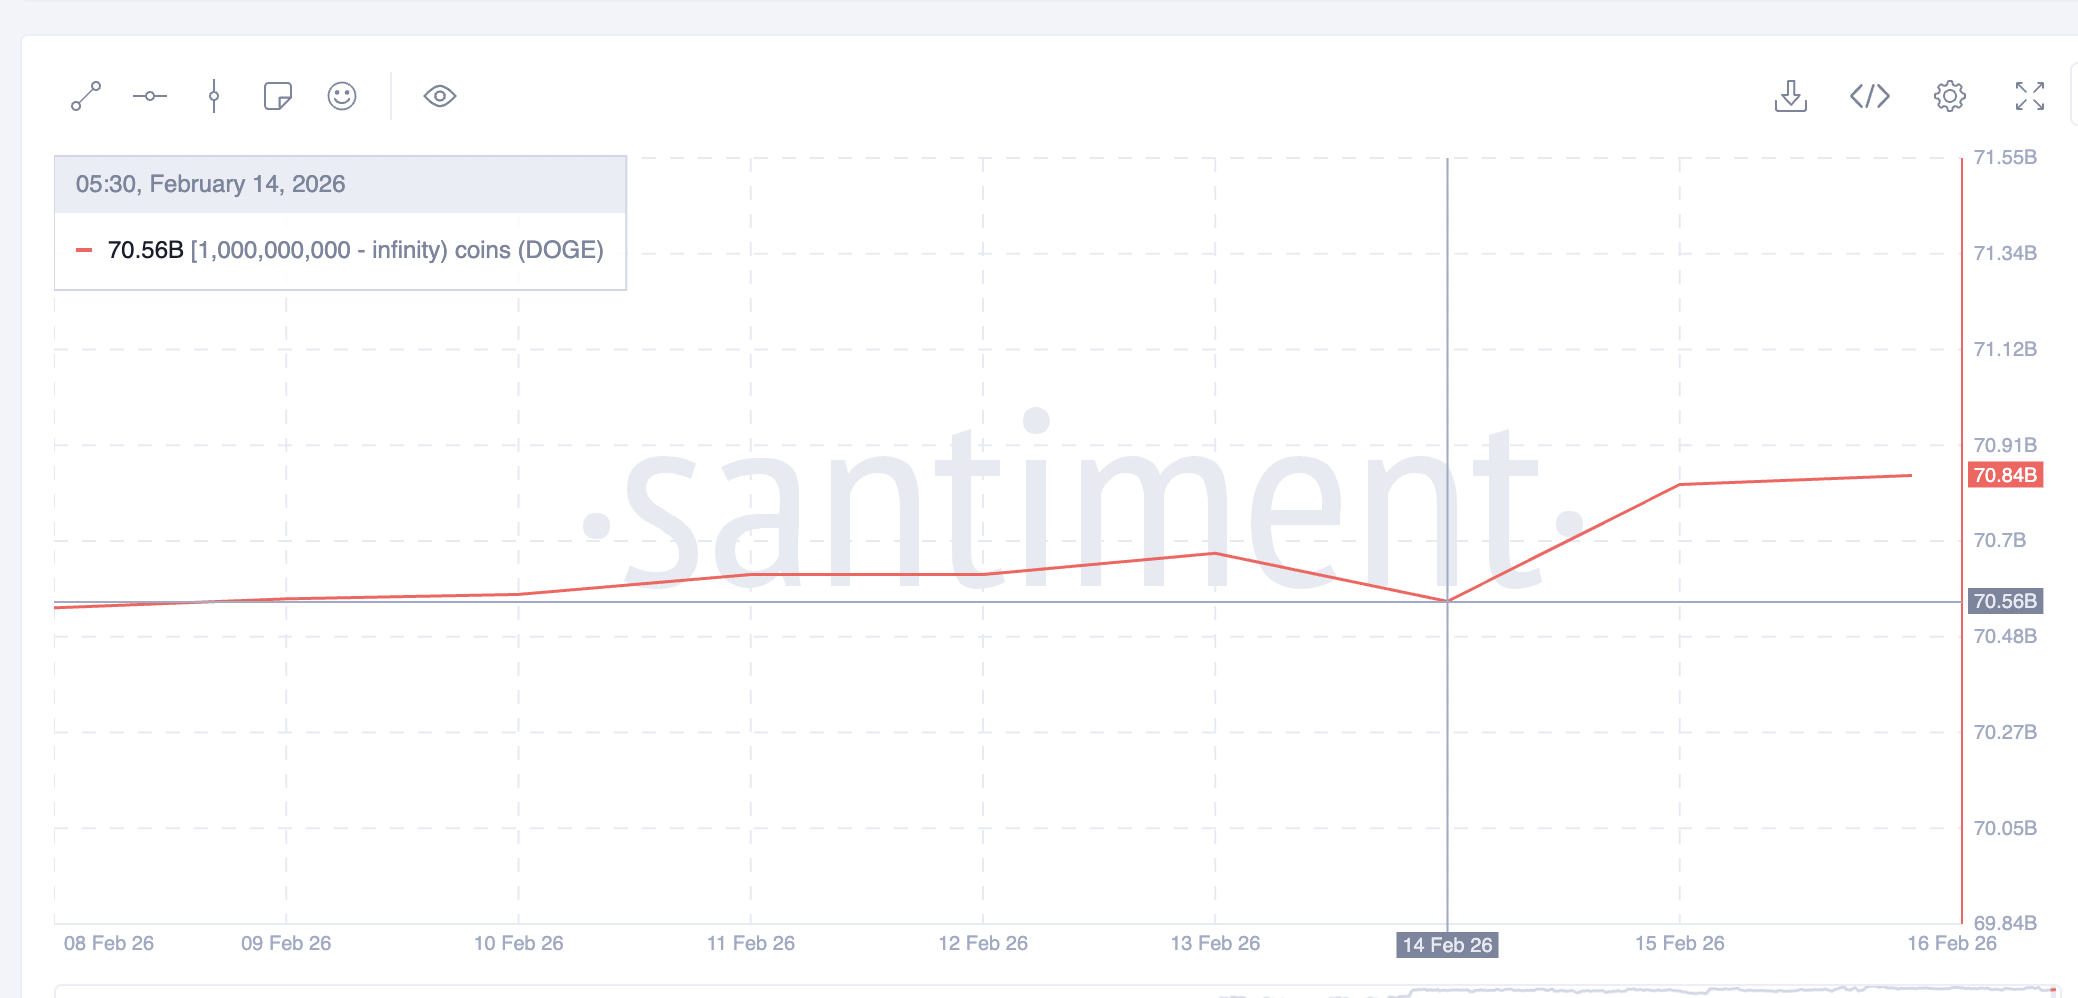 Dogecoin Whales: Santiment
This shift shows stronger hands replacing weaker ones.
Dogecoin Price Pattern Now Holds the Key Meme Coin Season Signal
Despite the recent 13% pullback, Dogecoin’s price structure remains bullish. On the 12-hour chart, Dogecoin is forming a cup and handle pattern. This pattern often appears before continuation rallies.
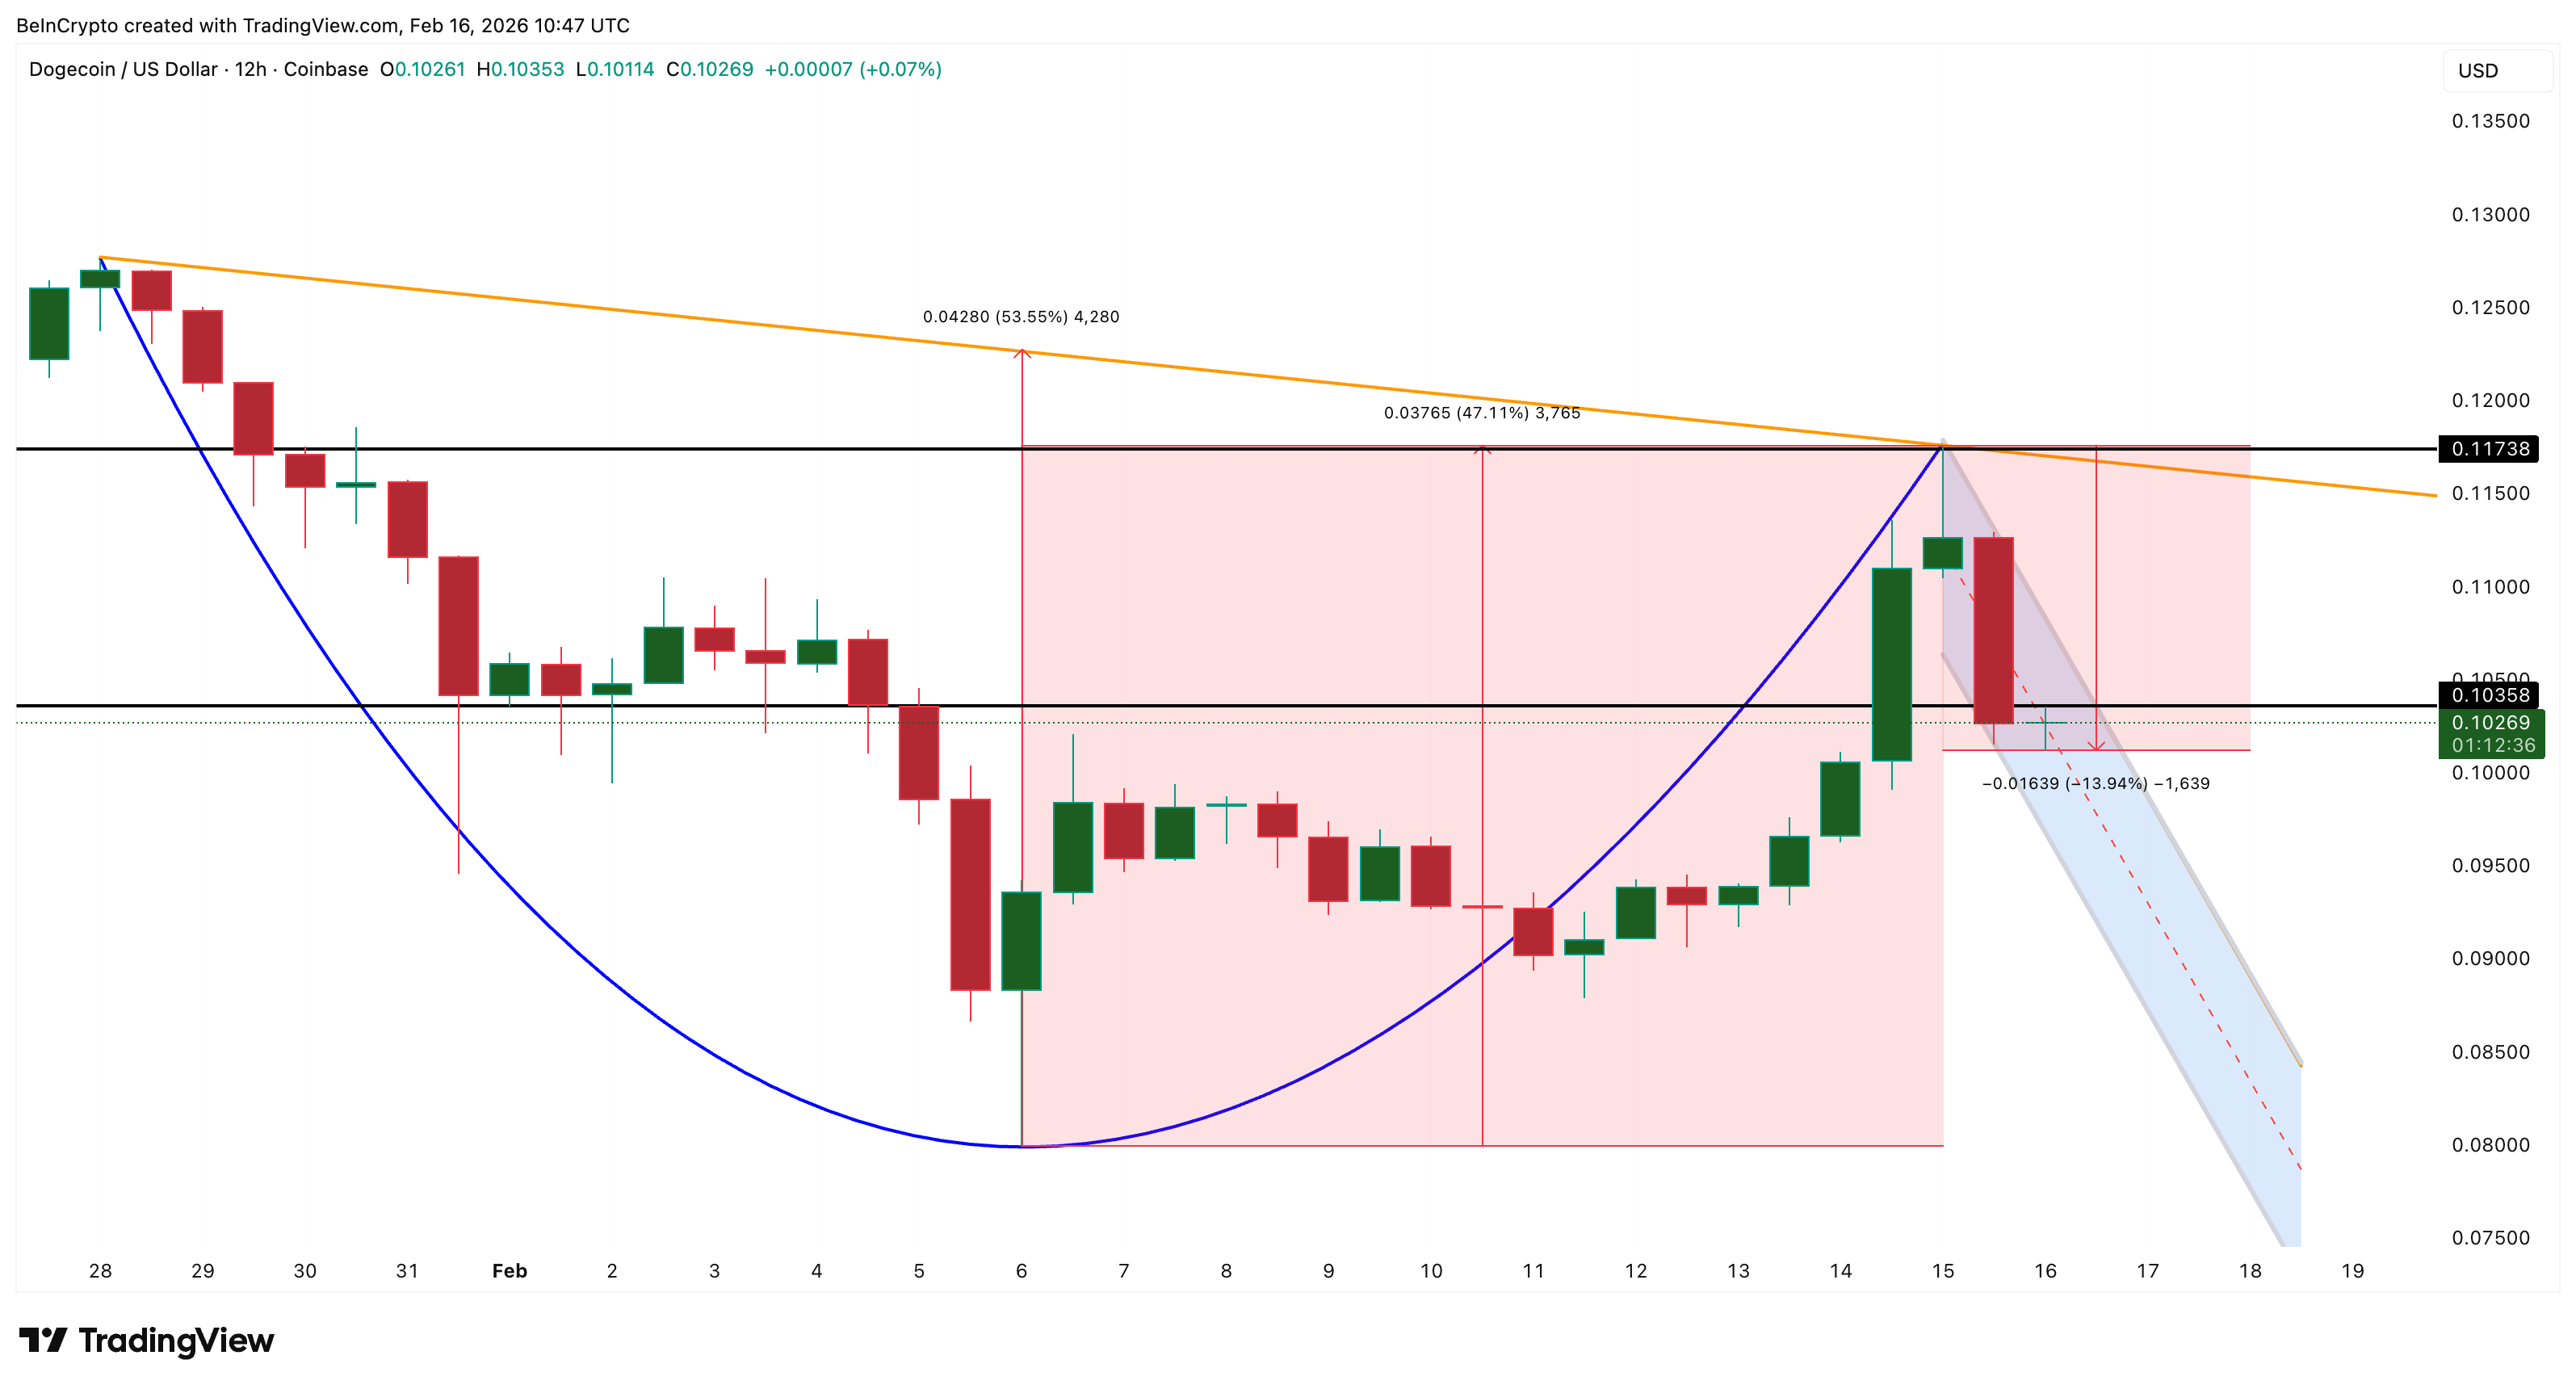 Dogecoin Price Structure: TradingView
The cup formed between late January and early February. The current pullback forms the handle. Importantly, the handle support near $0.103 remains intact, showing buyers are still active. The key breakout level now sits near $0.117, which is also a down-sloping neckline resistance.
If Dogecoin breaks above $0.117, the pattern projects a move toward $0.180, representing roughly a 50% rally, per pattern projection. Supporting this, the Smart Money Index, which tracks experienced investor activity, remains above its signal line. This suggests larger investors have not exited.
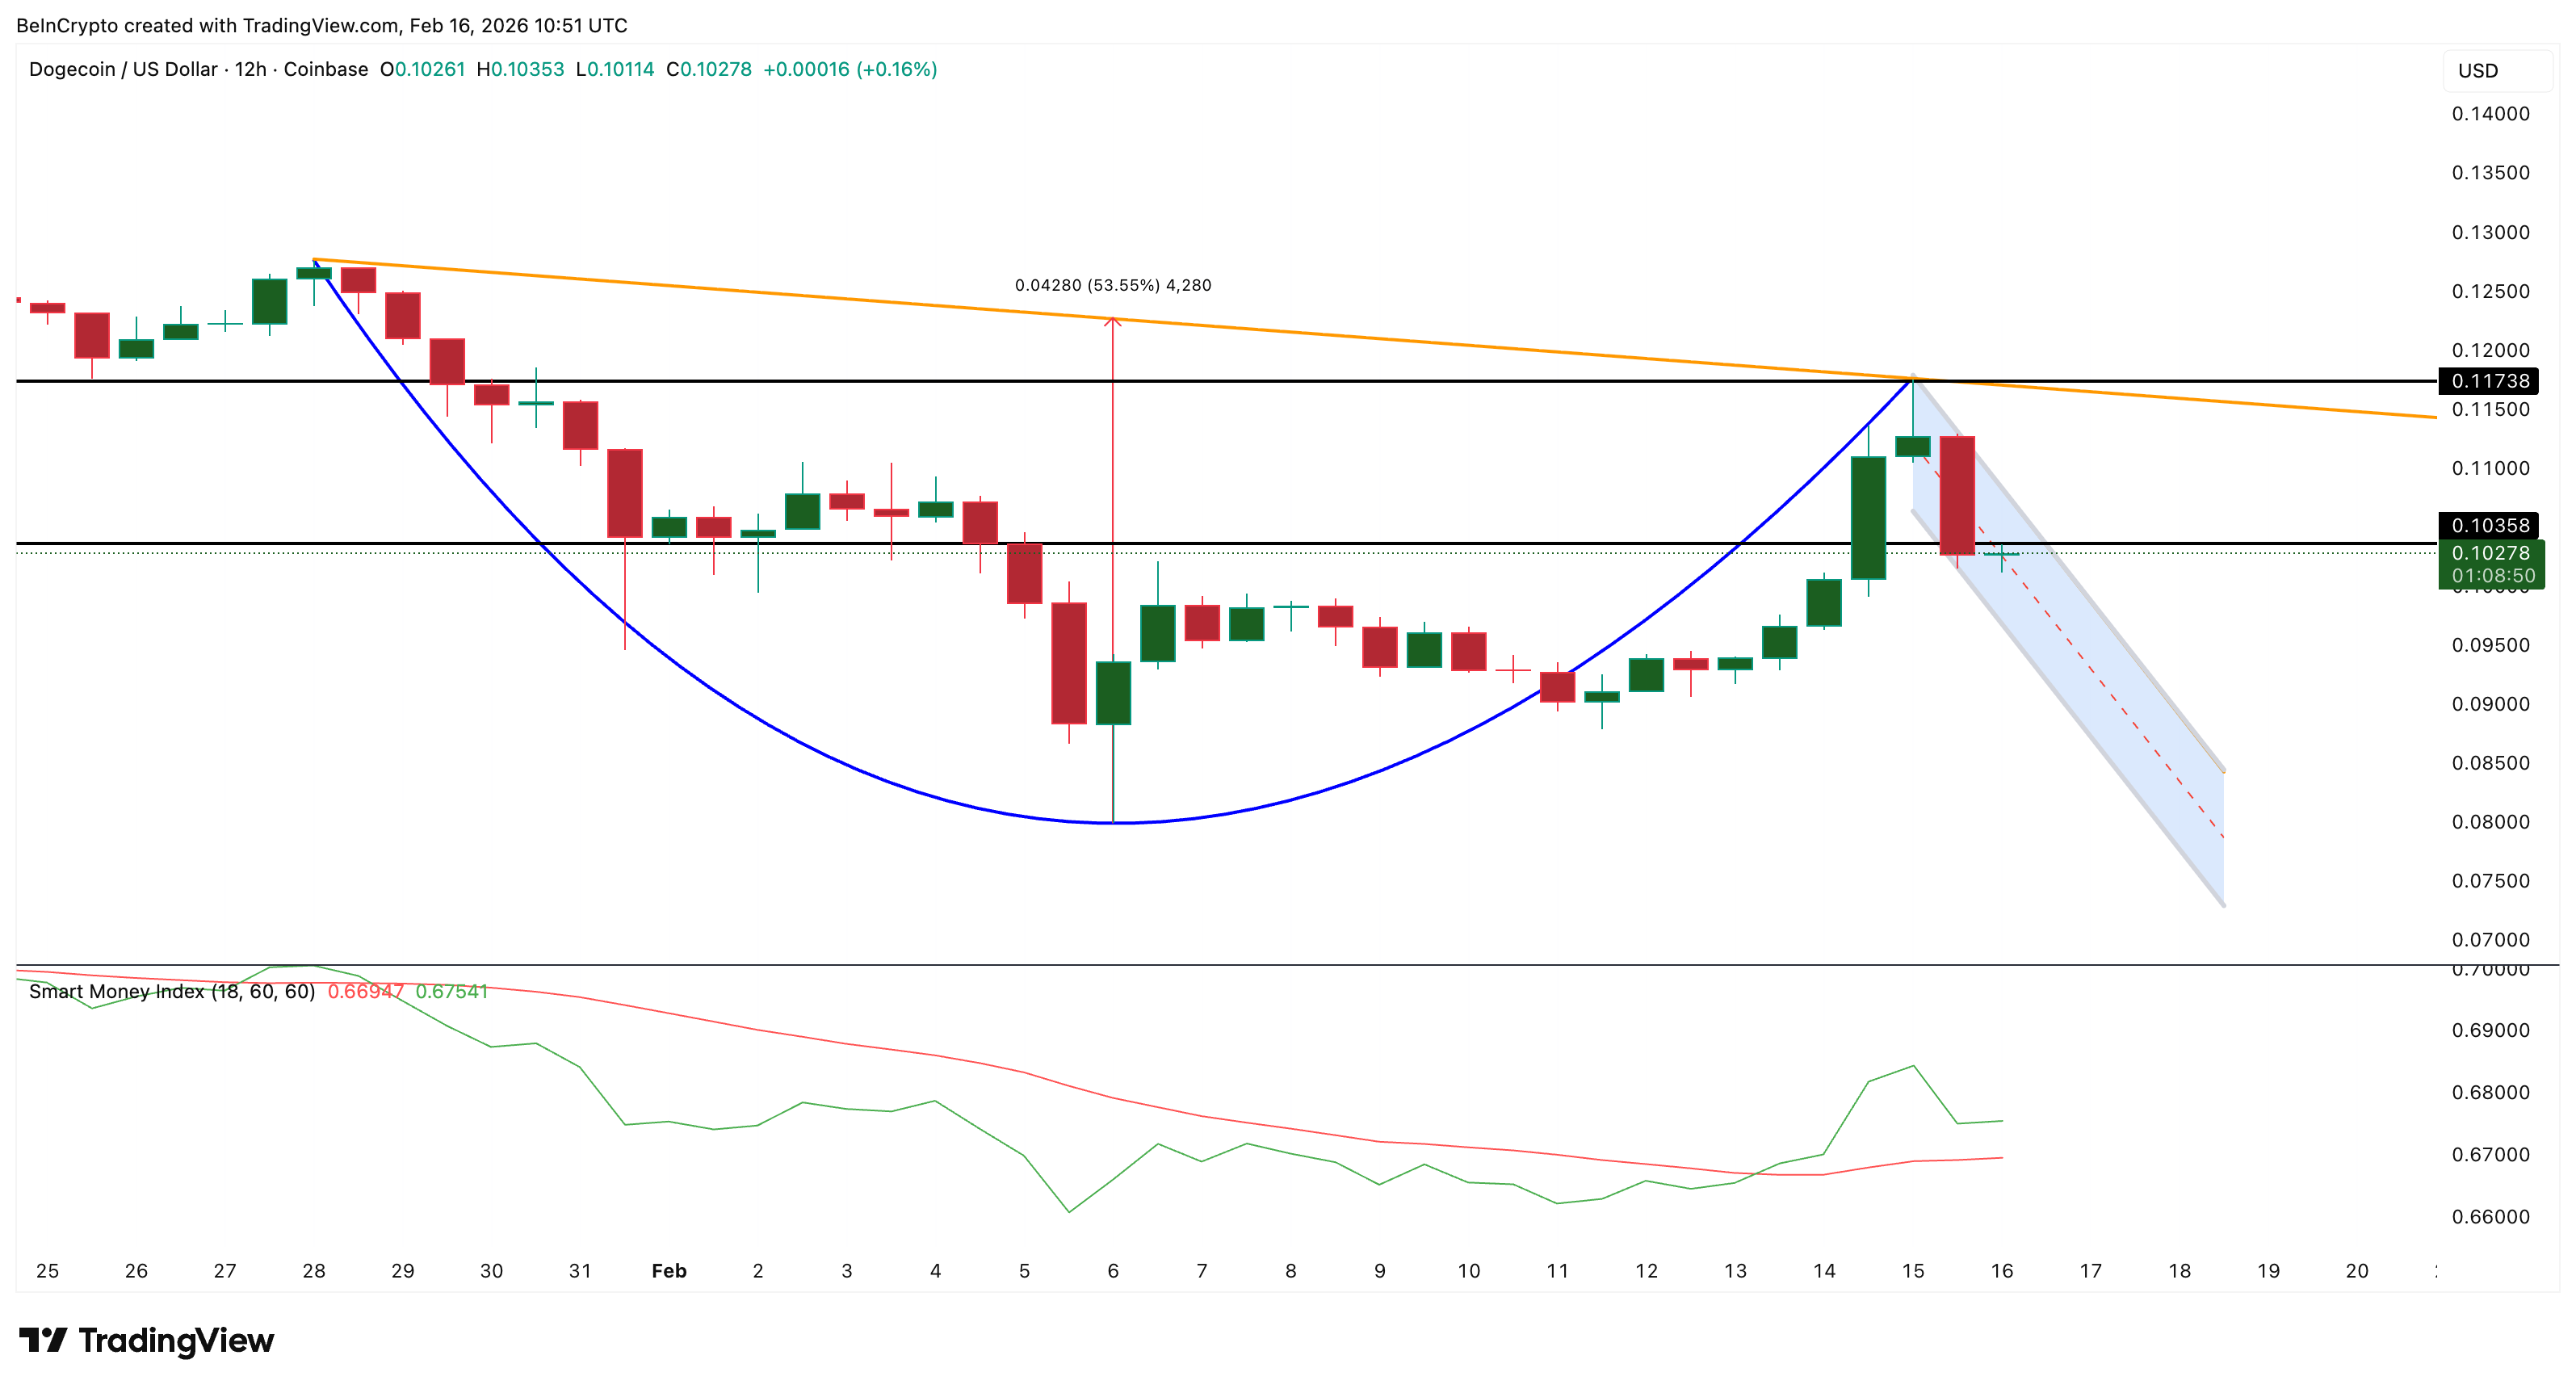 Smart Money Still Invested: TradingView
However, risks remain. If Dogecoin falls below $0.098, the pattern would weaken. A drop below $0.091 would invalidate the bullish structure.
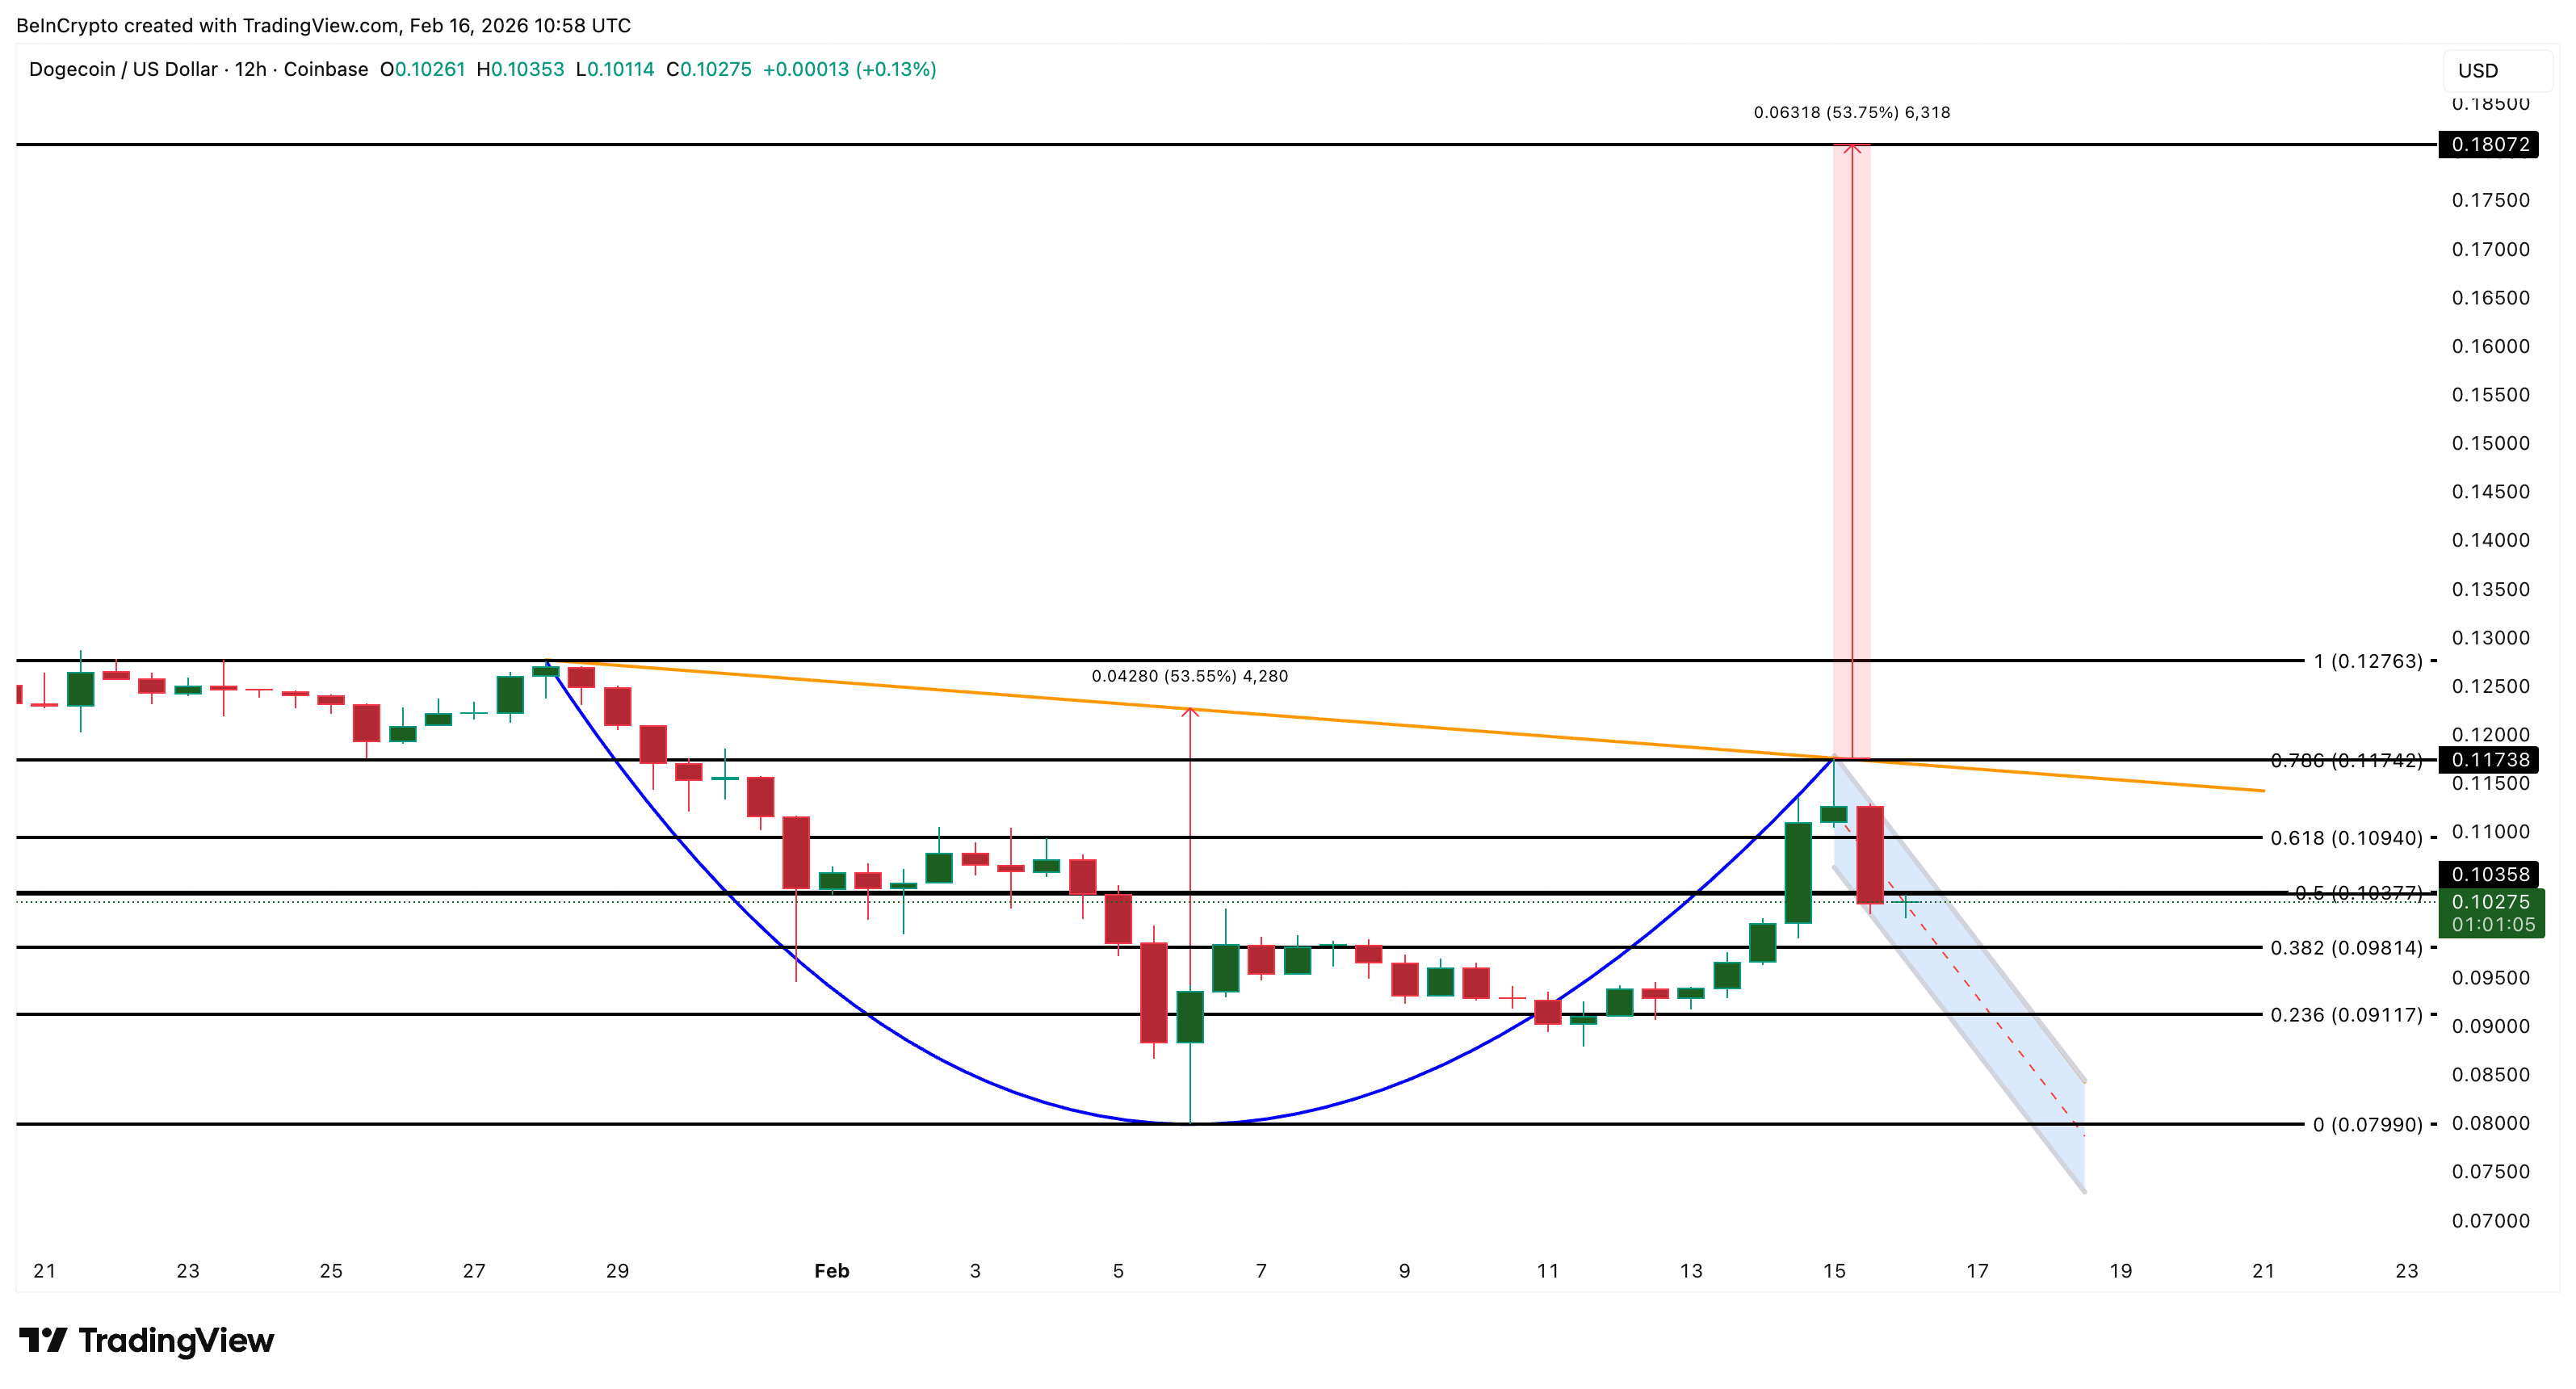 Dogecoin Price Analysis: TradingView
For now, Dogecoin price continues to hold the strongest clues for meme coin season. BONK and Shiba Inu are already preparing breakout structures.
But whether those breakouts fully develop may depend on Dogecoin confirming its own move first.
Recommended Articles


