


Crypto Today: Bitcoin, Ethereum, XRP rebound amid risk-off, $2.6 billion liquidation wave
- Bitcoin rebounds after testing an intraday low at $60,000 amid persistent retail investor exit.
- Ethereum shows subtle signs of recovery, but ETFs outflows limit upside.
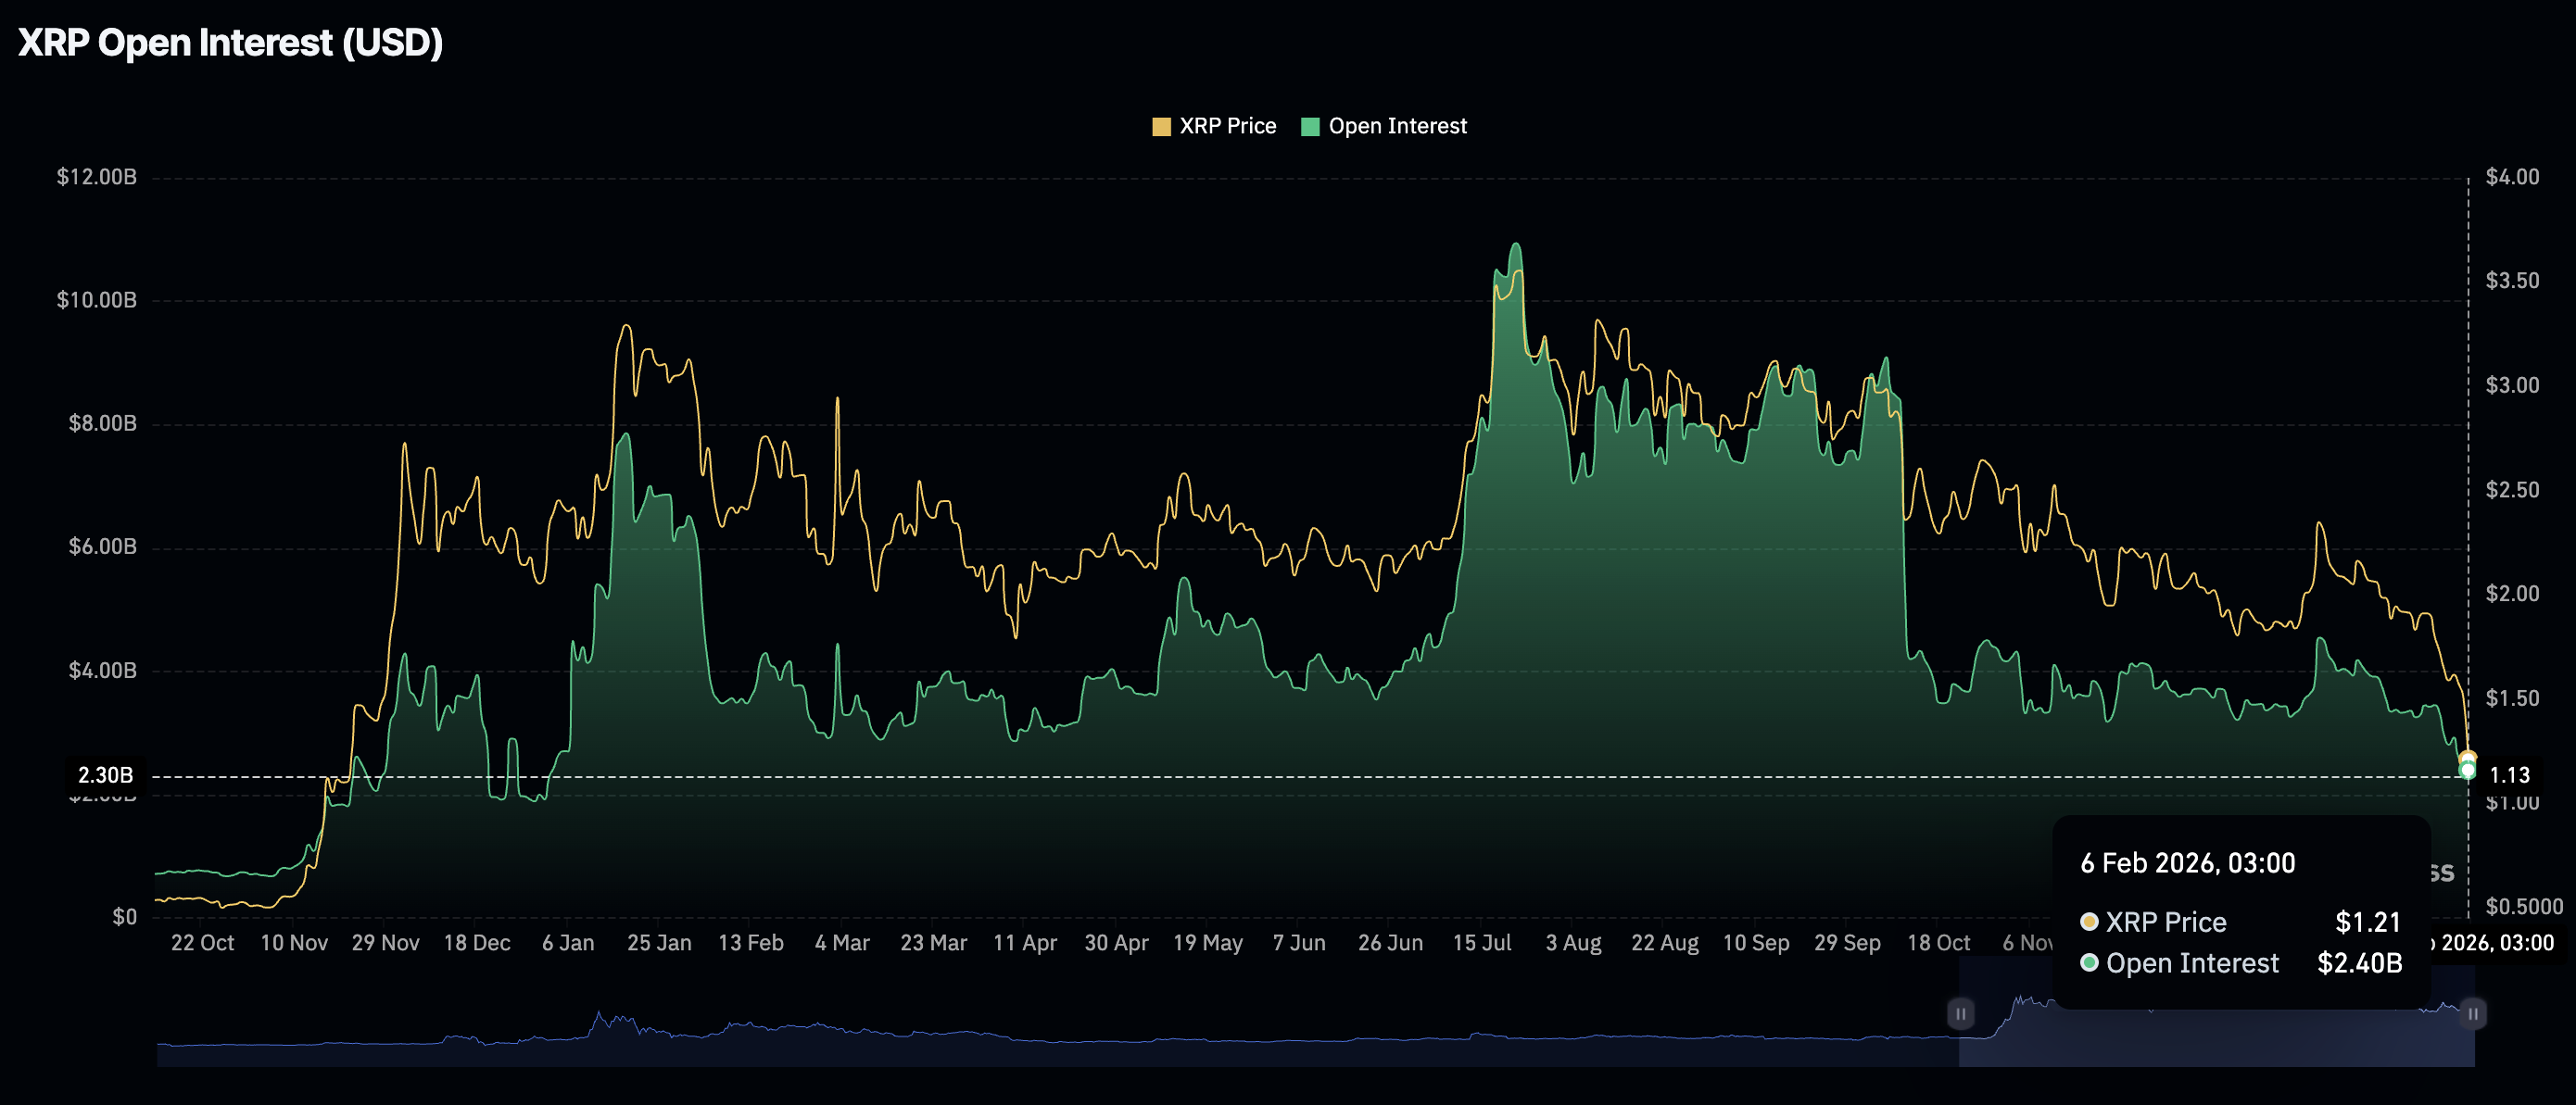
- XRP gains by over 10% on Friday amid mild ETF inflows and a drop in futures Open Interest to $2.40 billion.
Bitcoin (BTC) edges up above $65,000 at the time of writing on Friday, as dust from the recent macro-triggered sell-off settles. The leading altcoin, Ethereum (ETH), hovers above $1,900, but resistance at $2,000 caps the upside. Meanwhile, Ripple (XRP) has recorded the largest intraday jump among the three assets, up over 10% to $1.35.
Macro headwinds and risk-off sentiment could limit Bitcoin, Ethereum and XRP recovery
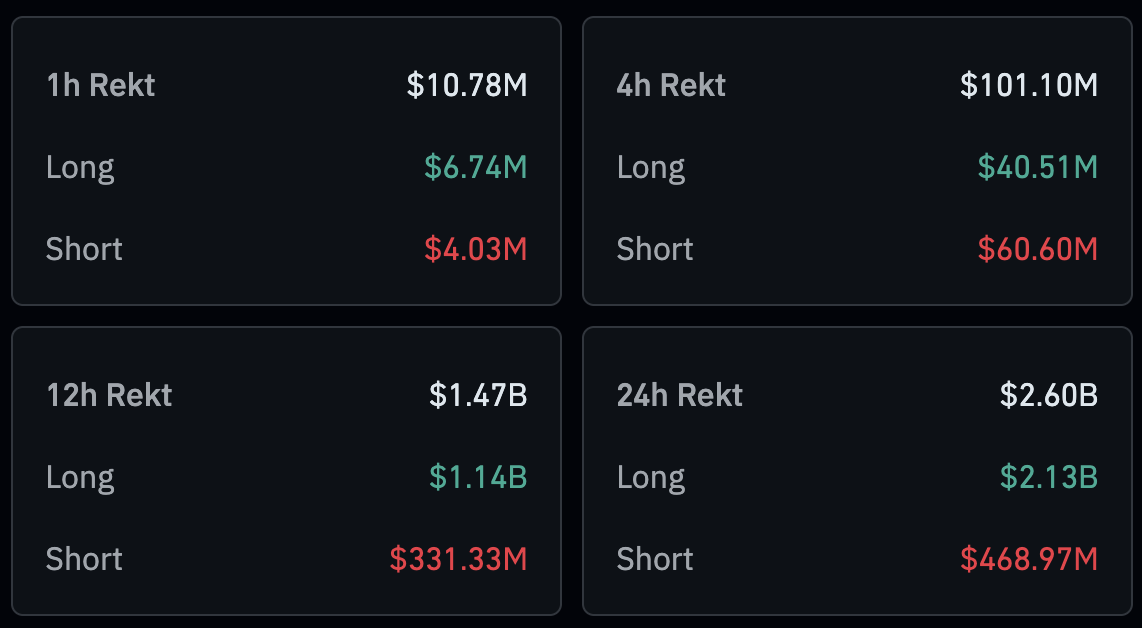
Bitcoin briefly hit $60,000 earlier in the day, as a persistent macro-triggered bearish wave criss-crossed the broader crypto market. The derivatives market reflected the drawdowns with total 24-hour liquidations reaching $2.6 billion on Friday.
Long position holders bore the biggest brunt of the sell-off, losing $2.13 billion compared to $469 million in short positions. Despite suffering massive liquidations, Bitcoin, Ethereum, and XRP are showing subtle signs of recovery, which may offer relief to investors who remain underwater.
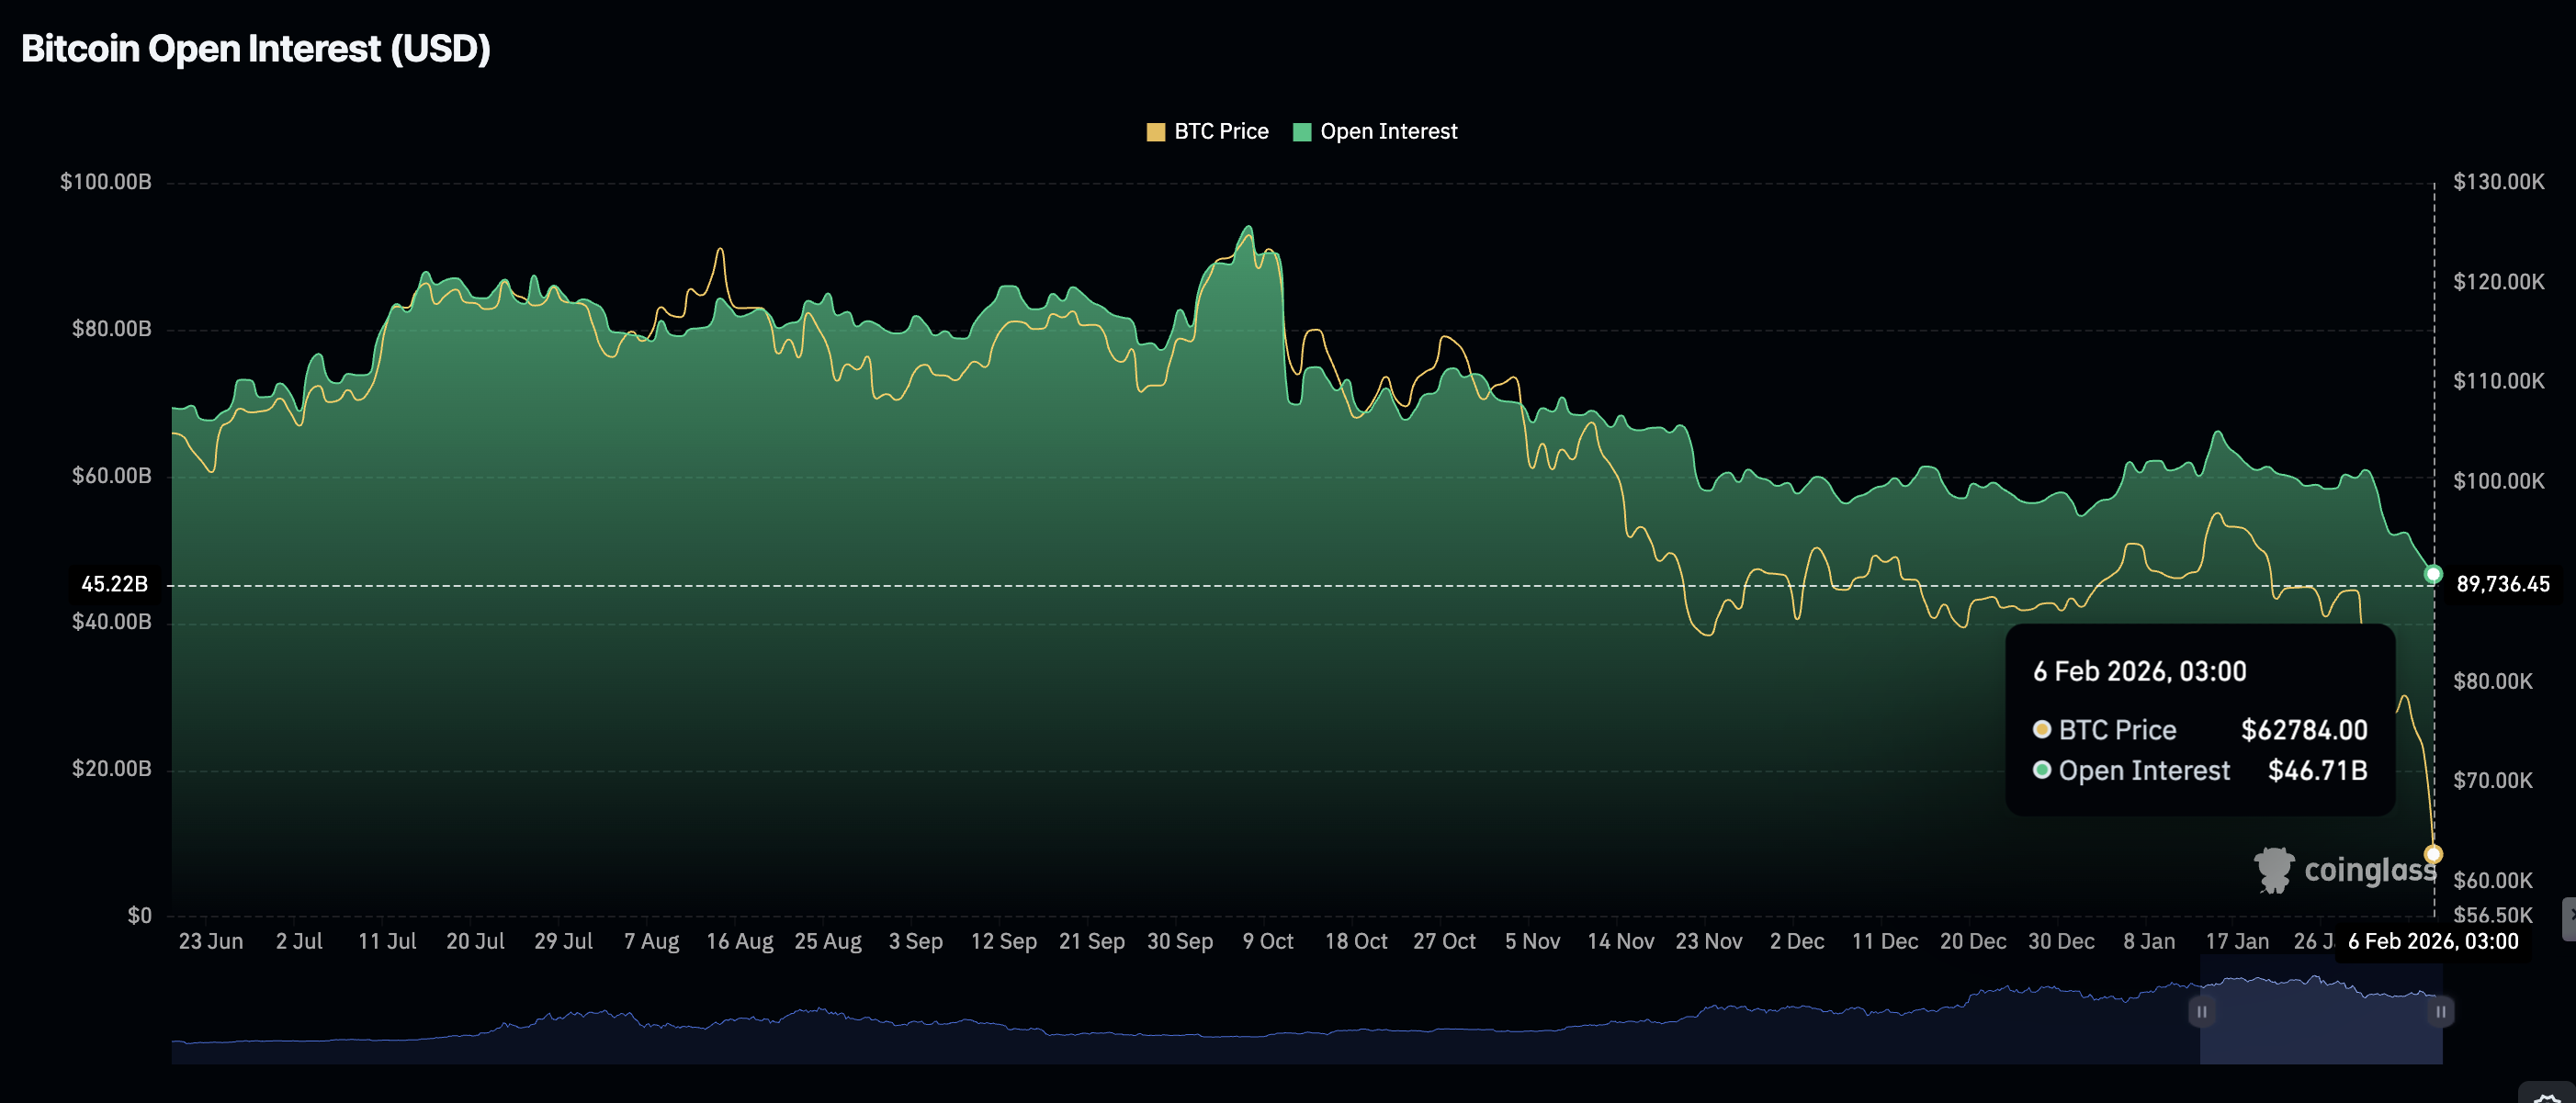
Bitcoin futures Open Interest (OI) extends its downtrend to approximately $47 billion, for the first time since mid-March, as retail investors aggressively closed open positions. The OI averaged $48.5 billion on Thursday, emphasizing the overextended price correction. If sentiment fails to improve, traders may refrain from increasing risk exposure, reducing the much-needed buying pressure to sustain an uptrend.
Similarly, the XRP derivatives market weakened further, as futures OI drops to $2.4 billion on Friday, for the first time in a year, from $2.57 billion the previous day. OI represents the notional value of outstanding futures contracts; hence, a persistent decline suggests that investors lack confidence in XRP’s ability to sustain an uptrend.
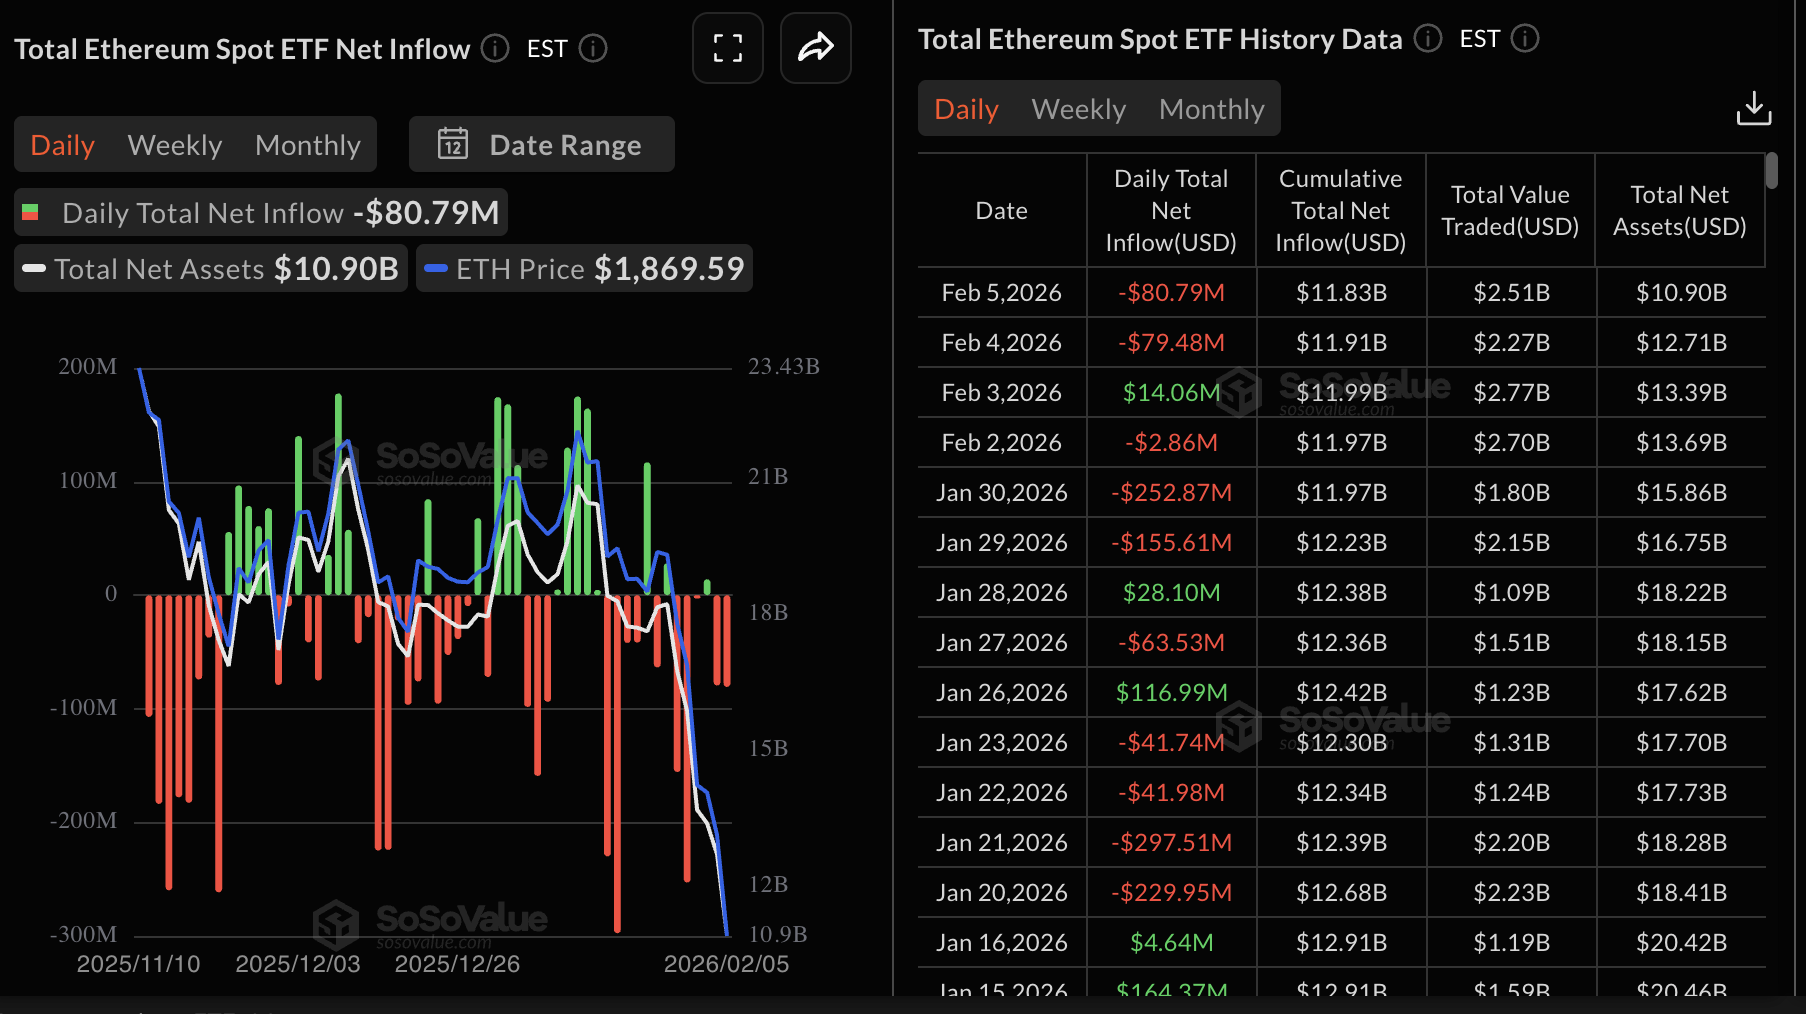
Ethereum, on the other hand, saw increased outflows from spot Exchange-Traded Funds (ETFs). According to SoSoValue data, institutional investors withdrew nearly $81 million on Thursday, marking the second consecutive day of outflows. As a result, cumulative inflows have declined to $11.83 billion, while net assets under management stand at $10.9 billion.
Meanwhile, XRP ETFs recorded modest inflows of $1.28 million on Thursday, down from $ 4.8 million the previous day. Although minor, this marks three consecutive days of inflows, bringing cumulative inflows to $1.21 billion and net assets under management to approximately $888 million.
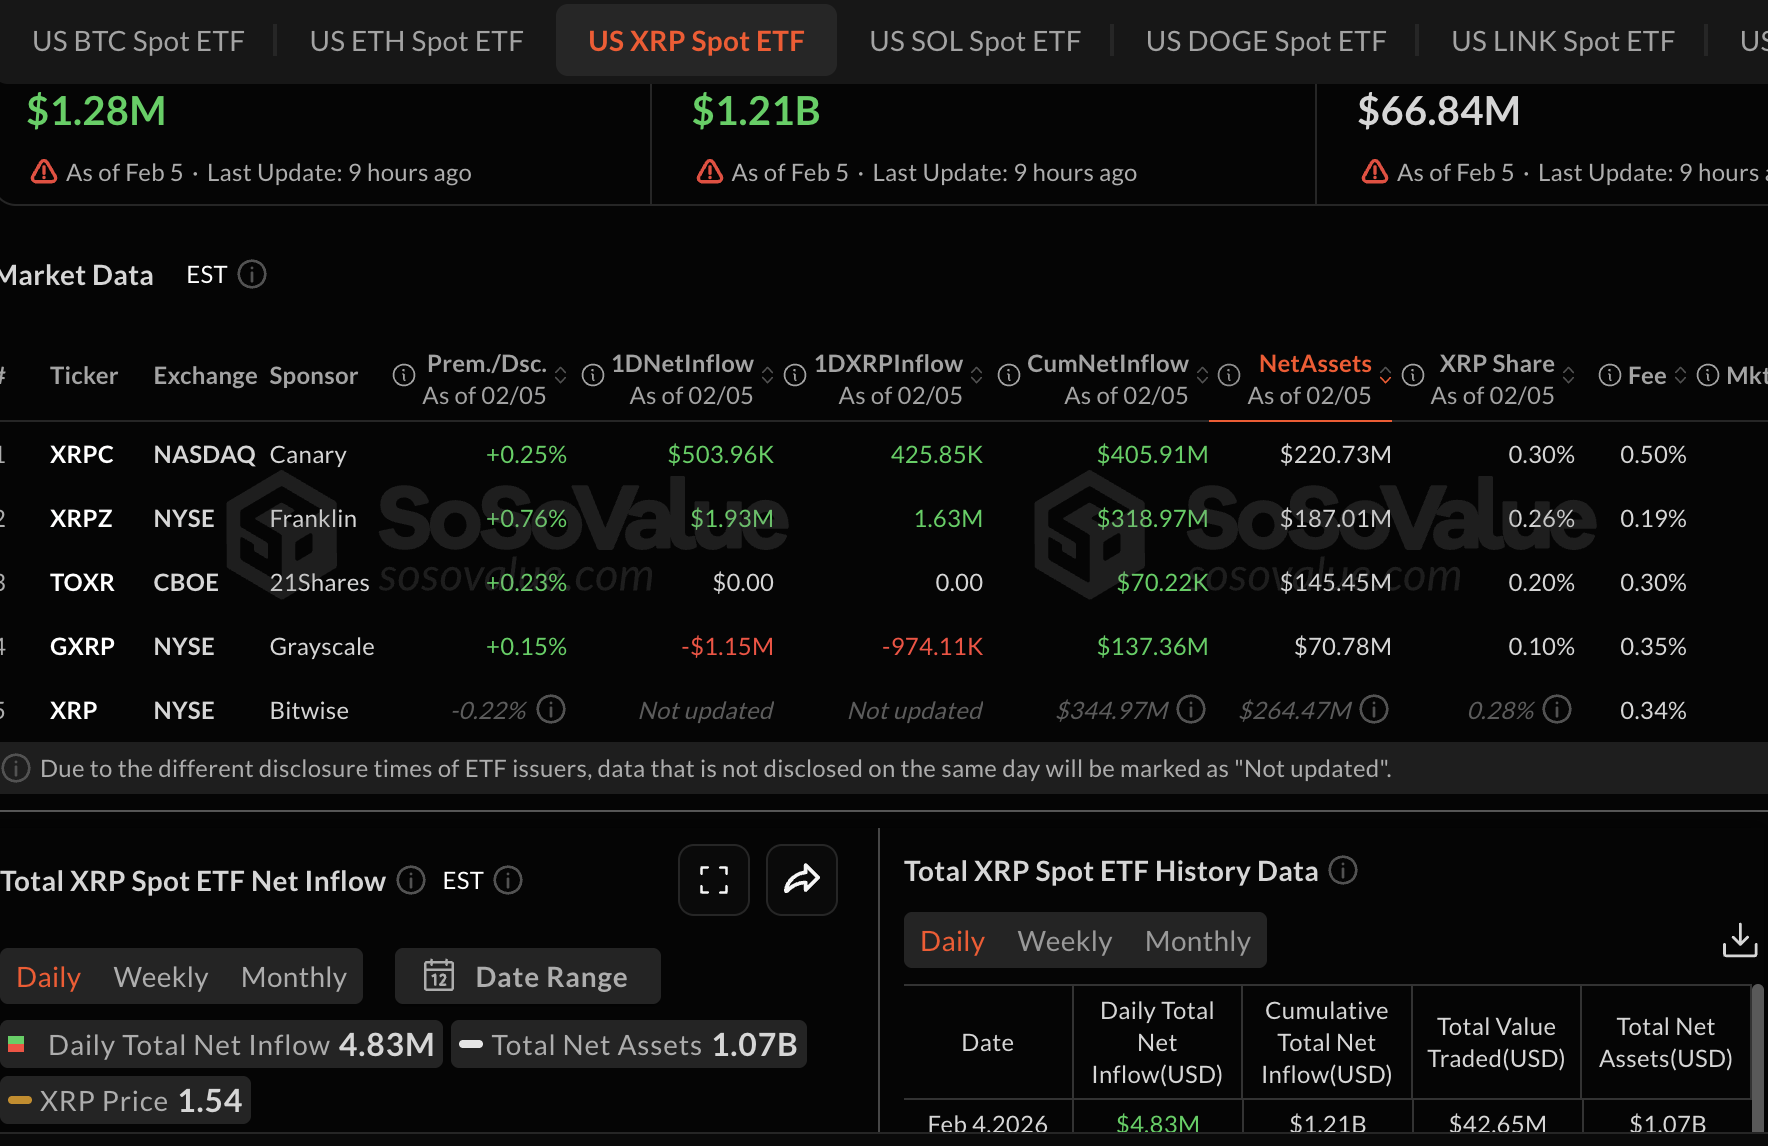
Chart of the day: Can Bitcoin sustain its recovery?
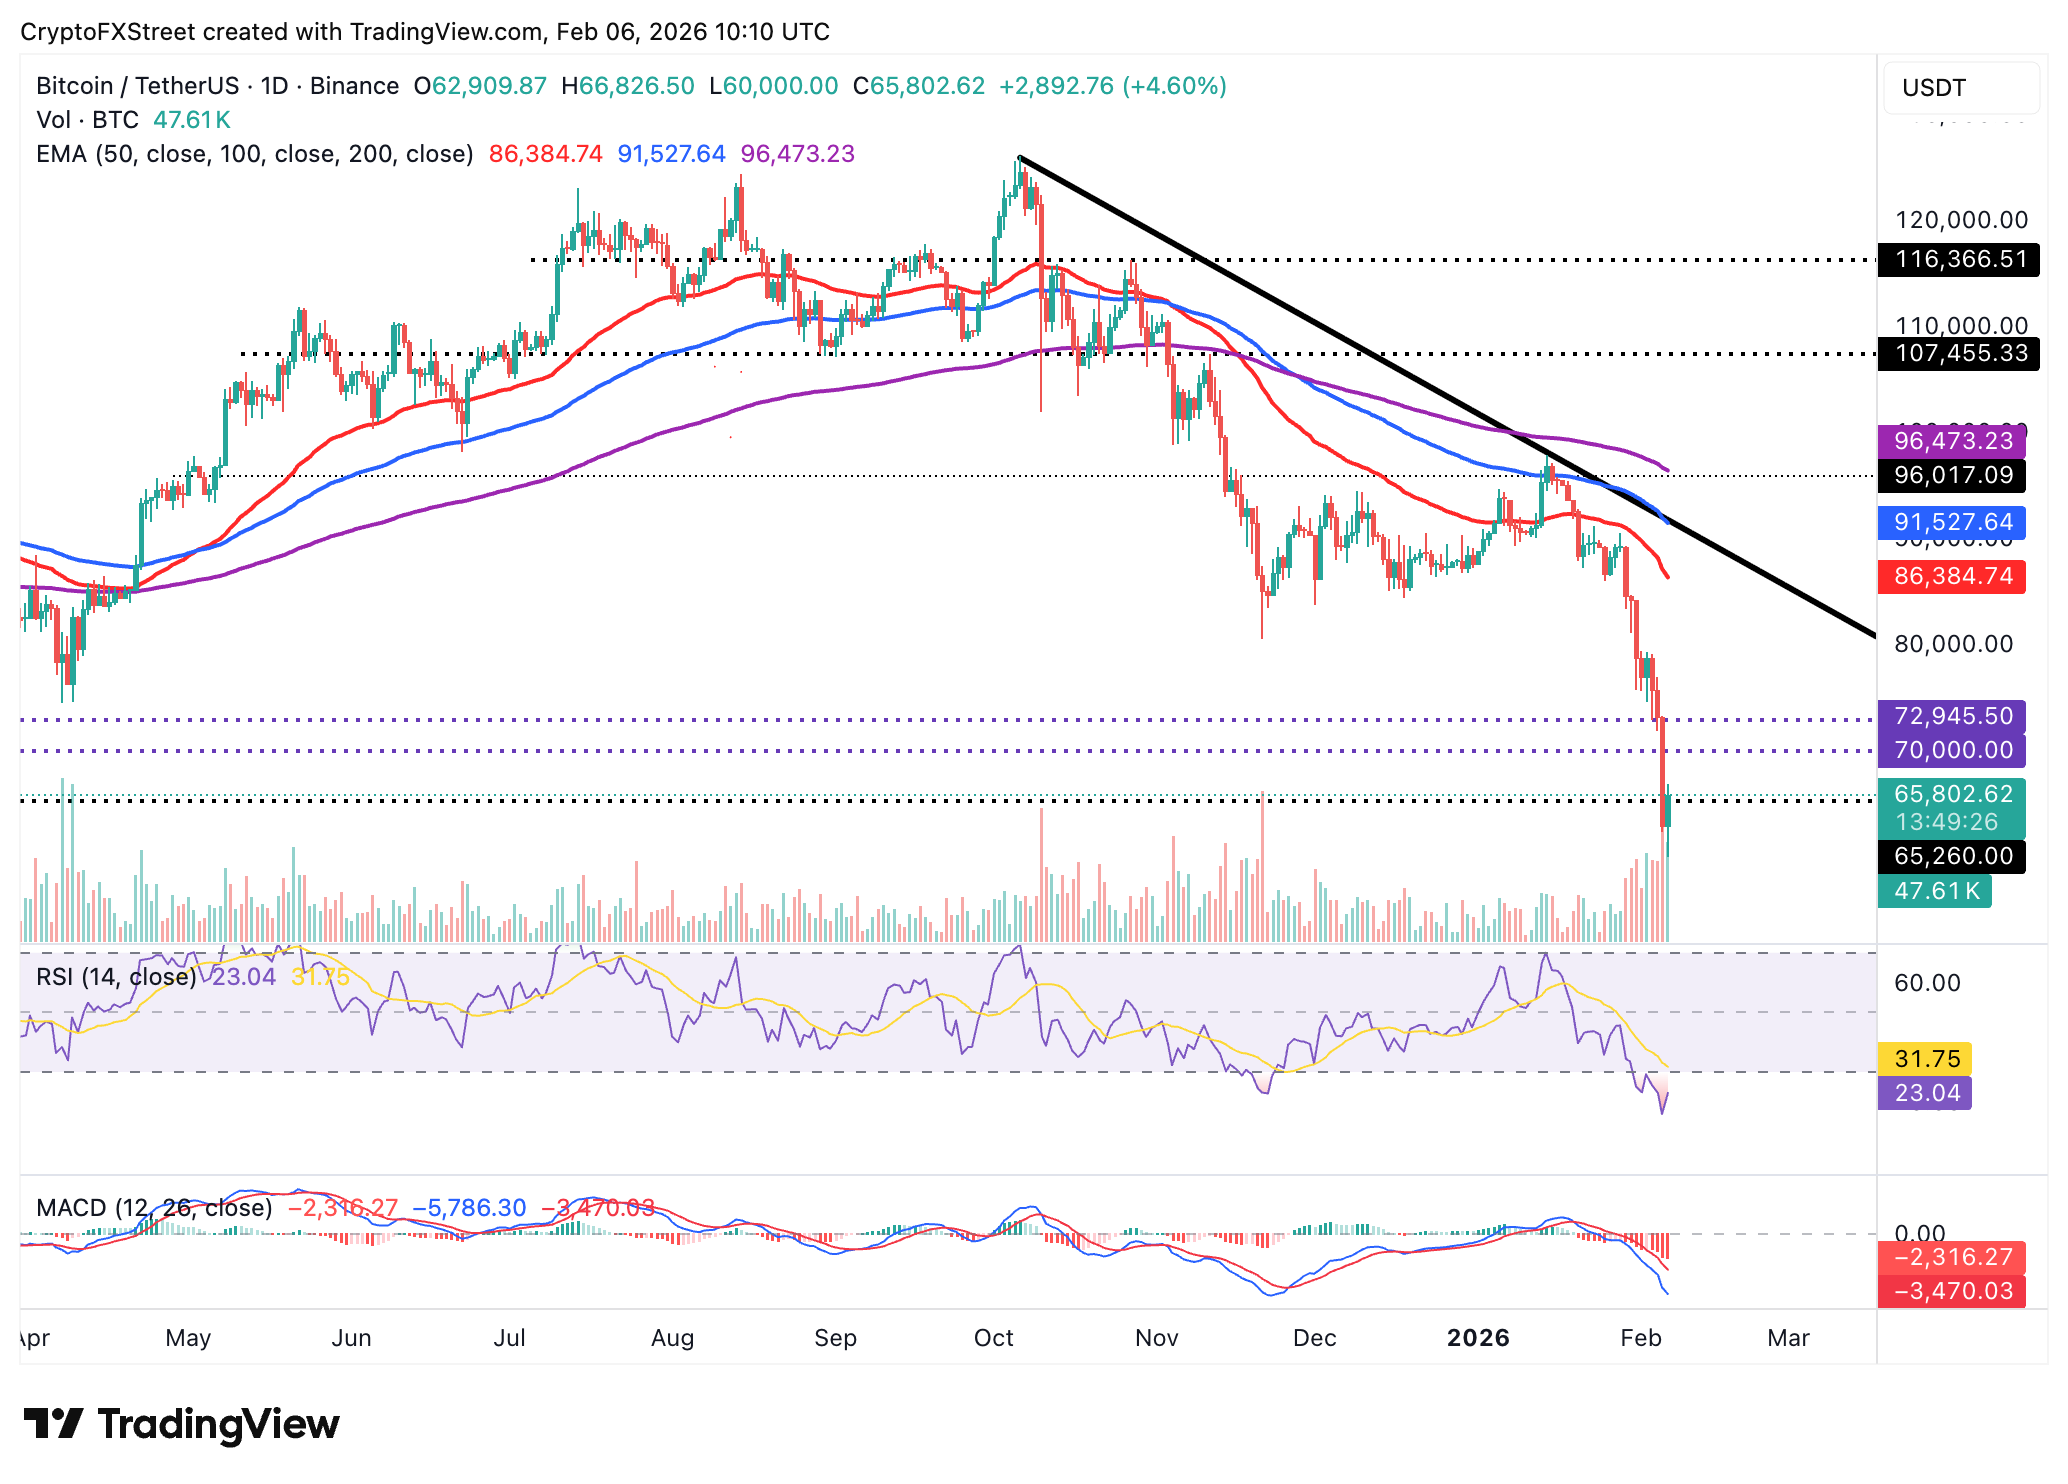
Bitcoin has bounced from the $60,000 intraday low and is currently trading above $65,000 at the time of writing on Friday. The Relative Strength Index (RSI) at 23 on the daily chart points upward, suggesting bearish momentum may be easing, opening the door to an extended rebound.
Meanwhile, the Moving Average Convergence Divergence (MACD) indicator remains overextended below its signal line, confirming the overall bearish outlook.
Still, traders should be on the lookout for the red histogram bars contracting, which may boost bullish bets and lead to a lasting recovery. Key milestones include the supply zone at $70,000 on the upside, but if volatility spikes, the $60,000 level on the downside.
Altcoins technical outlook: Ethereum, XRP poised to tighten grip
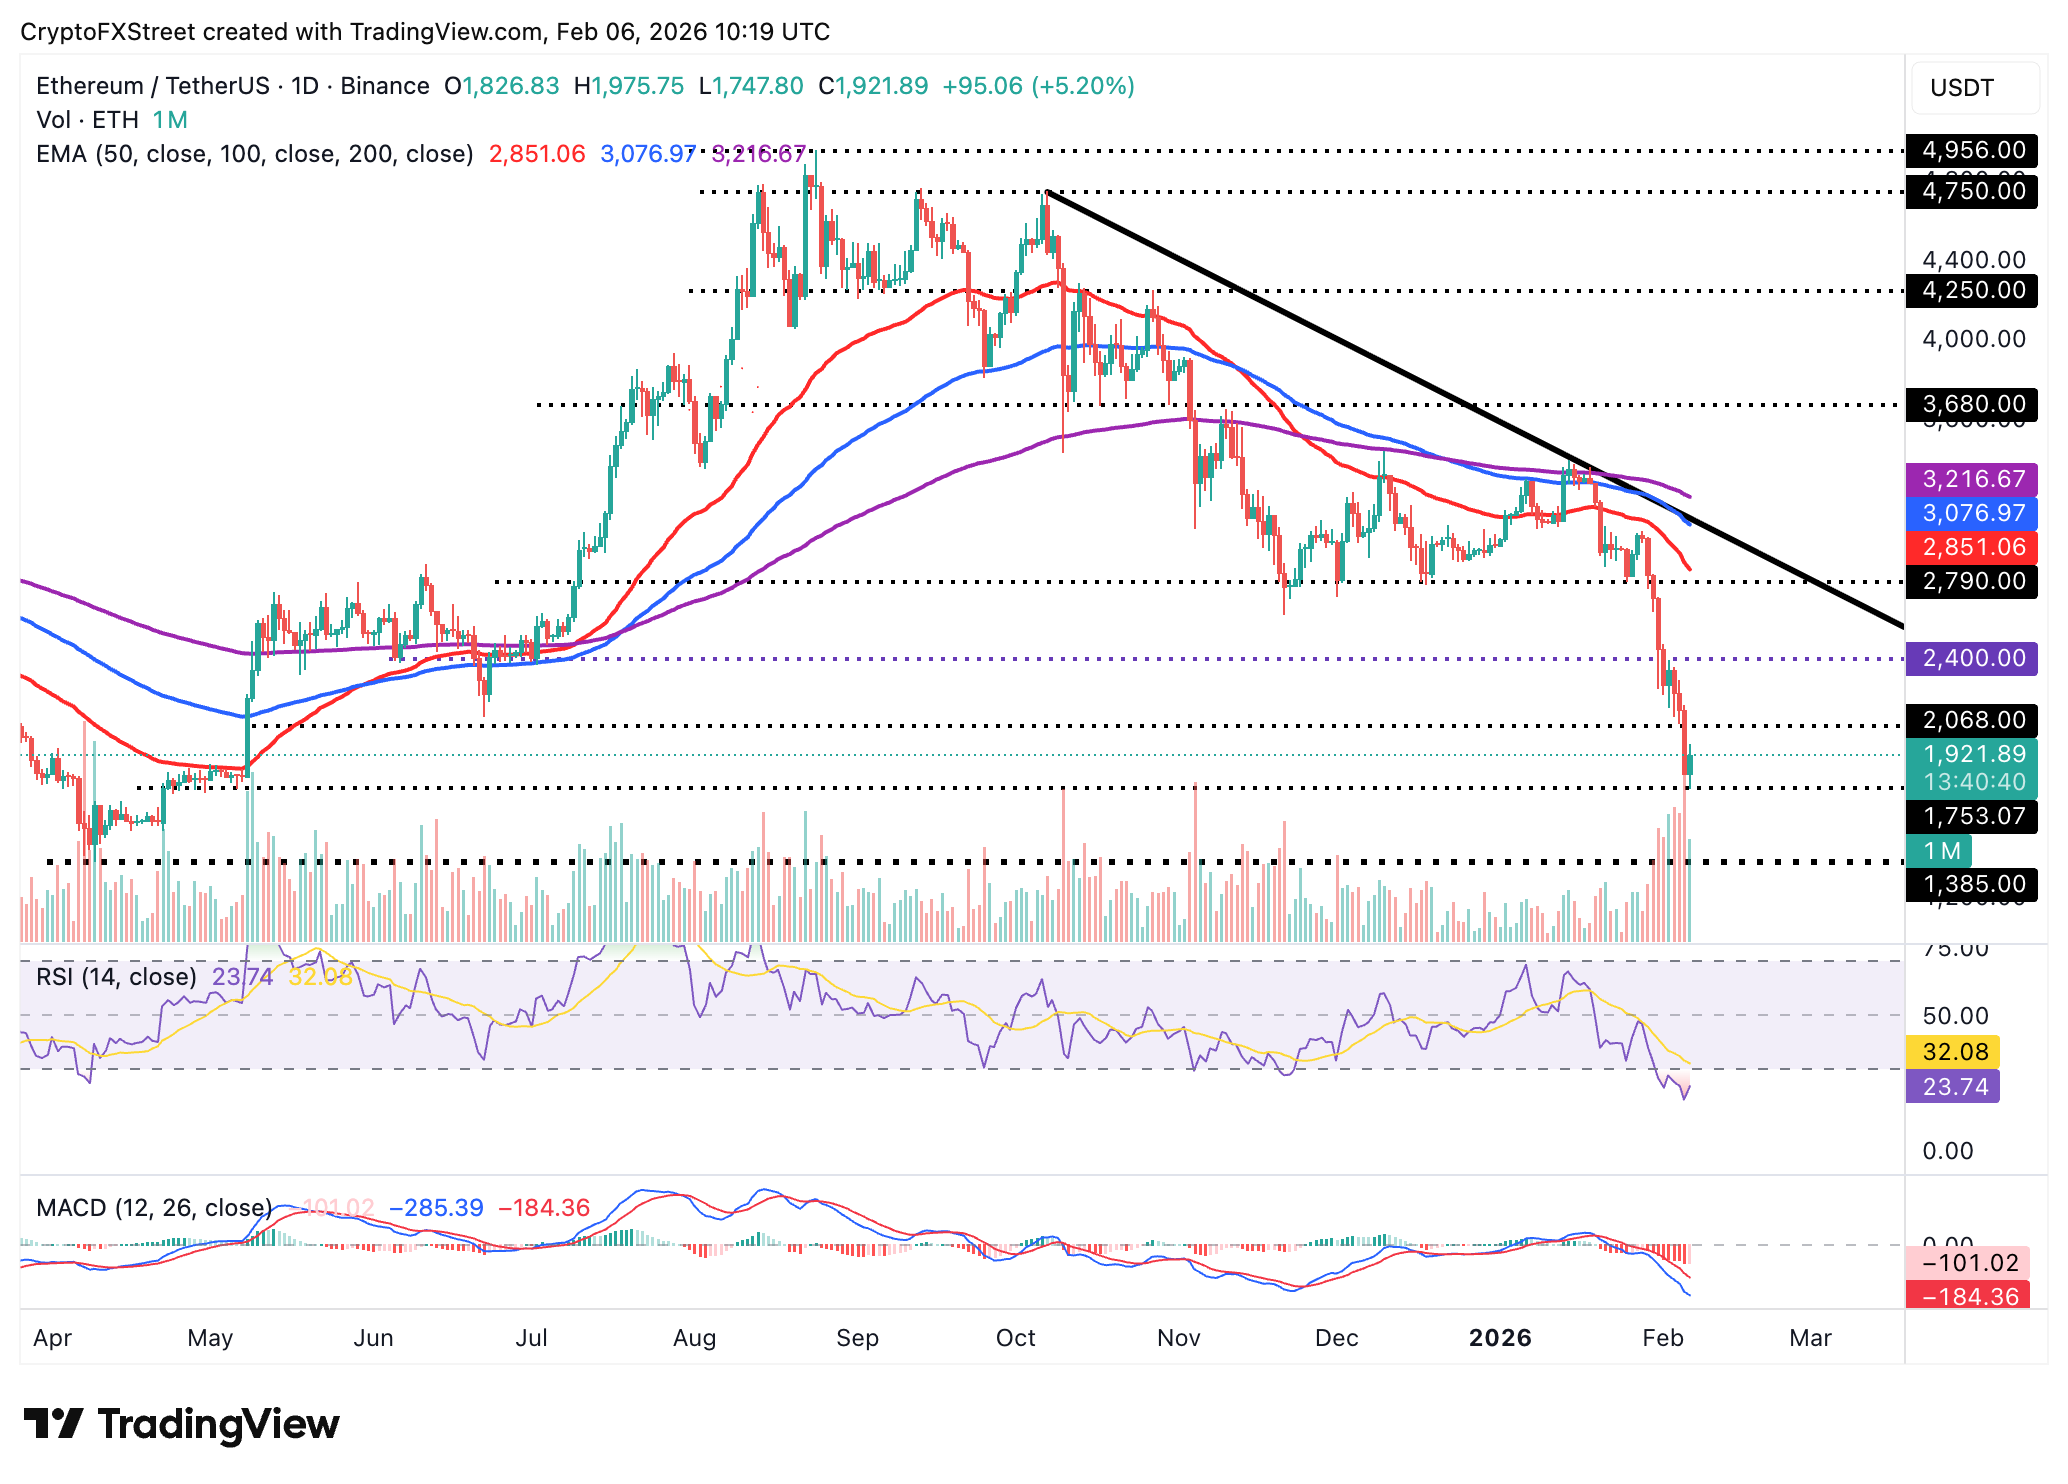
Ethereum rises above $1,900, signaling growing investor interest amid the crash. The leading smart contracts token by market capitalization has the RSI rising to 24 on the daily chart. A further increase in the RSI would boost Ethereum’s recovery potential above the next key resistance at $2,000.
However, since the MACD indicator sits below the signal line on the same chart, bearish momentum remains apparent and may cap gains. The red histogram bars should continue to contract, encouraging investors to lean into risk and support Ethereum’s recovery outlook.
Overall, the dominant momentum is bearish as shown by the downtrending 50-day Exponential Moving Average (EMA) at $2,851, the 100-day EMA at $3,077 and the 200-day EMA at $3,217. Therefore, traders should not lose sight of the intraday low at $1,748, which is poised to provide support and prevent losses toward the April 9 low at $1,385.
As for XRP, bulls continue to push the price above $1.35, supported by the RSI, which is rising to 28 in oversold territory. This knee-jerk recovery follows an intraday low tested at $1.12, relieving battered traders from losses incurred during Thursday’s aggressive sell-off from $1.51.
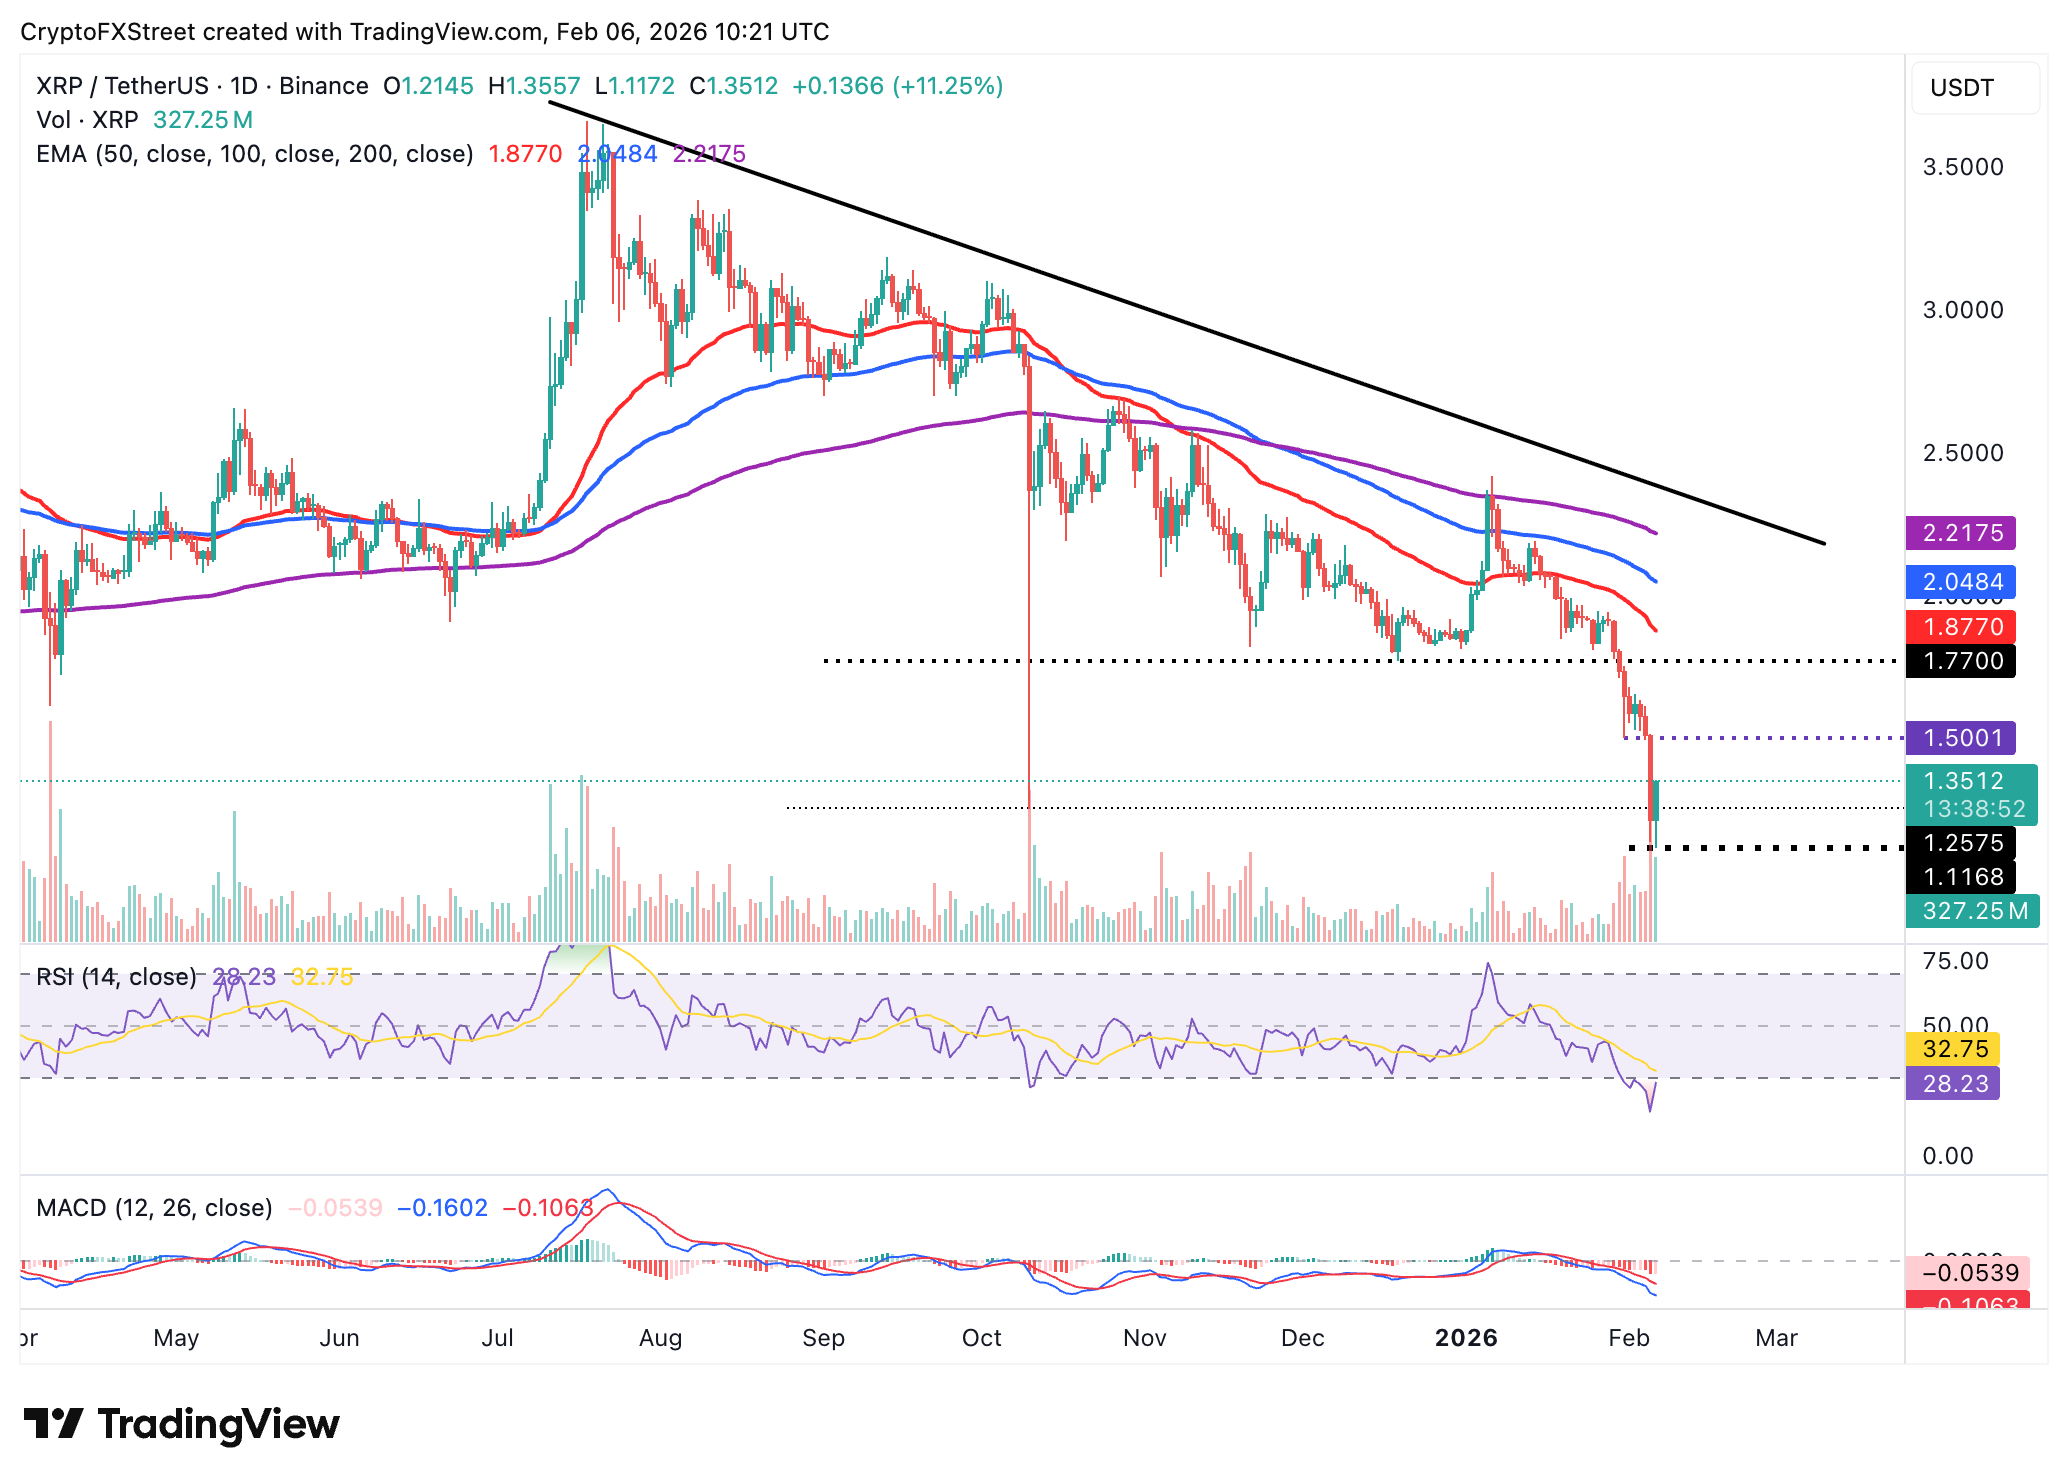
Despite the intraday gains, the MACD indicator remains bearish below its signal line. A bullish crossover of the blue MACD line above the red signal line would reinforce the bullish grip. A reversal above $1.51 would erase Thursday’s drawdown and set XRP on a recovery path toward $1.77 and the $2.00 round level.
Open Interest, funding rate FAQs
Higher Open Interest is associated with higher liquidity and new capital inflow to the market. This is considered the equivalent of increase in efficiency and the ongoing trend continues. When Open Interest decreases, it is considered a sign of liquidation in the market, investors are leaving and the overall demand for an asset is on a decline, fueling a bearish sentiment among investors.
Funding fees bridge the difference between spot prices and prices of futures contracts of an asset by increasing liquidation risks faced by traders. A consistently high and positive funding rate implies there is a bullish sentiment among market participants and there is an expectation of a price hike. A consistently negative funding rate for an asset implies a bearish sentiment, indicating that traders expect the cryptocurrency’s price to fall and a bearish trend reversal is likely to occur.
Recommended Articles


