


Bitcoin price is range-bound, but retrace below $60K seems likely
- Bitcoin price is trading within a range with expectations of a sideways weekend before eventful week starting Monday.
- Hong Kong BTC and ETH ETFs to start trading on Monday before Fed meeting next week.
- In past cycles, BTC has dropped 20% to 25% as part of immediate post-halving correction.
- A 20% drop from $73,777K ATH would see BTC price dip into liquidity pool between $60,600 and $59,200.
Bitcoin (BTC) price action has been rather range-bound over the past few weeks, capped between the $73,777 all-time high and the $59,005 intraday day low recorded during the March 5 trading session. With a market that is currently devoid of a catalyst, chances are that we could see a sideways weekend.
Also Read: Bitcoin Weekly Forecast: BTC’s next breakout could propel it to $80,000
Daily digest market movers: Market devoid of catalyst as low-hanging liquidity draws Bitcoin toward $60K
Bitcoin price continues to consolidate just above the $63,500 threshold. A look at the volume profile shows that at the current price, both bullish and bearish activity are not as pronounced or spiking. This is relative to the areas above and below, meaning not many bulls or bears are buying or selling at current price levels.
It is likely that the markets will witness a sideways consolidation through the weekend and into the new week. Volatility could resume on Monday, when Hong Kong exchange-traded funds (ETFs) for BTC and ETH are expected to hit the market. This could be the catalyst that kicks off the next rally.
Usually what happens when the market looks like this is…
— Kyle Chassé (@kyle_chasse) April 26, 2024
Also, the next Federal Open Market Committee (FOMC) meeting, slated for Tuesday, April 30 and Wednesday, May 1, could move markets. This will be an important event for the overall market, with implications for the cryptocurrency industry.
Nevertheless, even as the market continues to lean in favor of the downside, it is not surprising considering historically, Bitcoin price has dropped between 20% and 25% from its peak as part of a post-halving correction.
- .
— Ted (@TedPillows) April 26, 2024
Historically, #BTC has dropped 20%–25% from its peak during halving.
A 20% drop from $74k would be at $59,200, which BTC recently hit.
A 25% drop would put #Bitcoin at $56k, which is a… pic.twitter.com/vy4Ri74A33
If history rhymes or repeats, the 20% dip could see the Bitcoin price dip into the liquidity pool that extends from $60,600 to $59,200. @TedPillows on X says this could be a shakeout to rid the market of weak hands.
Technical analysis: Bitcoin price could drop below $60,000 before next leg up
Bitcoin price downside momentum is likely to continue with bearish activity still hovering right above the current price. This coupled with the overall pull of the liquidity pool on Bitcoin price could see the market slide lower.
The Relative Strength Index (RSI) remains below the mean level of 50, a stance worsened by the Moving Average Convergence Divergence (MACD) that remains in negative territory. A crossover of the MACD below the signal line, reinforced by a lower low on the RSI could precipitate an extended fall for BTC price. This could send Bitcoin price into the liquidity pool before a possible recovery.
Based on the volume profiles on the 12-hour chart below, bulls are also waiting to interact with BTC near the $52,000 level, shown by the large spikes of the yellow nodes.
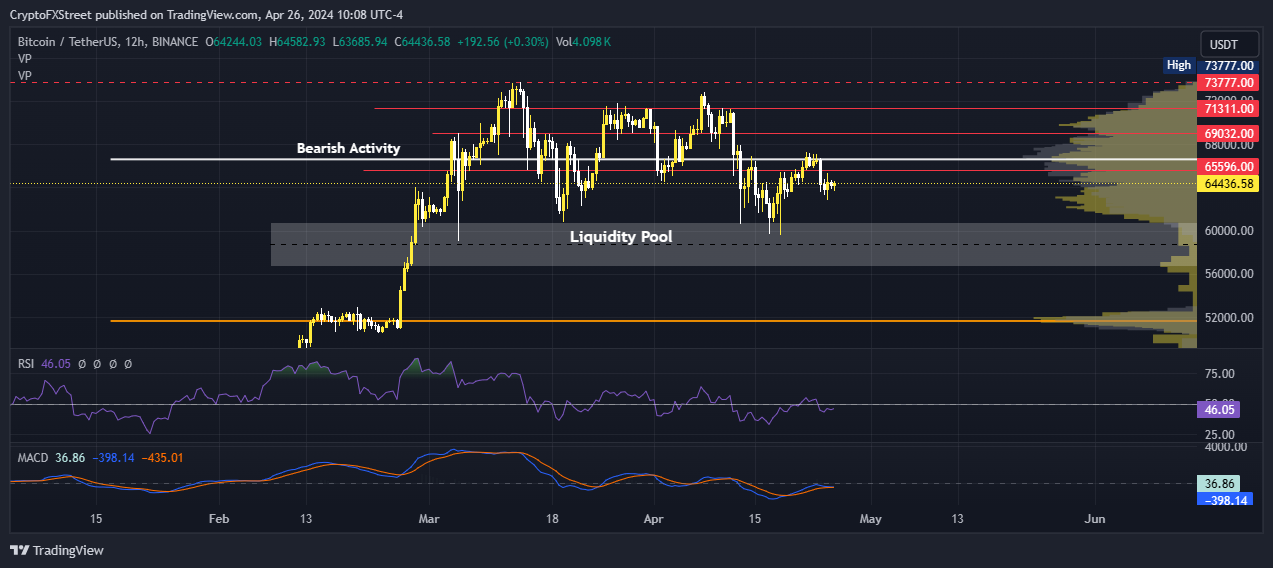
BTC/USDT 12-hour chart
On the other hand, if the $62,000 range holds as support, with a lot of bullish activity also seen here (yellow spikes), Bitcoin price could recover. Key levels to watch in a northbound directional bias would be $65,596, above which BTC bulls would have to confront the $69,032 and $71,311 levels for a chance to reclaim the $73,777 all-time high (ATH).
A decisive candlestick close above $69,032 in the 12-hour time frame would invalidate the bearish thesis. In a highly bullish case where the pioneer cryptocurrency clears its ATH, markets could see a new peak near $80,000.
Read More: Bitcoin price drop extends as SEC delays decision and opens comment period on options trading on spot BTC ETFs
Bitcoin, altcoins, stablecoins FAQs
Bitcoin is the largest cryptocurrency by market capitalization, a virtual currency designed to serve as money. This form of payment cannot be controlled by any one person, group, or entity, which eliminates the need for third-party participation during financial transactions.
Altcoins are any cryptocurrency apart from Bitcoin, but some also regard Ethereum as a non-altcoin because it is from these two cryptocurrencies that forking happens. If this is true, then Litecoin is the first altcoin, forked from the Bitcoin protocol and, therefore, an “improved” version of it.
Stablecoins are cryptocurrencies designed to have a stable price, with their value backed by a reserve of the asset it represents. To achieve this, the value of any one stablecoin is pegged to a commodity or financial instrument, such as the US Dollar (USD), with its supply regulated by an algorithm or demand. The main goal of stablecoins is to provide an on/off-ramp for investors willing to trade and invest in cryptocurrencies. Stablecoins also allow investors to store value since cryptocurrencies, in general, are subject to volatility.
Bitcoin dominance is the ratio of Bitcoin's market capitalization to the total market capitalization of all cryptocurrencies combined. It provides a clear picture of Bitcoin’s interest among investors. A high BTC dominance typically happens before and during a bull run, in which investors resort to investing in relatively stable and high market capitalization cryptocurrency like Bitcoin. A drop in BTC dominance usually means that investors are moving their capital and/or profits to altcoins in a quest for higher returns, which usually triggers an explosion of altcoin rallies.
Recommended Articles


