


Sentient (SENT) Defies a Market Sell-Off With 60% Gains — 3 Metrics Explain How
Sentient (SENT) is moving against the market. While the broader crypto market is down nearly 5%, the Sentient price is up more than 60% at press time. That headline move hides an important detail. The SENT token price also fell nearly 18% after touching $0.044, before rebounding again.
That combination matters. It shows Sentient is volatile, but also resilient. Very few new tokens manage to recover that quickly in a weak market. Three clear metrics explain why Sentient is still holding gains, and what risks remain from here.
Bitcoin Weakness Is Helping Sentient, and Dip Buyers Are Still Active: Two Helpful Metrics
The first driver is Sentient’s inverse relationship with Bitcoin.
Over the past few days, Sentient has shown a −0.92 correlation with Bitcoin. Correlation measures how two assets move together. A negative reading close to −1 means they usually move in opposite directions. As Bitcoin pulled back, Sentient attracted traders looking for assets not tied to BTC weakness.
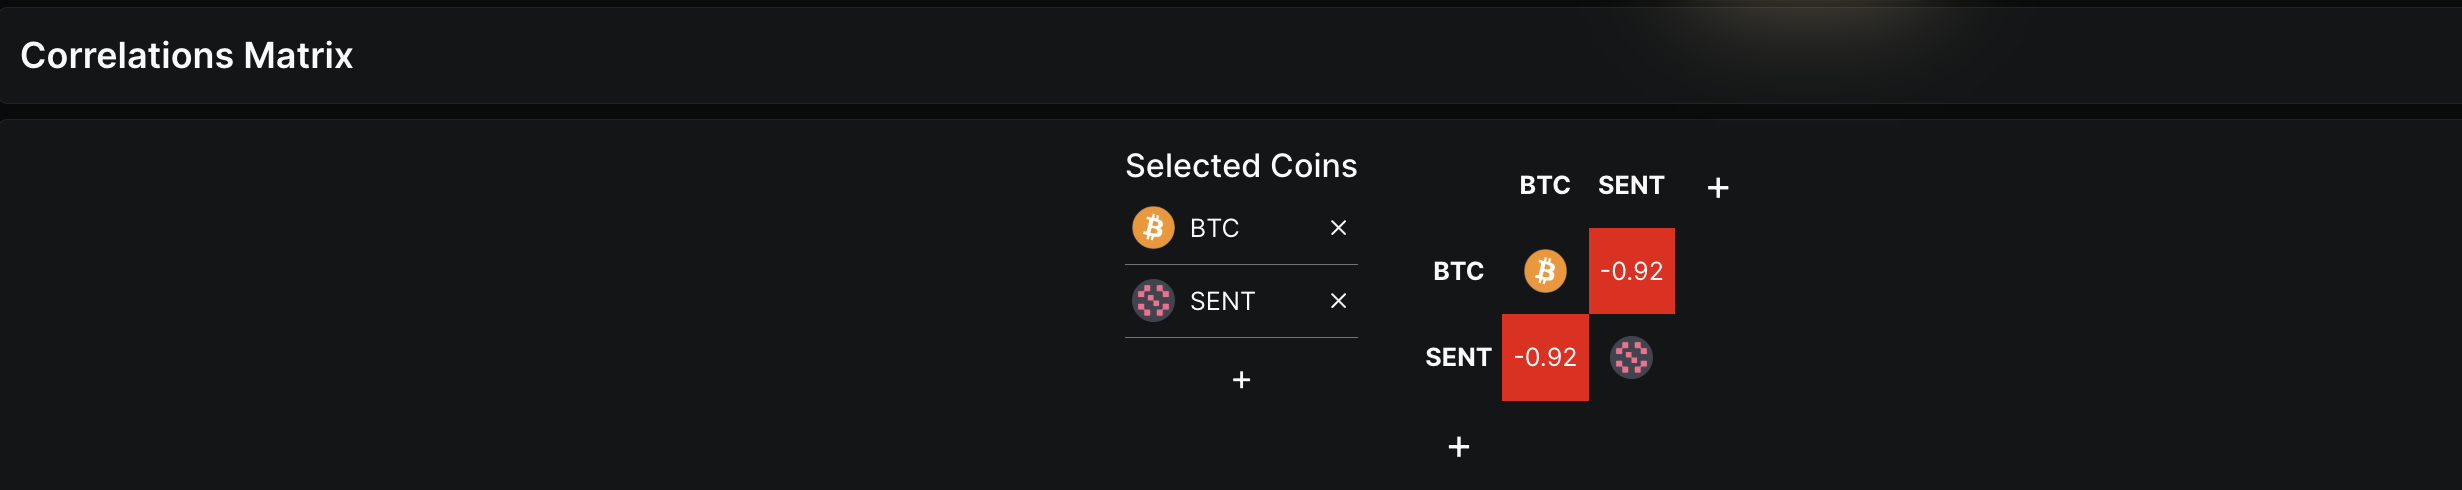 SENT-BTC Correlation: DeFillama
Want more token insights like this? Sign up for Editor Harsh Notariya’s Daily Crypto Newsletter here.
That inverse move encouraged dip buying, which shows up clearly in the technical chart.
The Money Flow Index (MFI) helps explain this behavior. MFI tracks buying and selling pressure using both price and volume. When MFI stays elevated, it suggests buyers are still active even if the price pulls back.
Between January 29 and January 30, Sentient made a higher high, but MFI made a lower high. That bearish divergence explains the roughly 18% drop from the peak. But the key detail is what did not happen. MFI did not collapse. It remains well above the levels seen on January 28 and still above the ascending trendline.
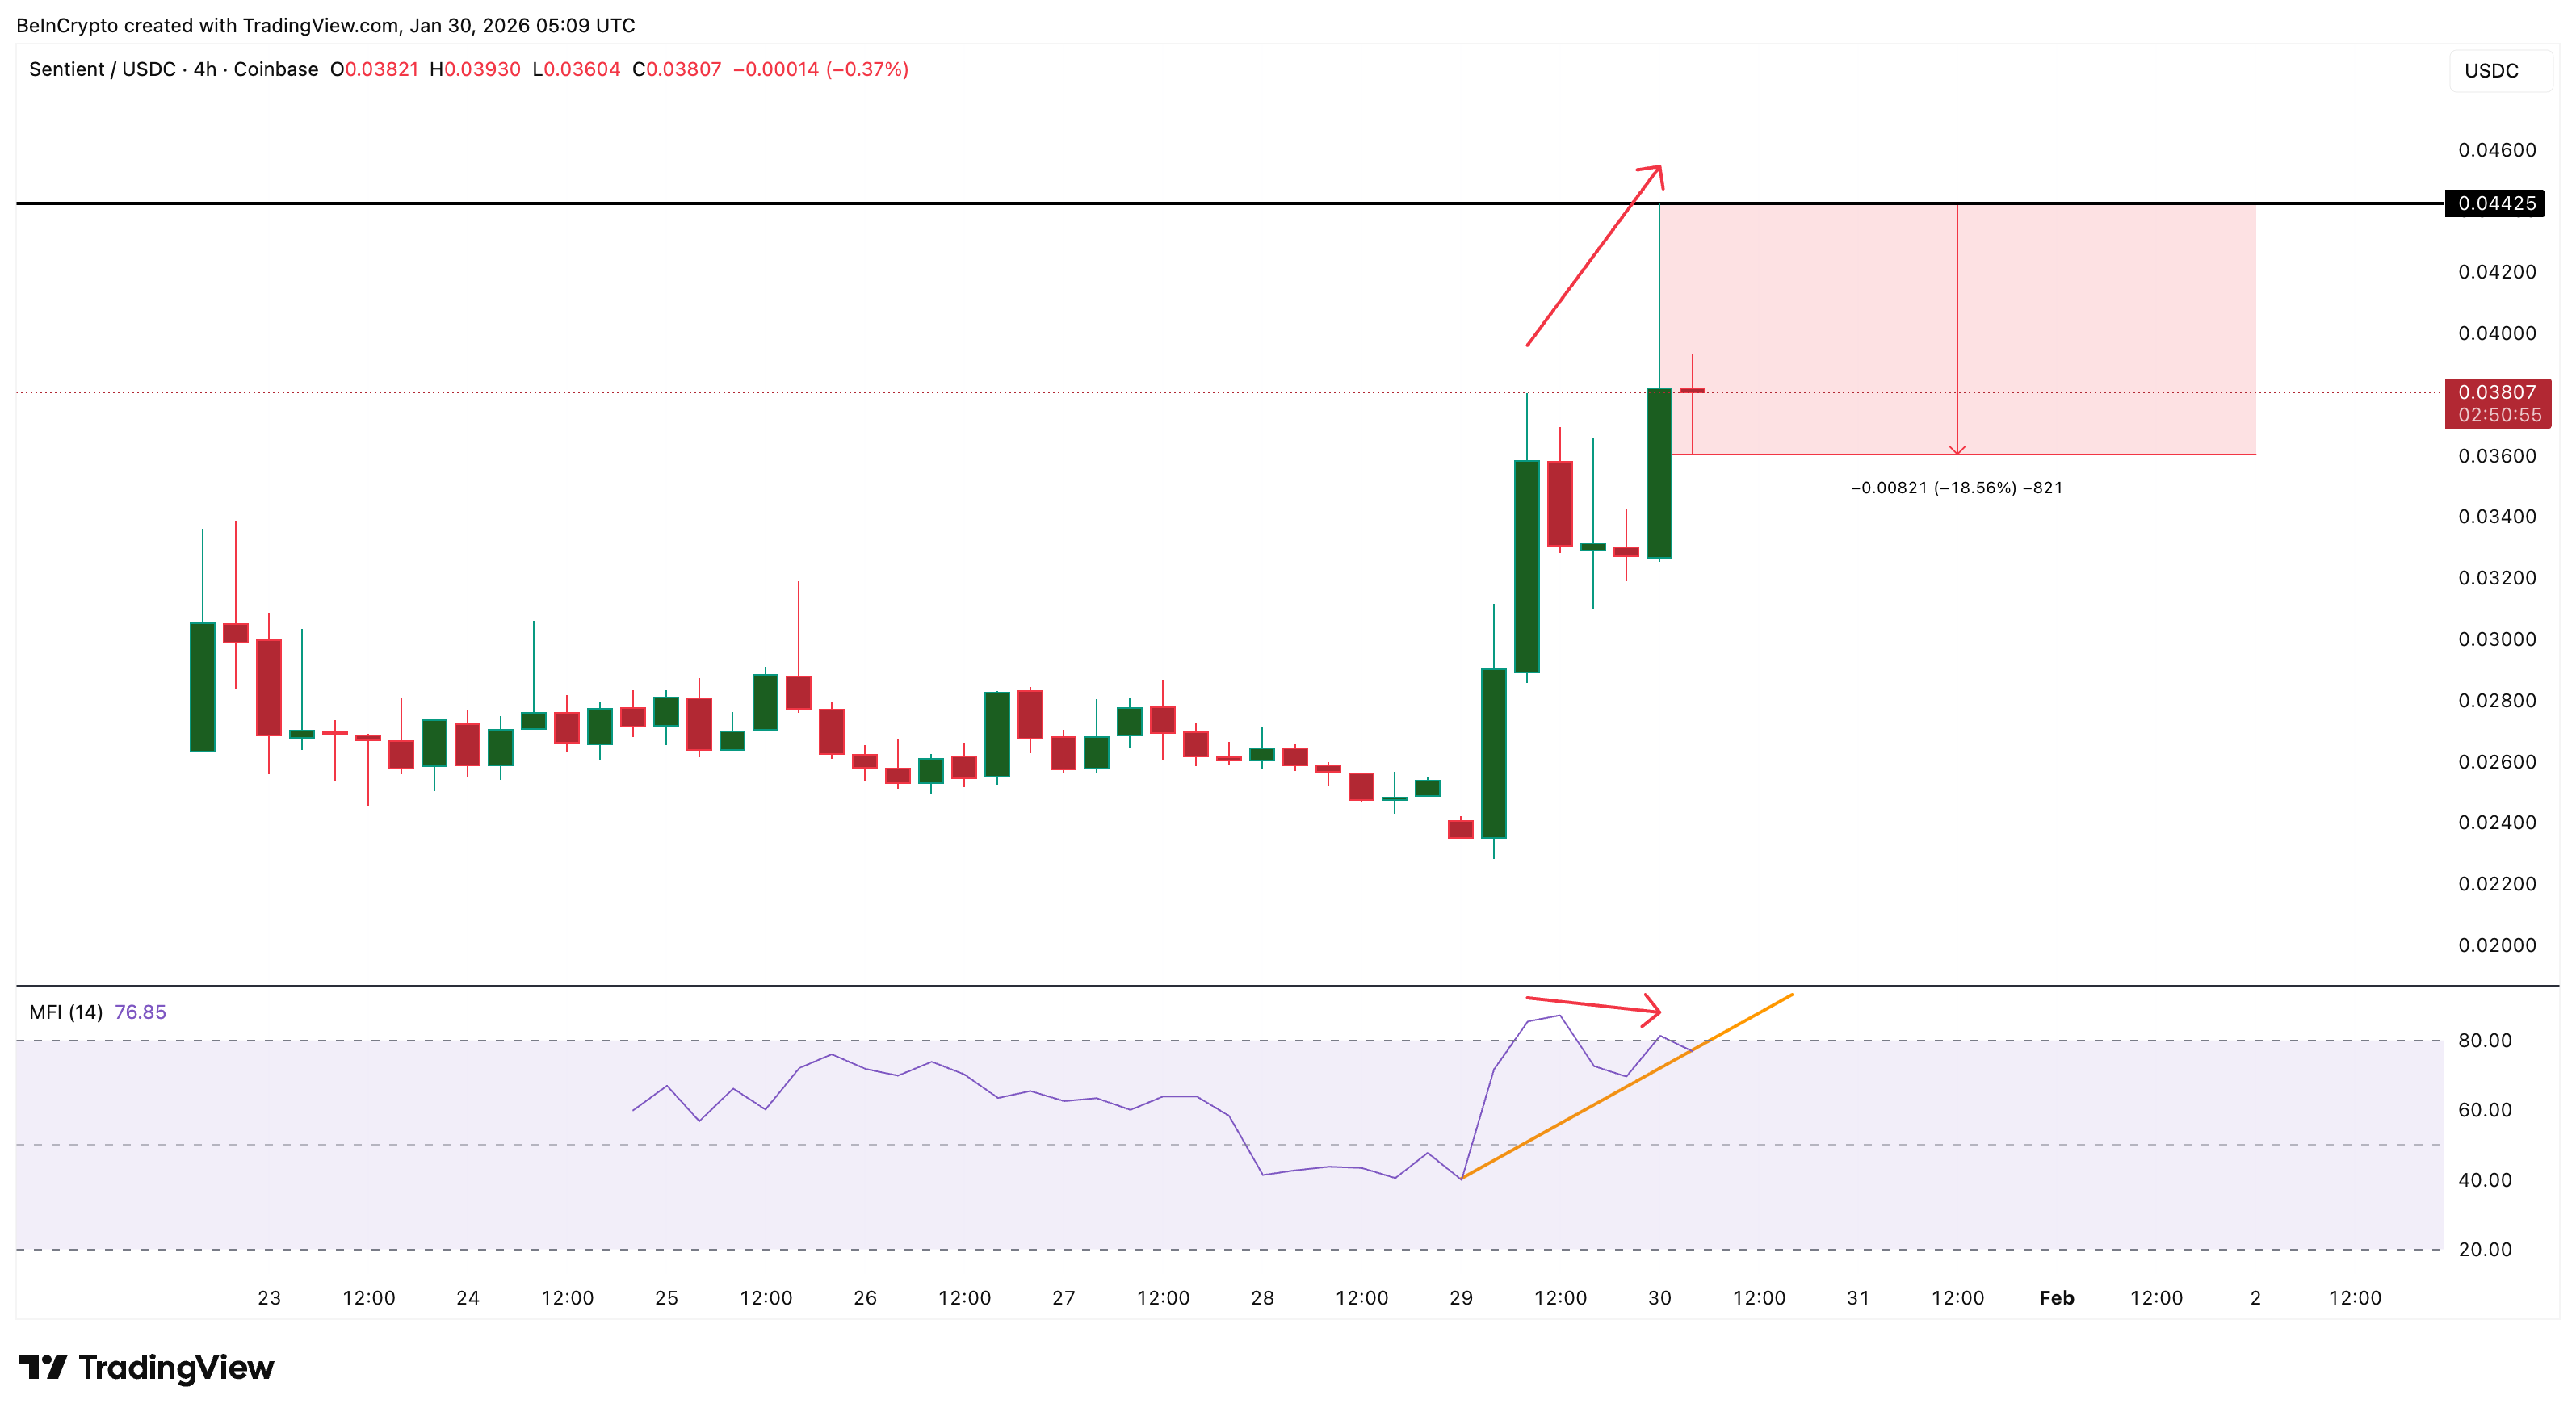 Dip Buying: TradingView
That tells us dip buying is still present. However, if the MFI moves under the trendline with the prices weakening, bigger correction risks might start surfacing.
Spot Buying Has Remained Consistent Despite the Pullback
The third driver is steady spot demand.
Since launch, Sentient’s spot flows have been mostly buyer-driven. Exchange netflows have stayed negative for most sessions, meaning tokens are leaving exchanges rather than being sent in to sell.
There was one clear exception. On January 29, a single green inflow candle showed short-term profit taking. That aligns with the price pullback from the highs. But the behavior since then matters more.
On January 30 alone, Sentient recorded over $4 million in exchange outflows, even though the day is not complete yet. That shows buyers are still willing to accumulate at higher prices.
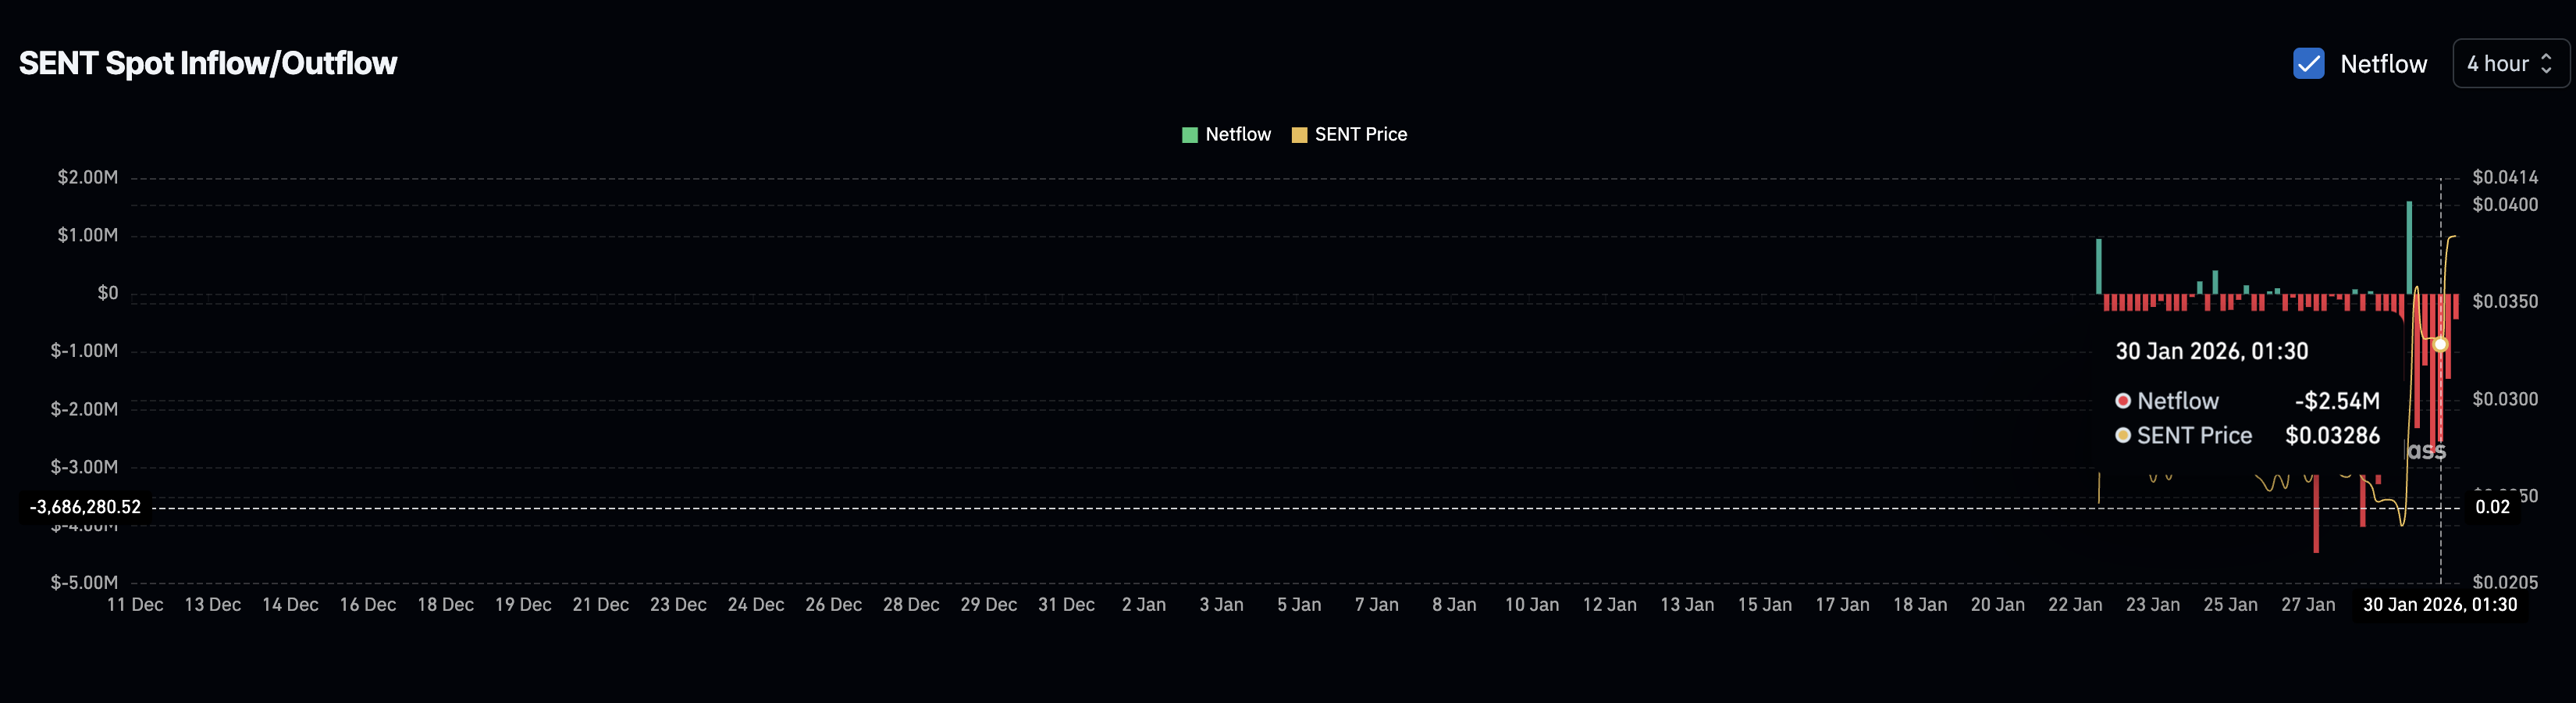 SENT Sees Spot Activity: Coinglass
This demand also appears in the Chaikin Money Flow (CMF). CMF tracks whether larger players are accumulating or distributing. After peaking on January 29, CMF pulled back, but it remains above the zero line.
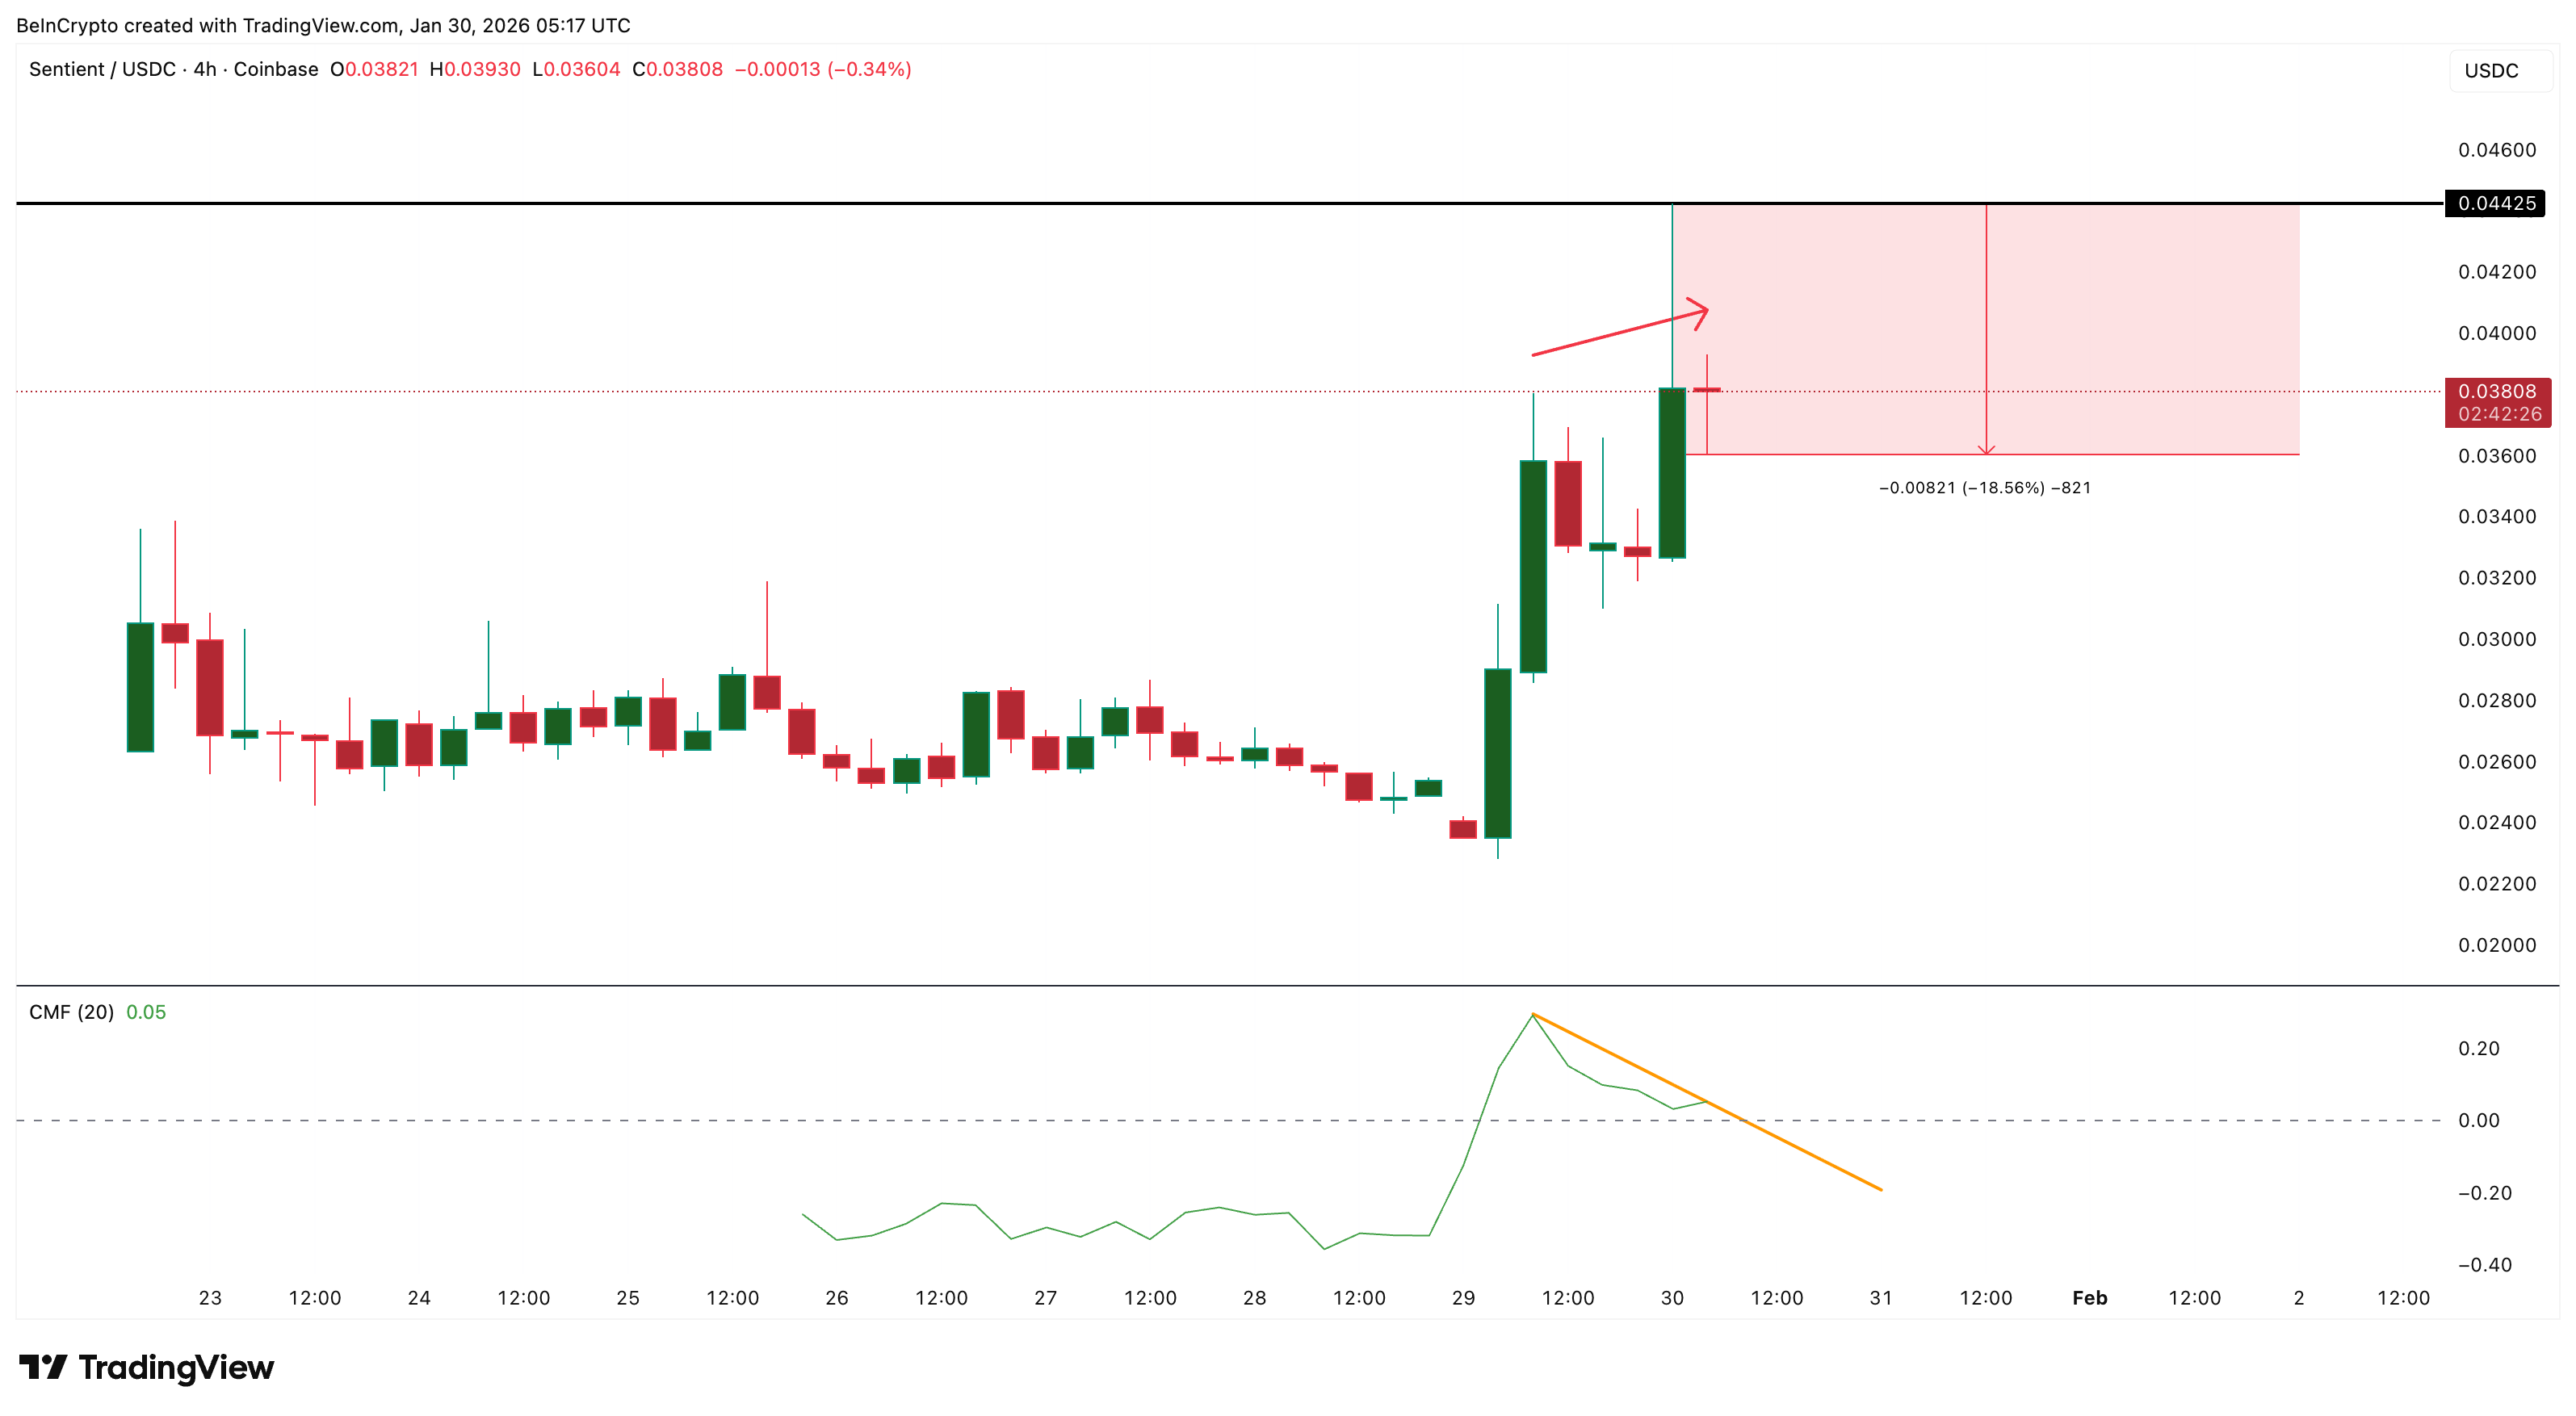 Money Flow Weakens A Bit: TradingView
Staying above zero means buying pressure still outweighs selling pressure. Big buyers have slowed down, but they have not flipped to distribution. This balance explains why Sentient has avoided a deeper sell-off.
Risks Are Rising as Leverage Builds Near Key Sentient Price Levels
The third metric highlights risk rather than strength.
Derivatives positioning on Bybit shows heavy optimism. Long leverage sits near $7.96 million, while short leverage is close to $1.15 million. That means longs outweigh shorts by nearly seven times.
When leverage skews this heavily to one side, even small price drops can trigger forced liquidations. This makes the rally fragile.
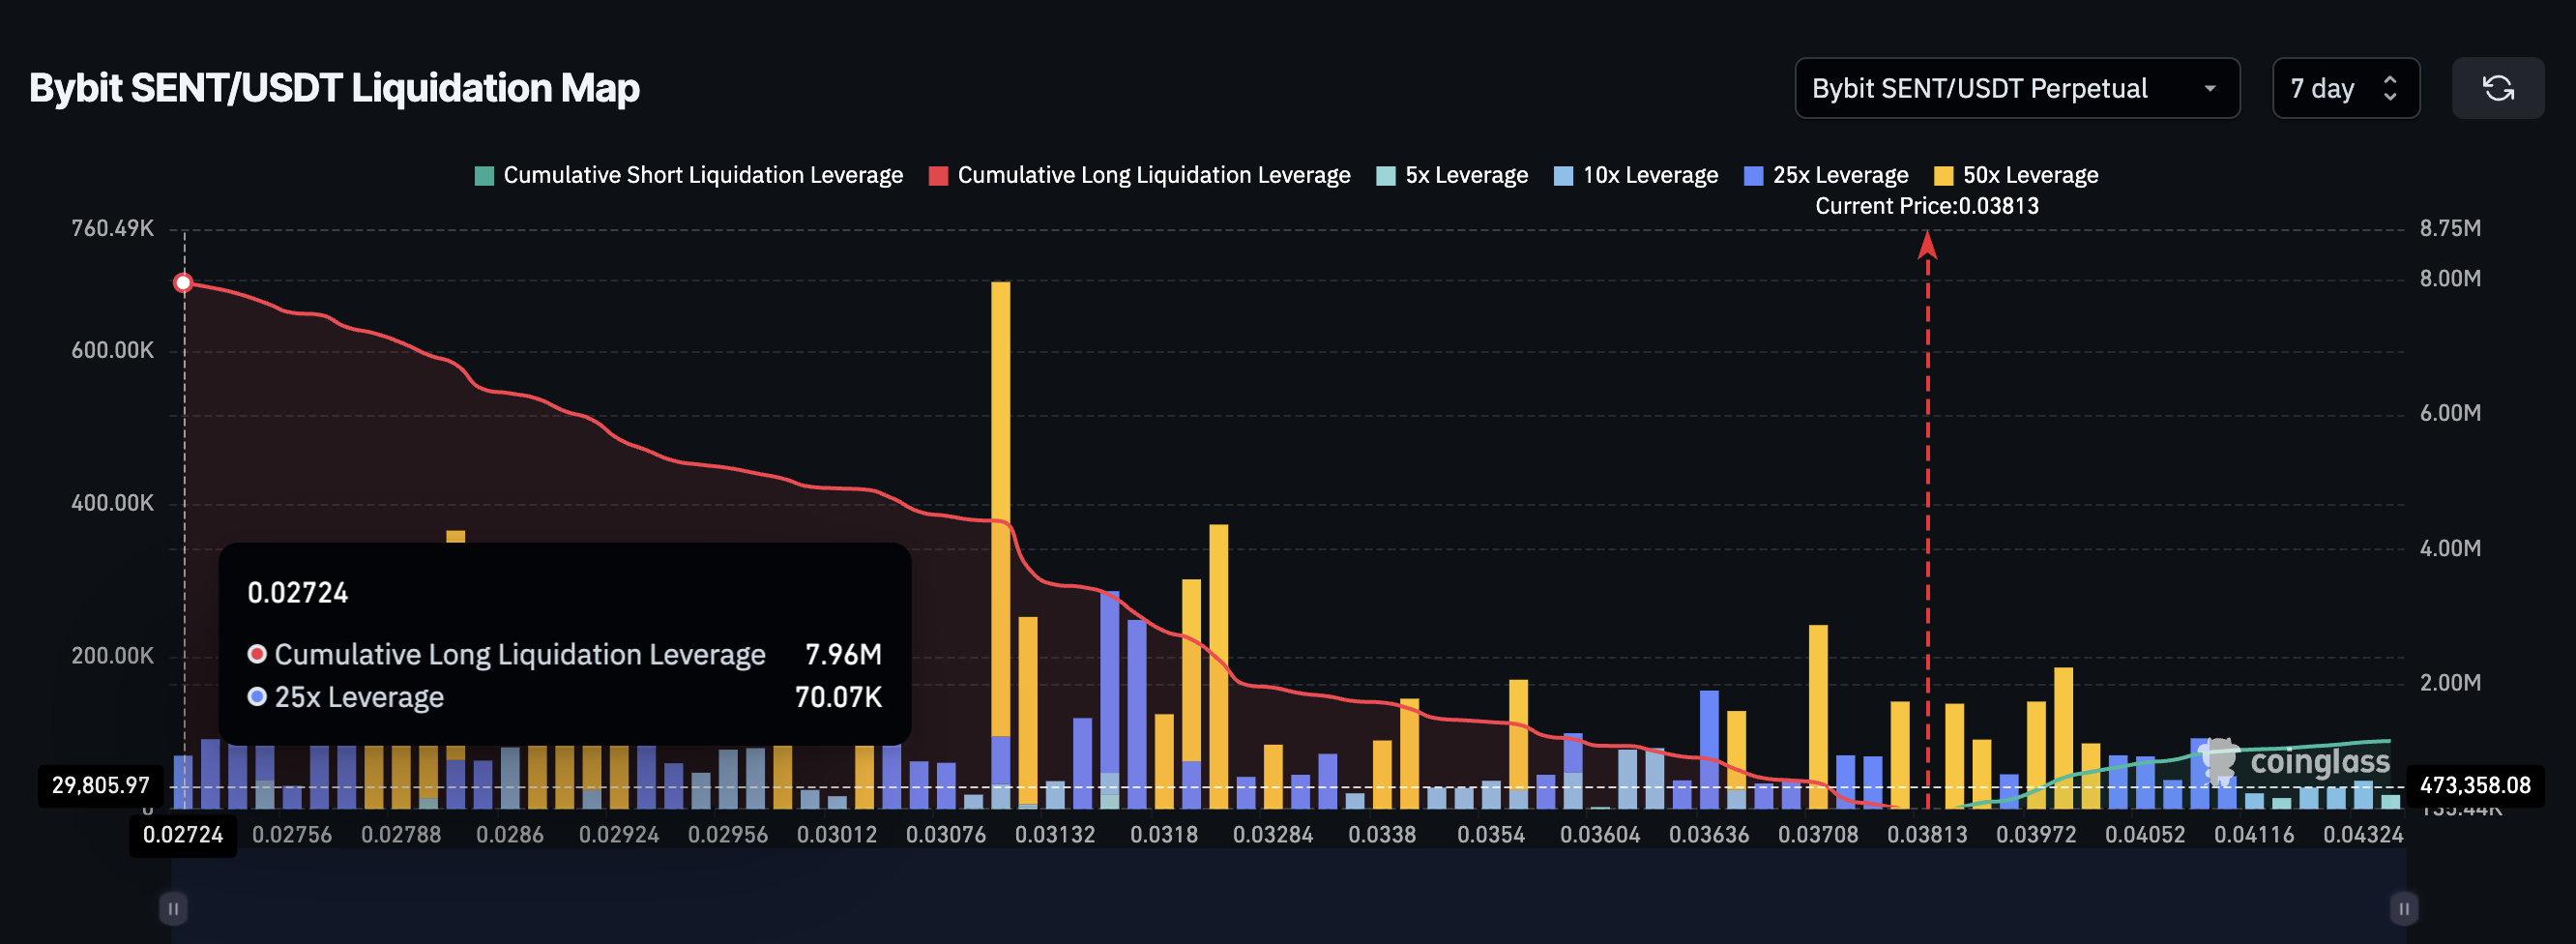 SENT Liquidation Map: Coinglass
Momentum indicators reinforce the SENT price risk. The Relative Strength Index (RSI) measures how stretched a move is. Between January 29 and January 30, Sentient’s price made a higher high, while RSI made a slightly lower high. That bearish divergence flagged the recent pullback.
For this rally to stay healthy, RSI needs to push above its prior peak near 70 to get in line with the SENT price. Failure to do so increases downside risk. Price levels now matter.
A clean 4-hour close above $0.039 would signal renewed strength. If Sentient fails there, $0.036 becomes the first support to watch.
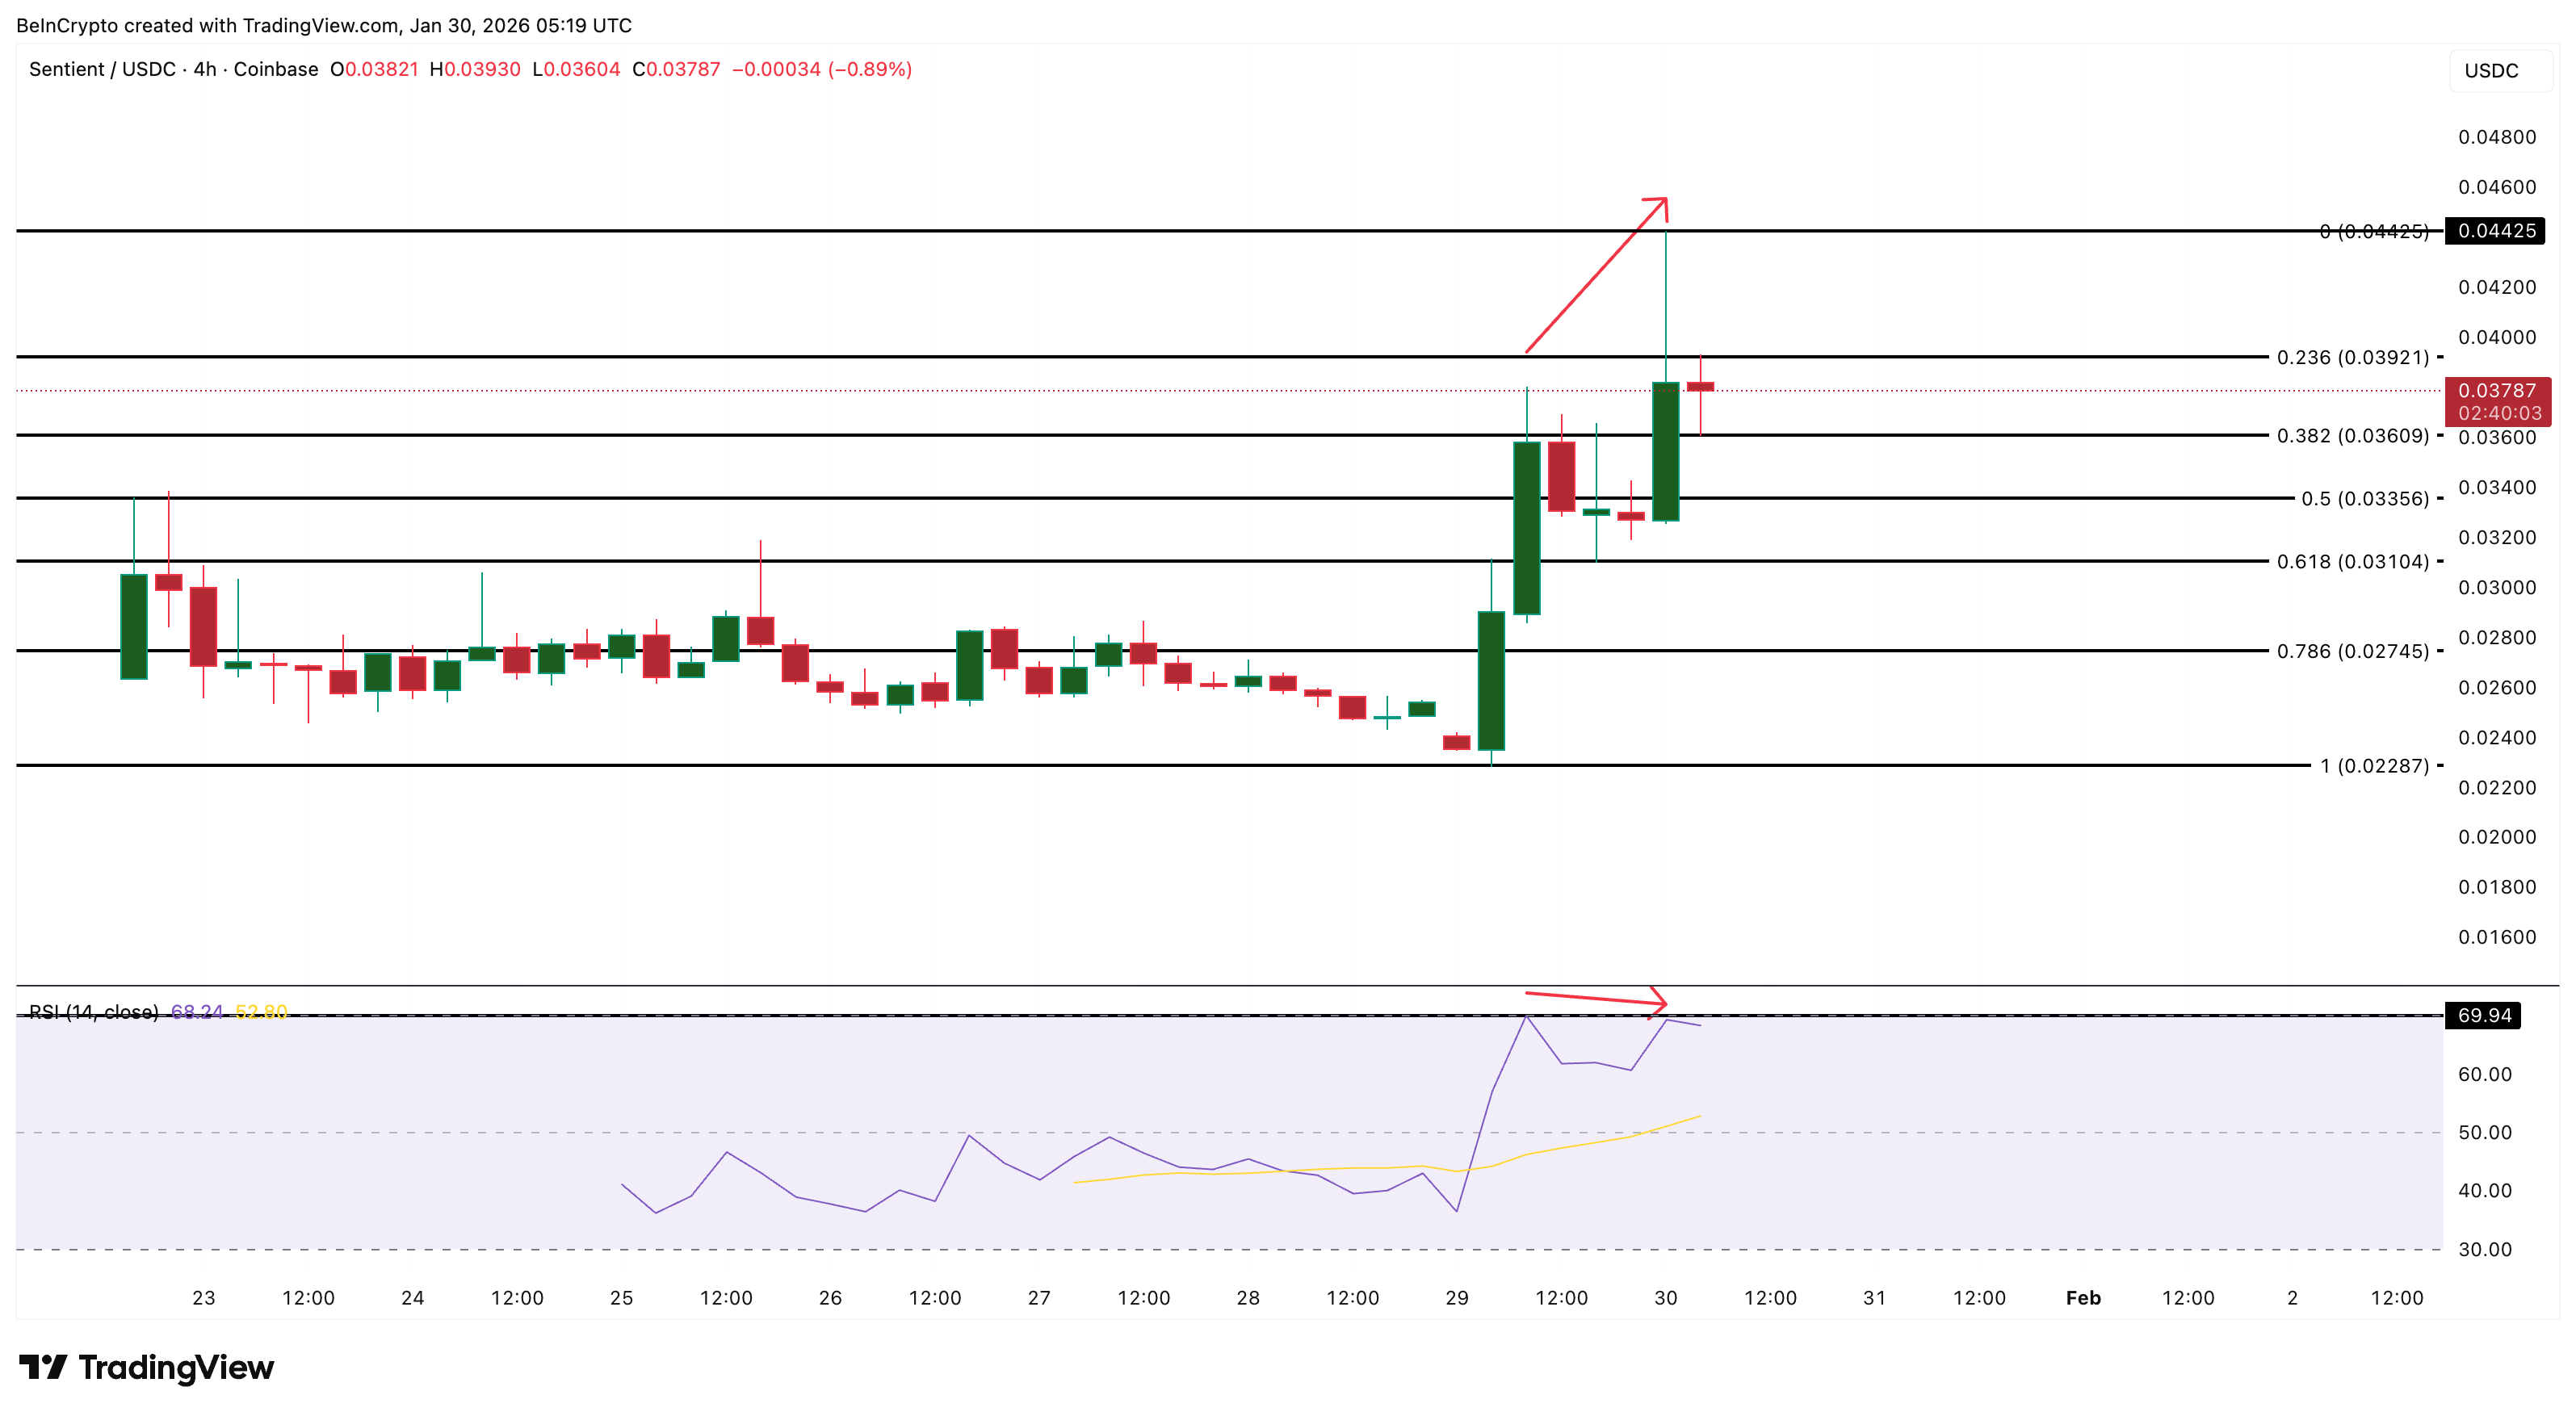 Sentient Price Analysis: TradingView
A deeper move toward $0.036 would likely trigger long liquidations, given the current leverage imbalance. That could expose lower levels, such as $0.031 or even $0.022, if the BTC price starts gaining strength.
All thanks to the negative correlation with SENT.
Recommended Articles


