


Bitcoin price continues to get rejected from $65K resistance as SEC delays decision on spot BTC ETF options
- Bitcoin price rejection from $65,000 resistance continues after failure to reclaim it as support.
- Liquidity pool below $60,000 continues to act as magnet for BTC toward proper market balance.
- US SEC has delayed decision and opened comment period on whether or not to allow options trading on spot BTC ETFs.
Bitcoin (BTC) price has markets in disarray, provoking a broader market crash as it slumped to the $62,000 range on Thursday. Meanwhile, reverberations from spot BTC exchange-traded funds (ETFs) continue to influence the market.
Also Read: Bitcoin price downside momentum grows, BTC bulls wait to buy BTC under $63K level
Daily digest market movers: SEC delays decision on spot Bitcoin ETF options trading
The US Securities & Exchange Commission (SEC) has delayed a decision on whether or not to allow options trading on spot BC ETFs. It basically means that they need more time to review and analyze the proposal. The SEC may have concerns about potential risks, market manipulation or other regulatory issues associated with introducing options trading on these ETFs.
JUST IN: SEC delays decision and opens comment period on whether or not to allow options trading on spot #Bitcoin ETFs. pic.twitter.com/W7Kv3uAzaY
— Bitcoin Magazine (@BitcoinMagazine) April 25, 2024
Delays in such decisions are common as the financial regulator works to ensure investor protection and market integrity. Alongside the delay, it has opened a comment period but in the meantime markets will be keen to wait for further updates from the SEC or the relevant parties involved in the proposal to understand the reasoning behind the delay and any potential implications for investors.
Meanwhile, data according to on-chain market intelligence firm Glassnode shows the Bitcoin network hash rate is still rising, which points to ongoing investments in mining infrastructure. A strong mining hash rate is crucial for Bitcoin's security, making network attacks more challenging.
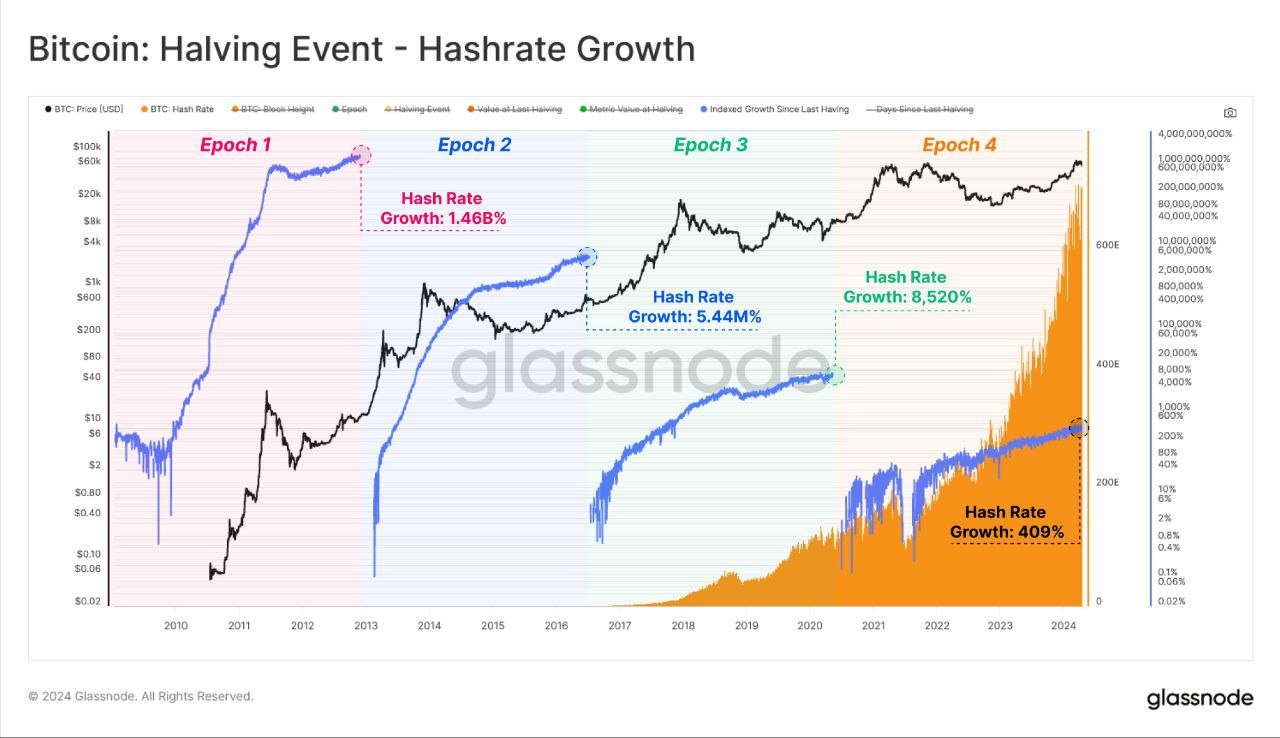
BTC hashrate growth
Technical analysis: Bitcoin price drawn to liquidity pool below $60,600
From a technical standpoint, Bitcoin price continues to get rejected from the $65,600 resistance level. It comes after multiple failed attempts to reclaim above it and flip the level into support.
Accordingly, the pioneer cryptocurrency has been producing downside wicks, drawn toward the pool of liquidity that exists between the $60,600 and $60,000 psychological level.
As this has happened for multiple weeks now, enhanced profit booking could see Bitcoin price dip into the said liquidity pool. This will happen if the Relative Strength Index (RSI) continues to record lower highs, effectively pulling toward the 50 mean level. The Moving Average Convergence Divergence (MACD) is also hinting at a downtrend, pending confirmation when it will cross below the orange band of its signal line. If it does, it would signify a potential change in the direction of BTC price movement.
This would mean that the short-term momentum is shifting to the downside and that a potential downtrend may be forming. Traders are likely to sell or take a bearish position on BTC when this happens, which would enhance the downtrend.
In a dire case, Bitcoin price could slip below the liquidity pool under the $60,000 psychological level, with the next line of support presented by the 50-day Moving Average (MA) at $54,689. A deviation of this lagging indicator to the downside would signal an extended fall.
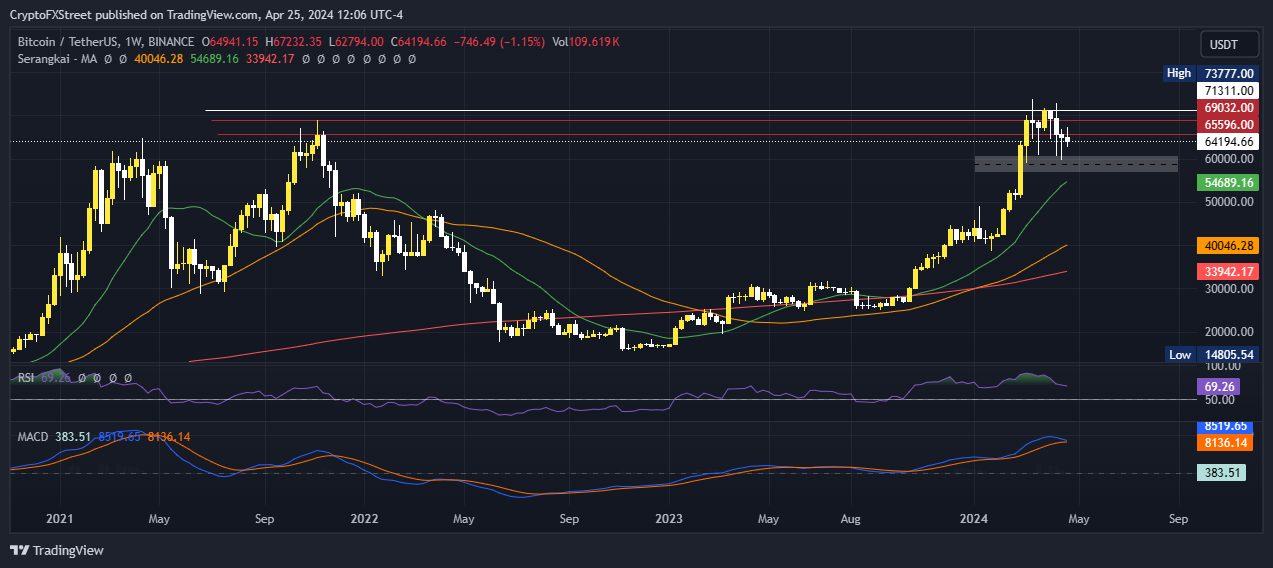
BTC/USDT 1-week chart
Conversely, if the bulls leverage the ongoing correction as a buy the dip opportunity, Bitcoin price could recover. Key levels to watch in a northbound directional bias would be the $65,596, $69,032, and $71,311 levels. A candlestick close above here would pave the way for BTC to reclaim its peak price of $73,777, which would lay the groundwork for a new all-time high above it.
Bitcoin, altcoins, stablecoins FAQs
Bitcoin is the largest cryptocurrency by market capitalization, a virtual currency designed to serve as money. This form of payment cannot be controlled by any one person, group, or entity, which eliminates the need for third-party participation during financial transactions.
Altcoins are any cryptocurrency apart from Bitcoin, but some also regard Ethereum as a non-altcoin because it is from these two cryptocurrencies that forking happens. If this is true, then Litecoin is the first altcoin, forked from the Bitcoin protocol and, therefore, an “improved” version of it.
Stablecoins are cryptocurrencies designed to have a stable price, with their value backed by a reserve of the asset it represents. To achieve this, the value of any one stablecoin is pegged to a commodity or financial instrument, such as the US Dollar (USD), with its supply regulated by an algorithm or demand. The main goal of stablecoins is to provide an on/off-ramp for investors willing to trade and invest in cryptocurrencies. Stablecoins also allow investors to store value since cryptocurrencies, in general, are subject to volatility.
Bitcoin dominance is the ratio of Bitcoin's market capitalization to the total market capitalization of all cryptocurrencies combined. It provides a clear picture of Bitcoin’s interest among investors. A high BTC dominance typically happens before and during a bull run, in which investors resort to investing in relatively stable and high market capitalization cryptocurrency like Bitcoin. A drop in BTC dominance usually means that investors are moving their capital and/or profits to altcoins in a quest for higher returns, which usually triggers an explosion of altcoin rallies.
Recommended Articles


