Pump.fun Price Forecast: PUMP sees bearish reversal despite buyback

Source Fxstreet
  • PUMP reverses by nearly 7% from the 50-day EMA at $0.002601, dropping below $0.0025 on Friday.
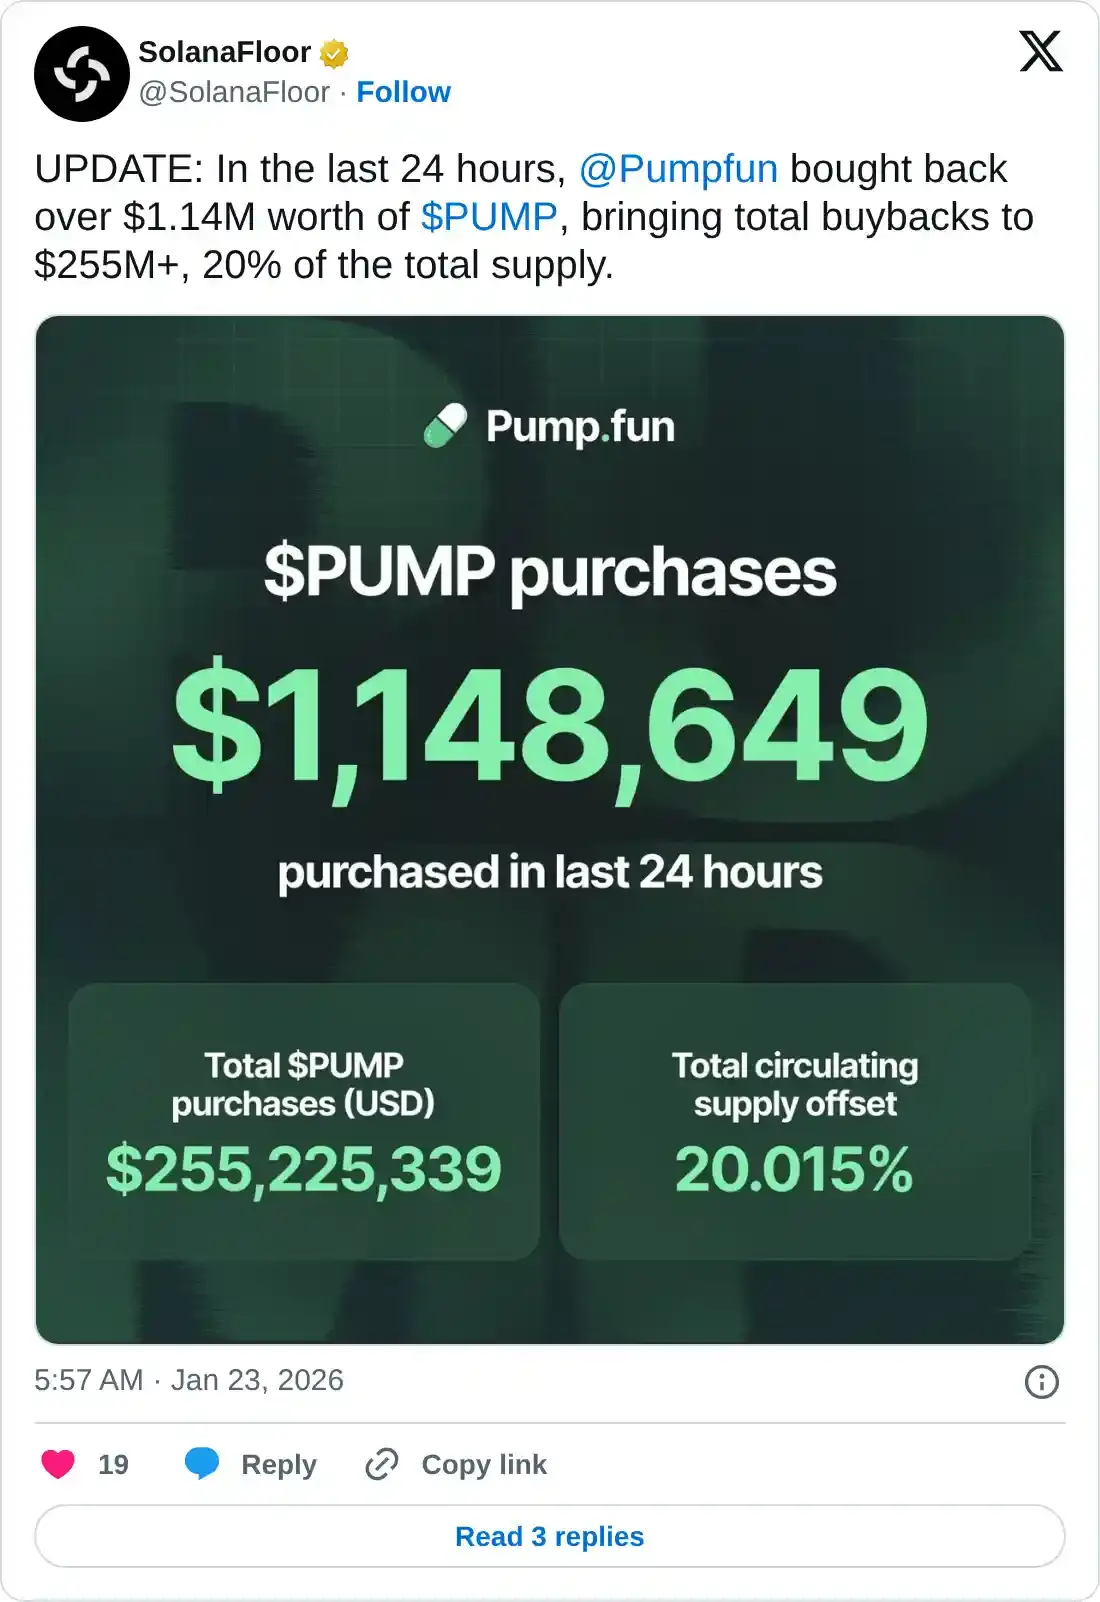
  • Pump.fun repurchases over $1 million in PUMP, securing 20% of the total supply.
  • The technical outlook is bearish, as the MACD indicator gives a sell signal.

Pump.fun (PUMP) trades below $0.0025 at the time of writing on Friday, after a nearly 7% decline from the 50-day Exponential Moving Average (EMA) at $0.002601. The recent purchase of over $1 million in PUMP tokens failed to revive retail support, as PUMP futures continue to see capital outflow. Technically, the PUMP token rests at a crucial crossroads as the previous bullish momentum fades.

Buybacks fail to offset declining demand for PUMP

Pump.fun has purchased $1.14 million worth of PUMP tokens over the last 24 hours, totaling $255.22 million or 20% of the total circulation. Typically, a reduction of such a margin in circulation leads to a demand bias, driving the prices higher. However, PUMP remains under selling pressure as the retail demand for the launchpad token weakens.

https://x.com/SolanaFloor/status/2014578163217793448

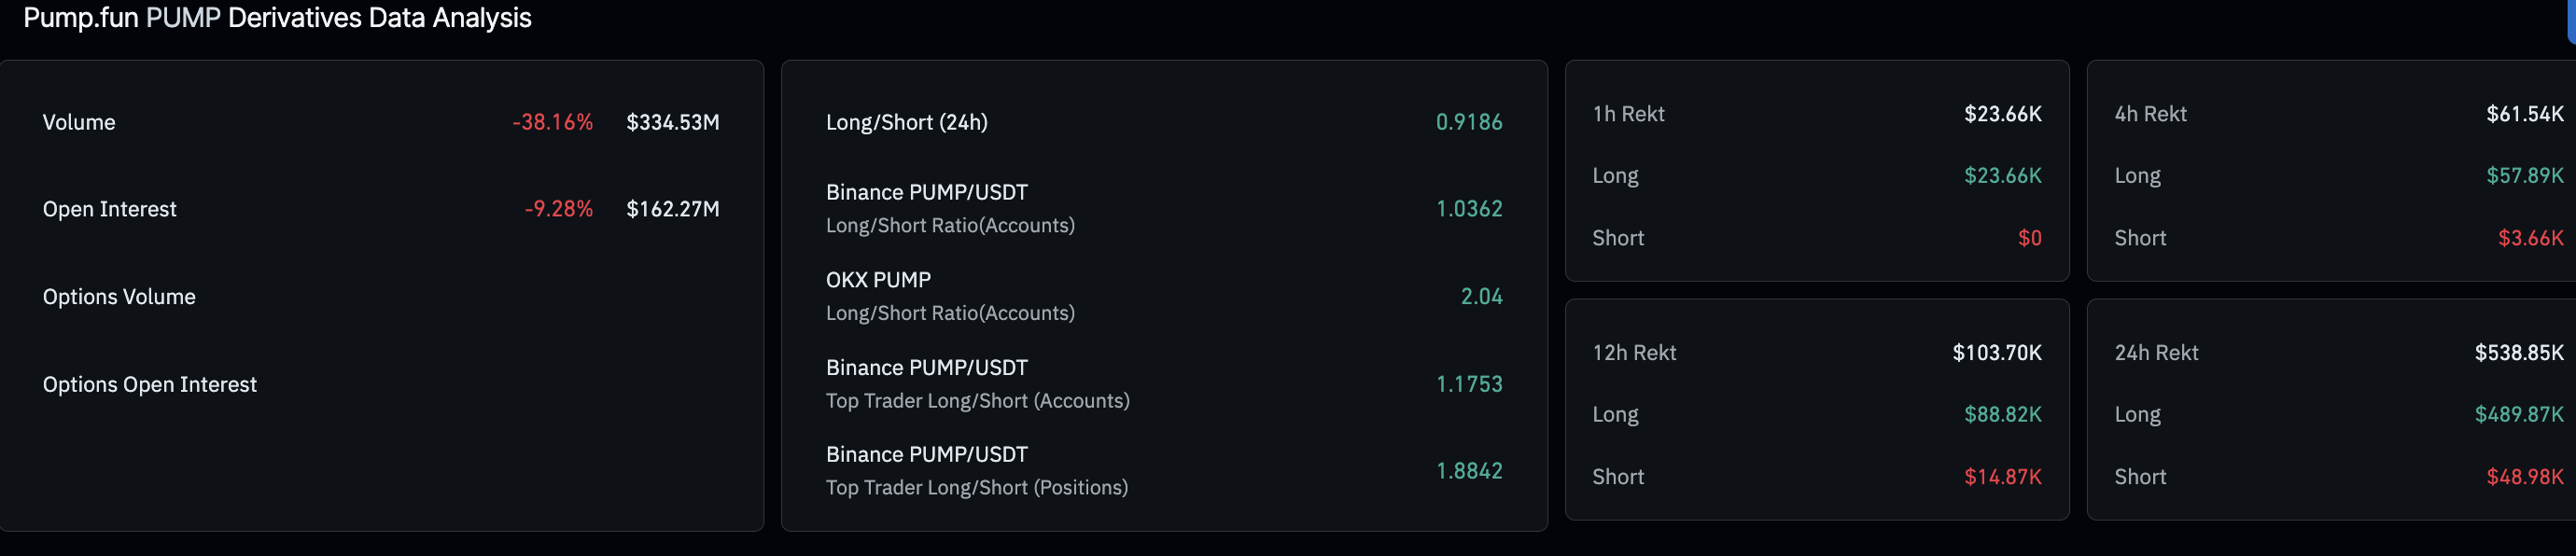
On the derivatives side, CoinGlass data shows a 9.28% drop in PUMP futures Open Interest (OI) over the last 24 hours to $162.27 million, reaffirming the declining demand. Furthermore, the $489,870 in long liquidations outpaced the $48,980 in short liquidations over the last 24 hours, suggesting a biased wipeout of bullish positions. Long liquidation spikes and declining OI are consistent with the bearish outlook for PUMP. 

PUMP derivatives data. Source: CoinGlass

Technical outlook: Will PUMP extend the correction phase?

PUMP’s breakout rally from a descending trendline connecting the September 18 and January 6 highs failed to clear the R1 Pivot Point at $0.002983, returning to the breakout zone.

The bullish momentum has cooled after the breakout, and the technical indicators suggest a downside bias. The Moving Average Convergence Divergence (MACD) slips below the red line on the daily chart near the zero level, giving a sell signal and suggesting renewed bearish pressure. At the same time, the Relative Strength Index (RSI) is at 49, violating the midline support and suggesting subdued buying pressure. 

If the Solana-based launchpad token slips below the January 19 low at $0.002247, it would expose the $0.002000 psychological support and the deeper support near the December 24 low at $0.001678.

PUMP/USDT daily logarithmic chart.

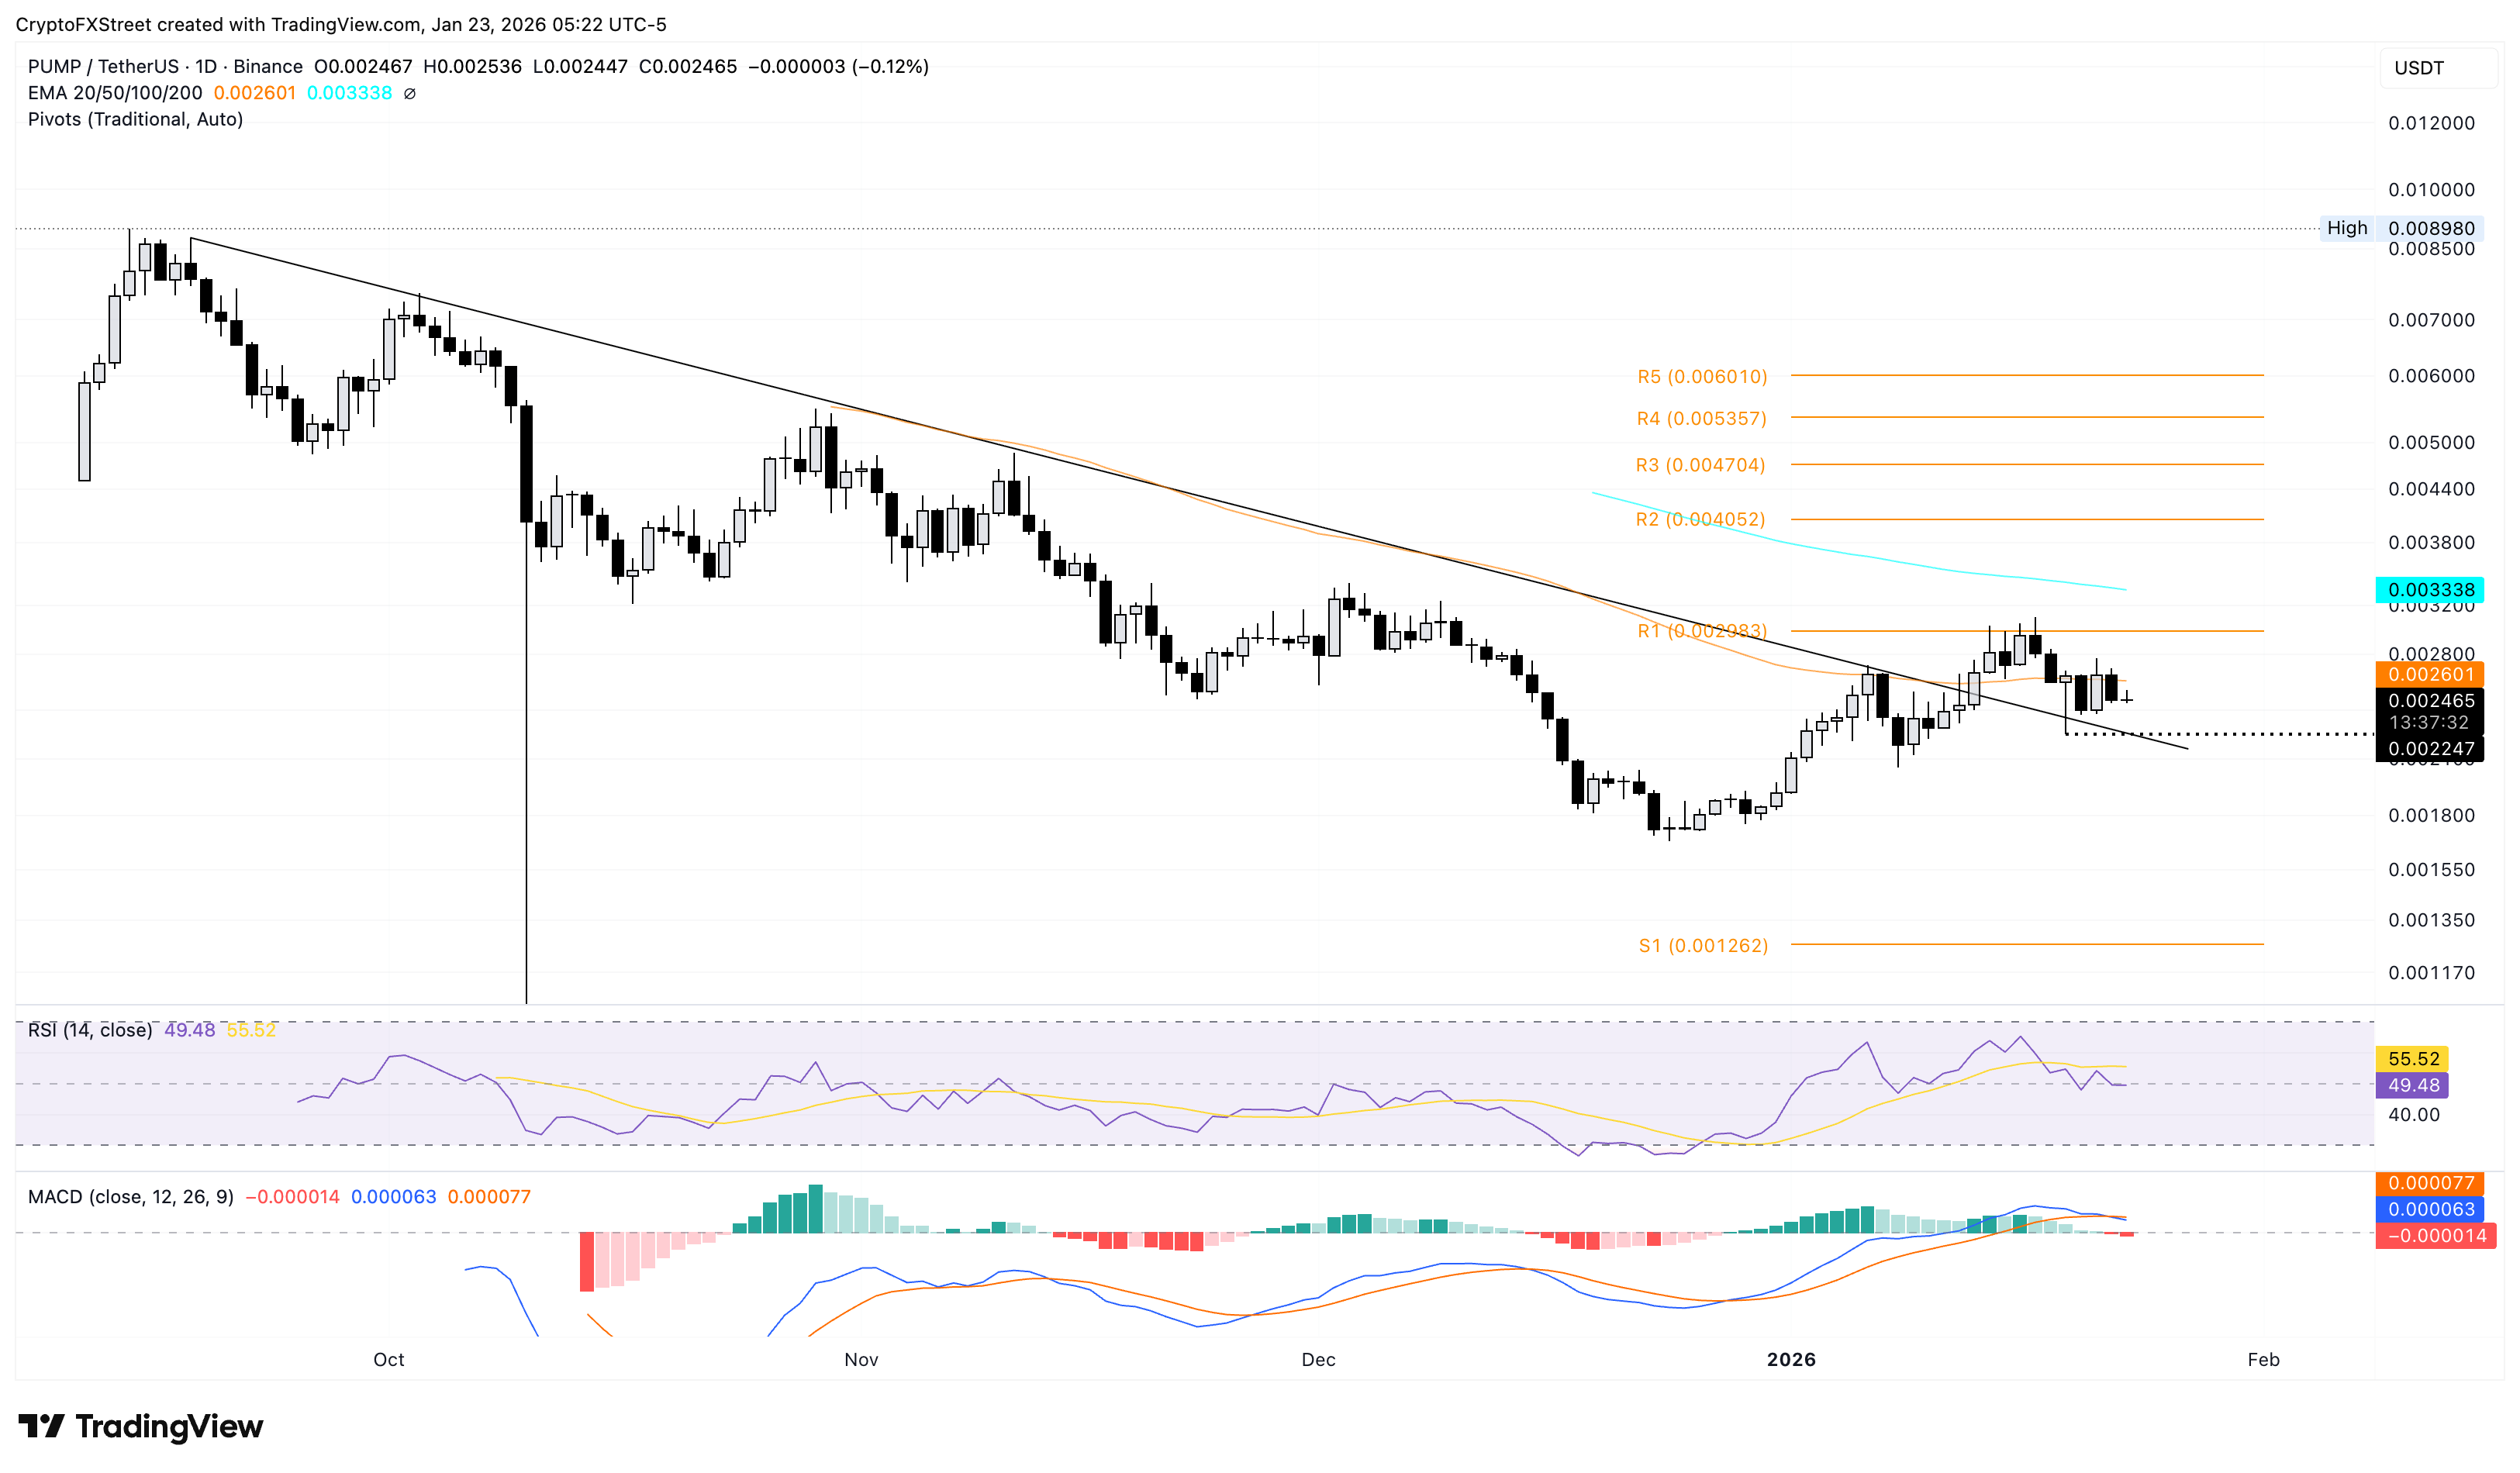
On the upside, PUMP should clear $0.002983 to reinstate an upward trend toward the 100-day EMA at $0.003338.

(The technical analysis of this story was written with the help of an AI tool.)

Disclaimer: For information purposes only. Past performance is not indicative of future results.
placeholder
The dollar weakened, equities dipped, and gold hit record highsThe dollar weakened, equities fell, and gold set new records on Wednesday as investors waited for a Fed rate cut later in the day.
Author  Cryptopolitan
Sep 17, 2025
The dollar weakened, equities fell, and gold set new records on Wednesday as investors waited for a Fed rate cut later in the day.
placeholder
Markets in 2026: Will gold, Bitcoin, and the U.S. dollar make history again? — These are how leading institutions thinkAfter a turbulent 2025, what lies ahead for commodities, forex, and cryptocurrency markets in 2026?
Author  Insights
Dec 25, 2025
After a turbulent 2025, what lies ahead for commodities, forex, and cryptocurrency markets in 2026?
placeholder
My Top 5 Stock Market Predictions for 2026Five 2026 market predictions written in a native, news-style voice: AI’s winners and losers, broader sector leadership, dividend demand, valuation cooling as the Shiller CAPE sits at 39 (Dec. 31, 2025), and quantum-computing bursts—while keeping all original facts and numbers unchanged.
Author  Mitrade
Jan 06, Tue
Five 2026 market predictions written in a native, news-style voice: AI’s winners and losers, broader sector leadership, dividend demand, valuation cooling as the Shiller CAPE sits at 39 (Dec. 31, 2025), and quantum-computing bursts—while keeping all original facts and numbers unchanged.
placeholder
Gold slumps to near $5,050 on oil-driven inflation fears, stronger US DollarGold price (XAU/USD) falls to around $5,065 during the early Asian session on Monday, pressured by a stronger US Dollar (USD) and inflationary risks. Traders will closely monitor the developments surrounding the US-Iran conflicts and geopolitical risks in the Middle East.
Author  FXStreet
Mar 09, Mon
Gold price (XAU/USD) falls to around $5,065 during the early Asian session on Monday, pressured by a stronger US Dollar (USD) and inflationary risks. Traders will closely monitor the developments surrounding the US-Iran conflicts and geopolitical risks in the Middle East.
placeholder
WTI trades below $82.00 as IEA plans record Oil reserve releaseWest Texas Intermediate (WTI) crude oil price gave up gains from the previous session, trading around $81.70 per barrel during the Asian hours on Wednesday.
Author  FXStreet
10 hours ago
West Texas Intermediate (WTI) crude oil price gave up gains from the previous session, trading around $81.70 per barrel during the Asian hours on Wednesday.
goTop
quote