

BNB holds firm above $900 as quarterly burn, on-chain activity drive gains

Source Fxstreet
  • BNB steadies above $900 on Friday, with over 3% gains so far this week.
  • BNB Foundation announced the 34th quarterly burn of 1.37 million tokens on Thursday.
  • On-chain data shows a resurgence in transactional activity and user deposits.

BNB (previously known as Binance Coin) trades in the green around $935 on Friday, recovering after a nearly 2% pullback the previous day and aligning with the priced-in BNB Foundation’s 34th quarterly burn of roughly 1.37 million BNB tokens. Still, on-chain data shows BNB Chain warming up, with Total Value Locked (TVL) and transaction count rising. 

BNB network growth continues, overlooking discounted token burning

BNB Foundation announced 1.37 million BNB tokens were wiped from the circulation, reducing supply. However, the token burning aligned with profit-taking on Thursday, suggesting that the event was already priced in. 

Still, BNB extends its recovery for the third consecutive week, strongly suggesting a local bottom formation. The recovery is consistent with a resurgence in network activity, including transactions and user deposits. DeFiLlama data shows that the total value of digital assets deposited on the BNB Chain stands at $7.102 billion on Friday, up from $6.602 billion on January 1. 
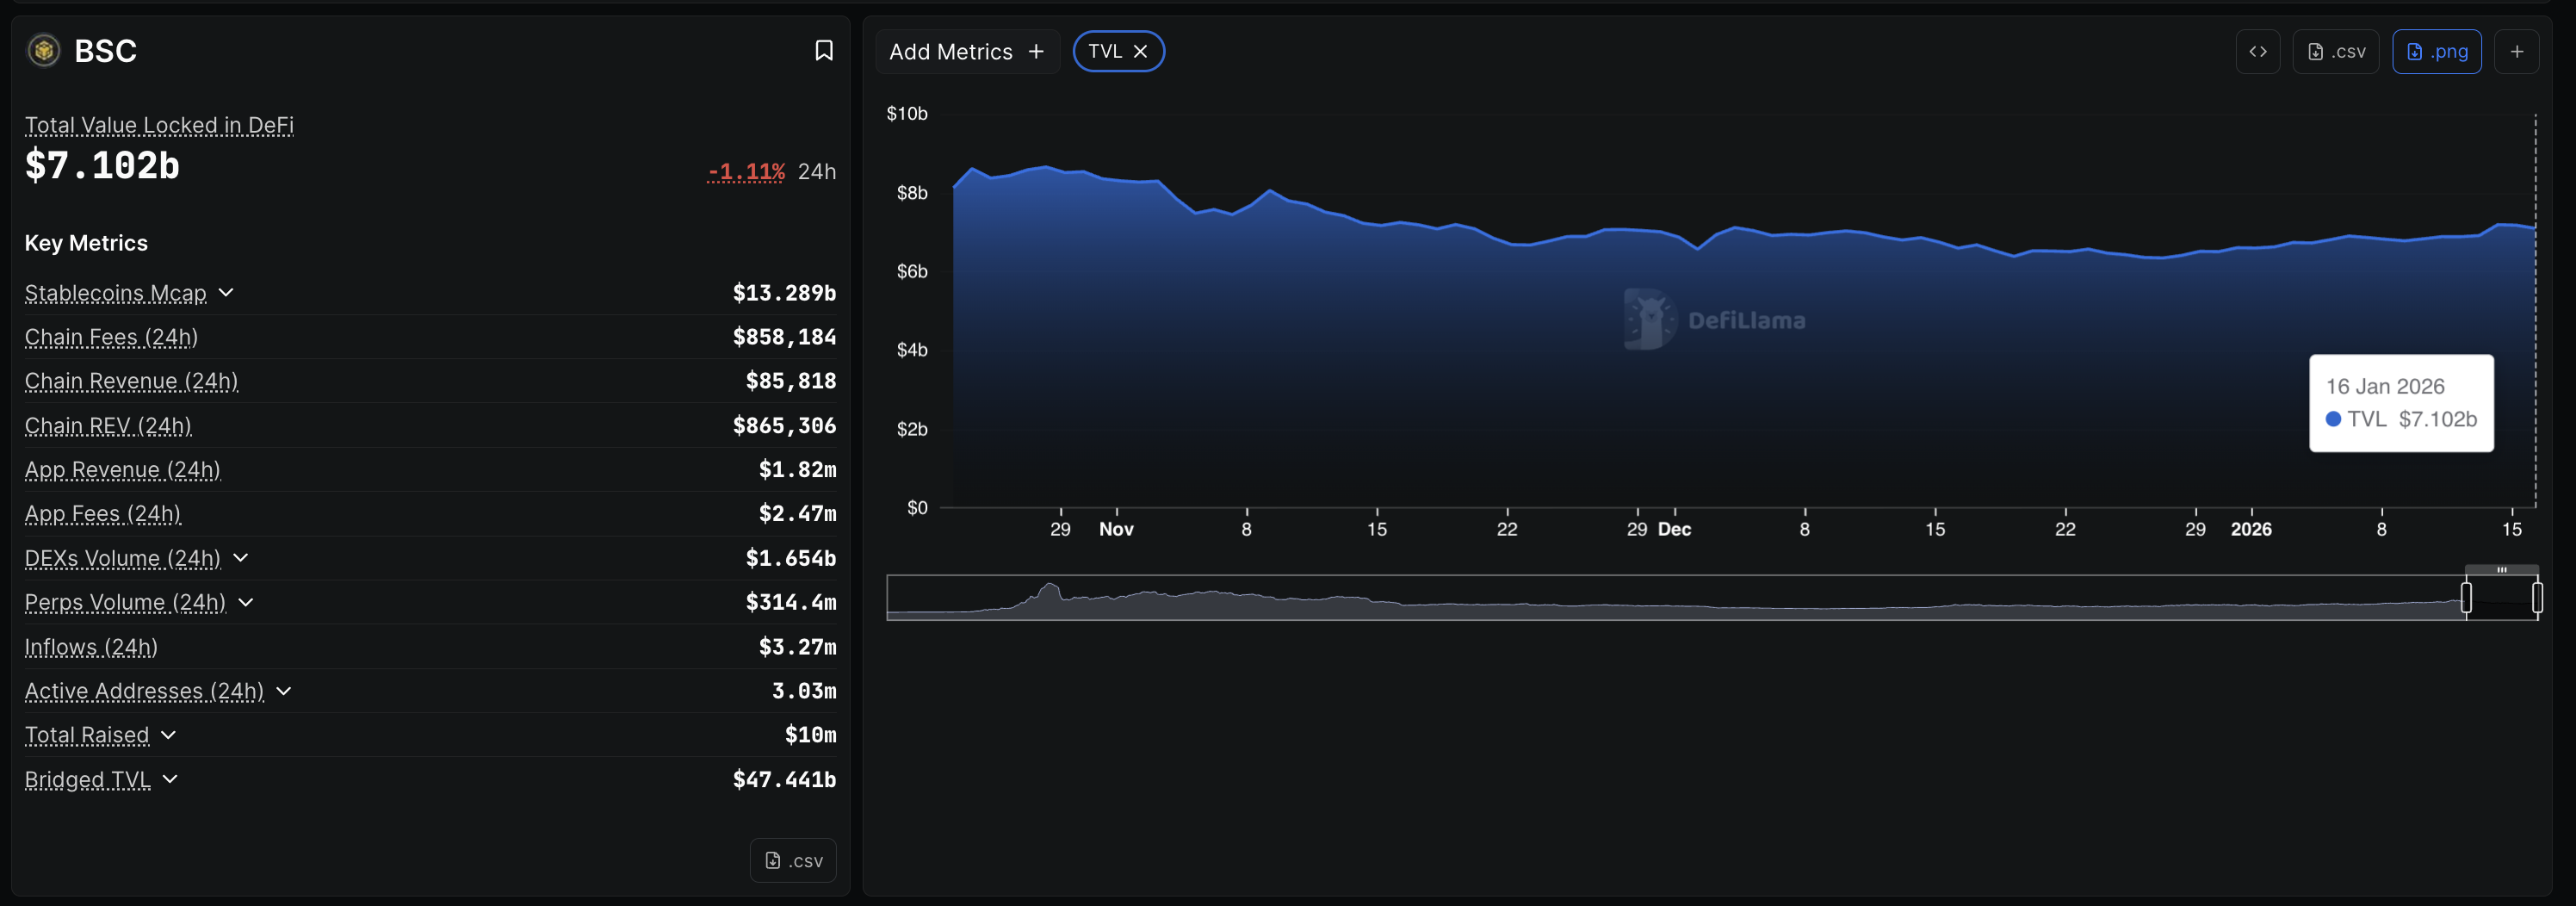
BNB Chain TVL data. Source: DeFiLlama

At the same time, Artemis Analytics data shows the transactions stood at 18.6 million on Wednesday, affirming renewed user activity. A steady network growth could back the demand for its native token, BNB. 
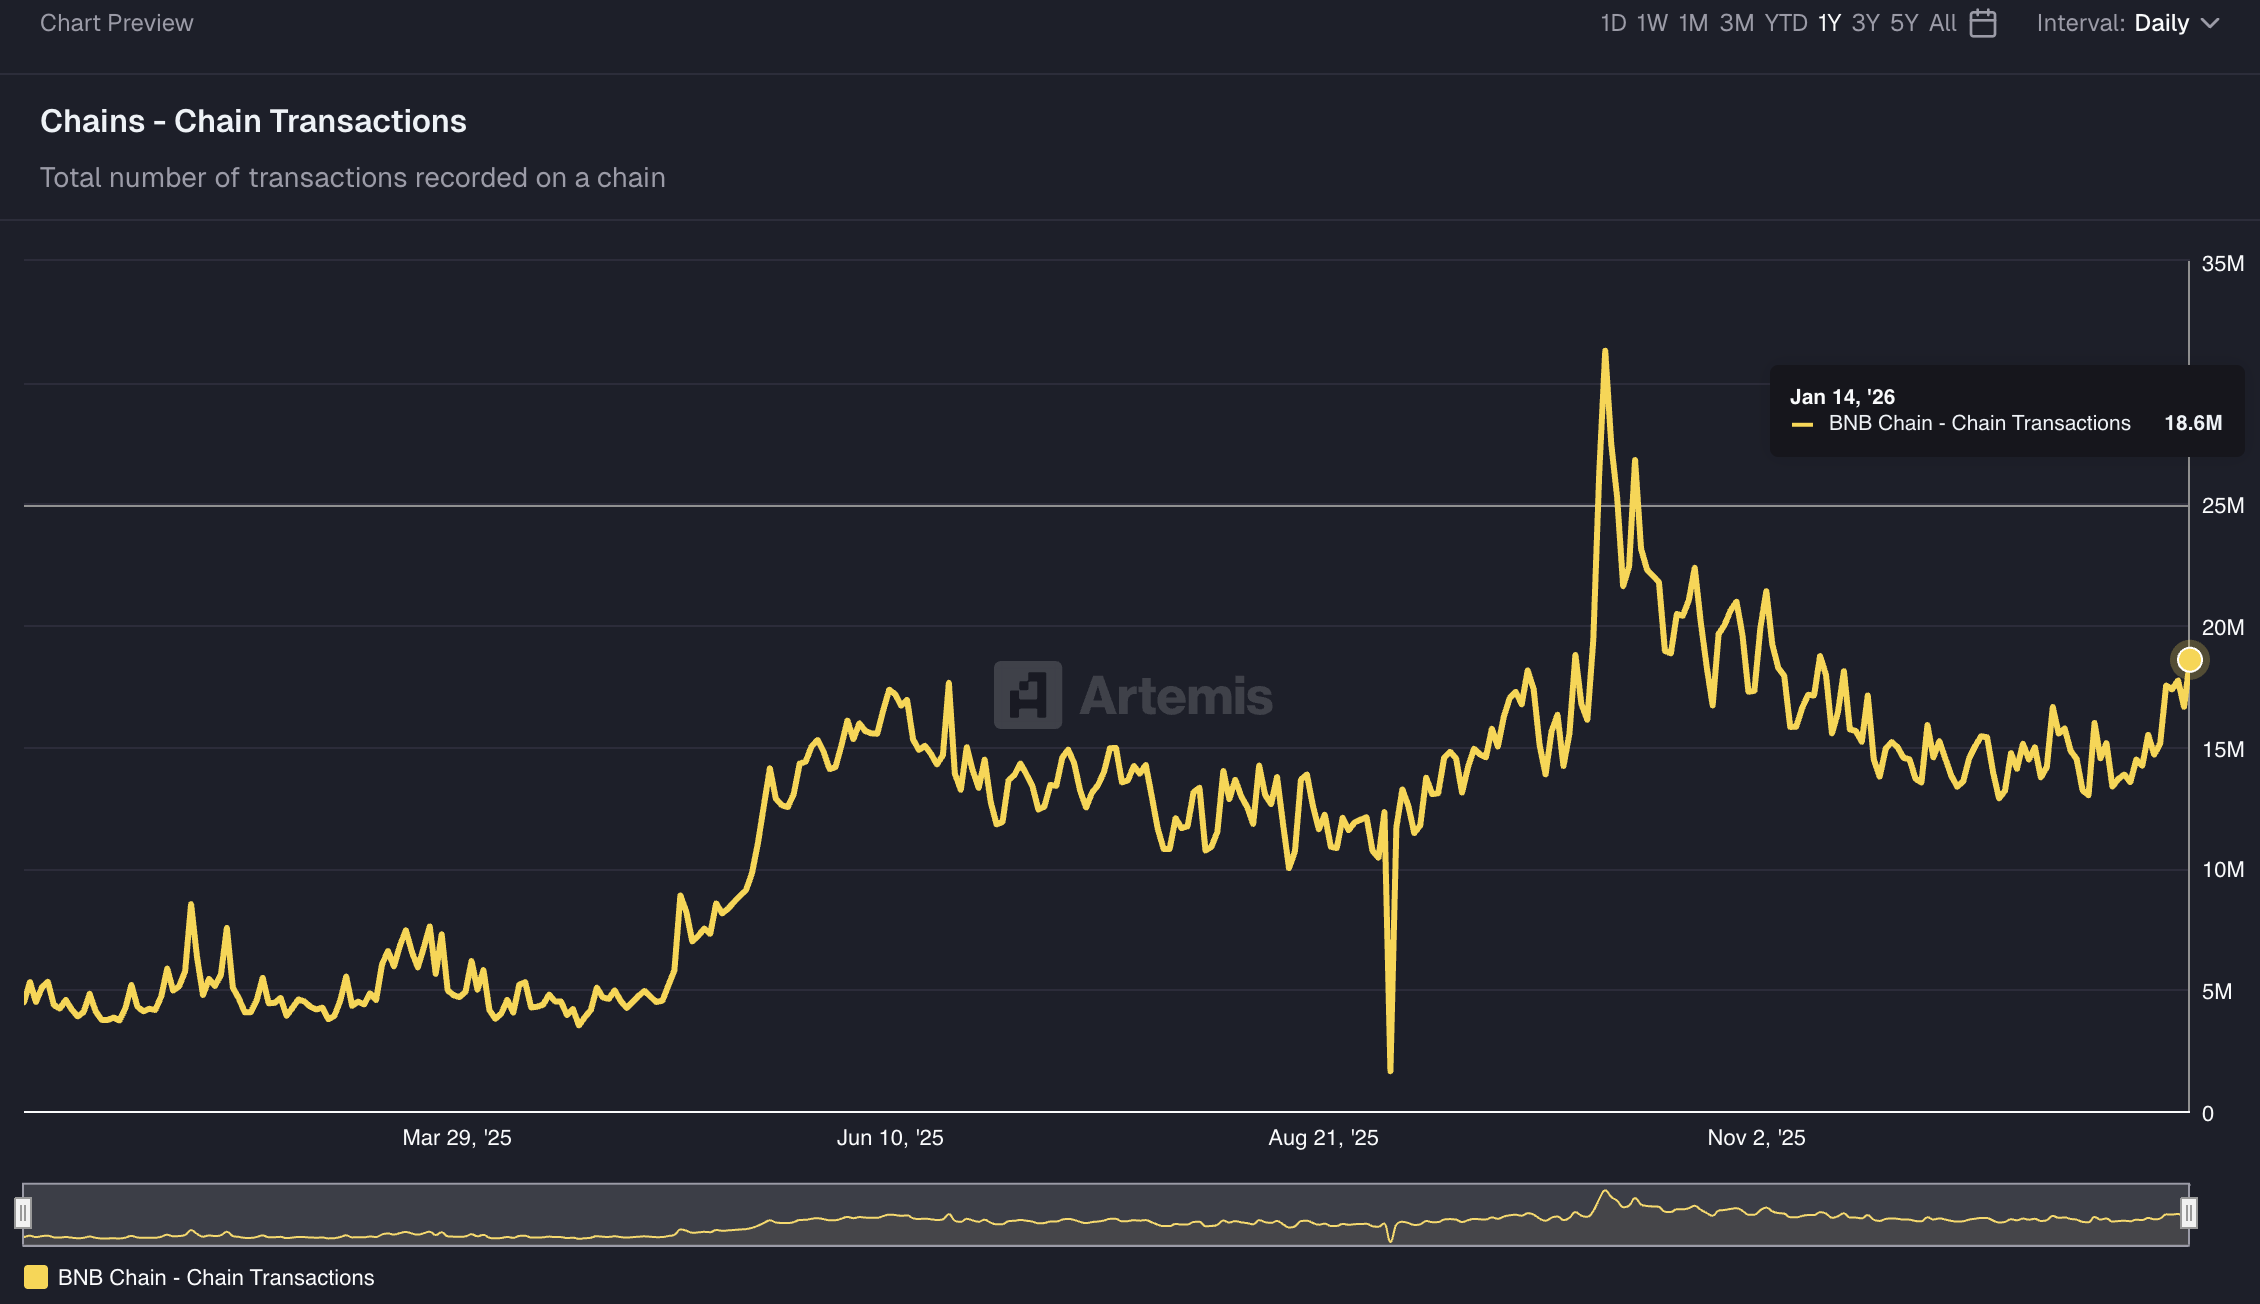
BNB Chain transaction data. Source: Artemis

Technical outlook: Will BNB bounce back above $1,000?

BNB price holds above key Exponential Moving Averages (EMAs), with the 20-, 50-, and 200-day EMAs rising and backing the upward bias. If the BNB recovers above $950 to clear Thursday’s pullback, it could follow toward $1,050, a crucial support level active in October now turned into resistance.

The Relative Strength Index (RSI) at 62 on the daily chart sustains upward bias while the K and D lines from the Stochastic RSI at 70 and 80, respectively, signal firm momentum with scope for brief consolidation before another leg higher. 
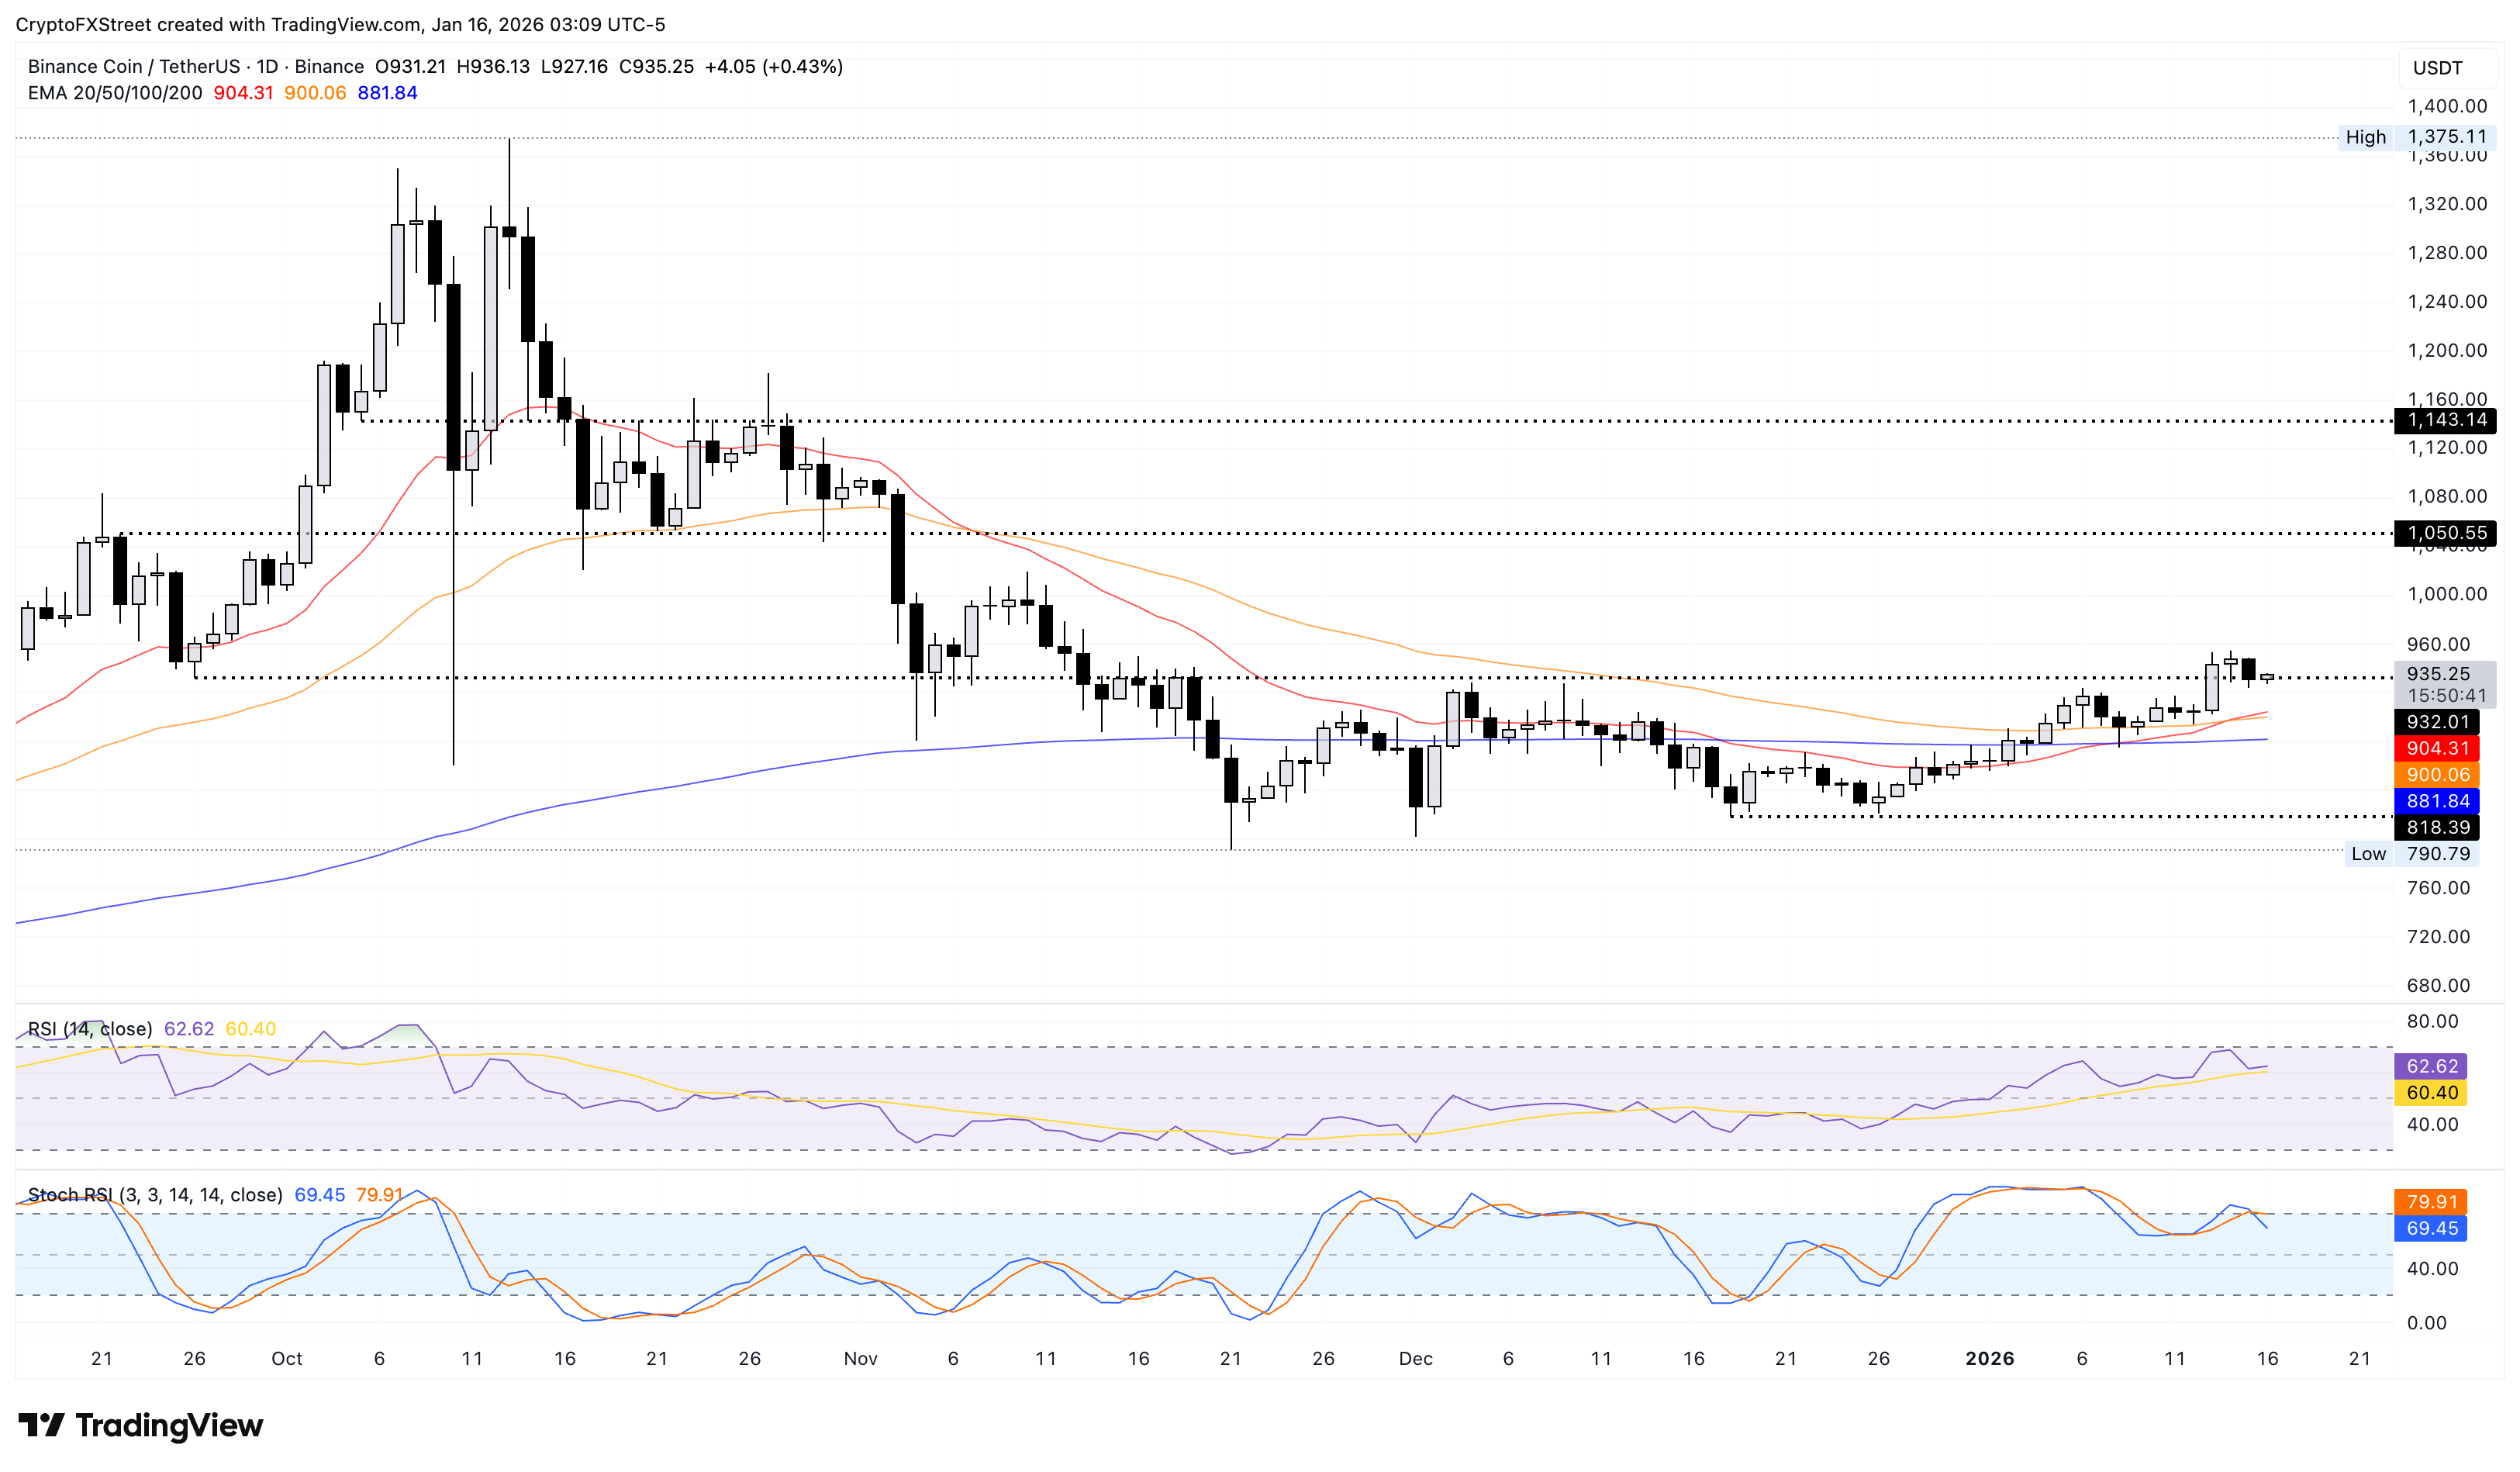
BNB/USDT daily price chart.

Looking down, initial support stands at the 20-day EMA at $904, with a deeper zone at the 200-day EMA at $881. A pullback into these levels would nullify the local bottom thesis, risking further correction or consolidation. 

(The technical analysis of this story was written with the help of an AI tool.)

Disclaimer: For information purposes only. Past performance is not indicative of future results.
placeholder
Bitcoin squeezes back above $80,000 — 110,000 traders liquidated as the hawkish Fed and CLARITY setback fail to hold it down; is $83,000 next?Bitcoin closed above $80,000 on Friday for the first time since September 7, and pushed to $81,299 over the weekend, triggering about $603 million of liquidations — $523 million of them shorts — across more than 110,000 traders. With the Fed's hike already priced and the SEC and CFTC advancing crypto rules after the CLARITY Act failed, here is what stands between BTC and the $83,000 gate.
Author  Suzie
15 hours ago
Bitcoin closed above $80,000 on Friday for the first time since September 7, and pushed to $81,299 over the weekend, triggering about $603 million of liquidations — $523 million of them shorts — across more than 110,000 traders. With the Fed's hike already priced and the SEC and CFTC advancing crypto rules after the CLARITY Act failed, here is what stands between BTC and the $83,000 gate.
placeholder
Gold ends three-week slide at the $4,400 line — eight straight days of ETF inflows vs a 5% 10-year and a 100 dollarSpot gold closed Friday at $4,378.39, up 0.84% on the day and about 0.8% for the week — its first weekly gain in four weeks — with the intraday high of $4,399.67 leaving it 33 cents shy of the $4,400 line. Gold ETFs have now logged eight straight sessions of inflows, but with the 10-year back above 5% and the dollar index near 100, here is what decides whether this is a reversal or a bounce.
Author  Suzie
15 hours ago
Spot gold closed Friday at $4,378.39, up 0.84% on the day and about 0.8% for the week — its first weekly gain in four weeks — with the intraday high of $4,399.67 leaving it 33 cents shy of the $4,400 line. Gold ETFs have now logged eight straight sessions of inflows, but with the 10-year back above 5% and the dollar index near 100, here is what decides whether this is a reversal or a bounce.
placeholder
Have Fed Rate Hike Headwinds Been Priced In? Gold Rebounds Strongly Toward $4,400, Poised for a New Rally As of the European session on September 18, gold prices (XAUUSD) extended Thursday's rebound, rising strongly in intraday trading to $4,399.75 today, just shy of the $4,400 psychological
Author  TradingKey
Sep 18, Fri
As of the European session on September 18, gold prices (XAUUSD) extended Thursday's rebound, rising strongly in intraday trading to $4,399.75 today, just shy of the $4,400 psychological
placeholder
US to delay new "overcapacity" tariffs on China — what the pause means for trade, inflation and the dollarWashington is expected to hold off announcing new tariffs over Chinese "overcapacity" until after the 24 September summit, according to Bloomberg. The postponed plan would have added 7.5% to Chinese goods, taking second-term US tariffs to around 20%. Here is what is on the table, and what a deal versus no deal would mean for the yuan, Hong Kong equities and the dollar.
Author  Mitrade
Sep 18, Fri
Washington is expected to hold off announcing new tariffs over Chinese "overcapacity" until after the 24 September summit, according to Bloomberg. The postponed plan would have added 7.5% to Chinese goods, taking second-term US tariffs to around 20%. Here is what is on the table, and what a deal versus no deal would mean for the yuan, Hong Kong equities and the dollar.
placeholder
Gold rebounds to near $4,350 on weaker US Dollar, falling oil pricesGold price (XAU/USD) rises to near $4,345 during the early Asian session on Friday. The precious metal rebounds from a six-week low amid falling oil prices and a weaker US Dollar (USD). Traders continue to assess the latest Federal Reserve (Fed) rate hike and policy cues.
Author  FXStreet
Sep 18, Fri
Gold price (XAU/USD) rises to near $4,345 during the early Asian session on Friday. The precious metal rebounds from a six-week low amid falling oil prices and a weaker US Dollar (USD). Traders continue to assess the latest Federal Reserve (Fed) rate hike and policy cues.
Related Instrument
goTop
quote