Top Crypto Gainers: JasmyCoin rallies as Cosmos and Bittensor retreat

Source Fxstreet
  • JasmyCoin approaches $0.01000 after a 27% jump on Tuesday, marking its sixth consecutive day of gains.
  • Cosmos is down 2% following Tuesday’s 7% rise, breaking the streak of six consecutive daily gains.
  • Bittensor loses over 3% after Tuesday’s 10% jump, failing to surpass the $300 mark.

JasmyCoin (JASMY), Cosmos (ATOM), and Bittensor (TAO) are among the top-performing cryptocurrency assets in the last 24 hours. JasmyCoin leads the rally with double-digit gains, and bulls are targeting further gains, while Cosmos and Bittensor struggle to extend their gains after six consecutive days of recovery. 

JasmyCoin inches closer to reclaiming a psychological level

JasmyCoin trades above $0.00950 at press time on Wednesday following the 27% surge on the previous day. The ongoing recovery in JASMY aims for the 200-day Exponential Moving Average (EMA) at $0.01105. 

A clean push above this moving average could extend the rally to $0.01361, last tested on October 3. 

The technical indicators on the daily chart suggest intense buying pressure. The Relative Strength Index (RSI) is at 79, deep into the overbought zone, but it warns of a potential reversal as buying pressure nears unsustainable levels. 

At the same time, the intense buying fuels trend momentum indicated by a steady rise in the Moving Average Convergence Divergence (MACD) and green histogram bars. 

JASMY/USDT daily price chart.

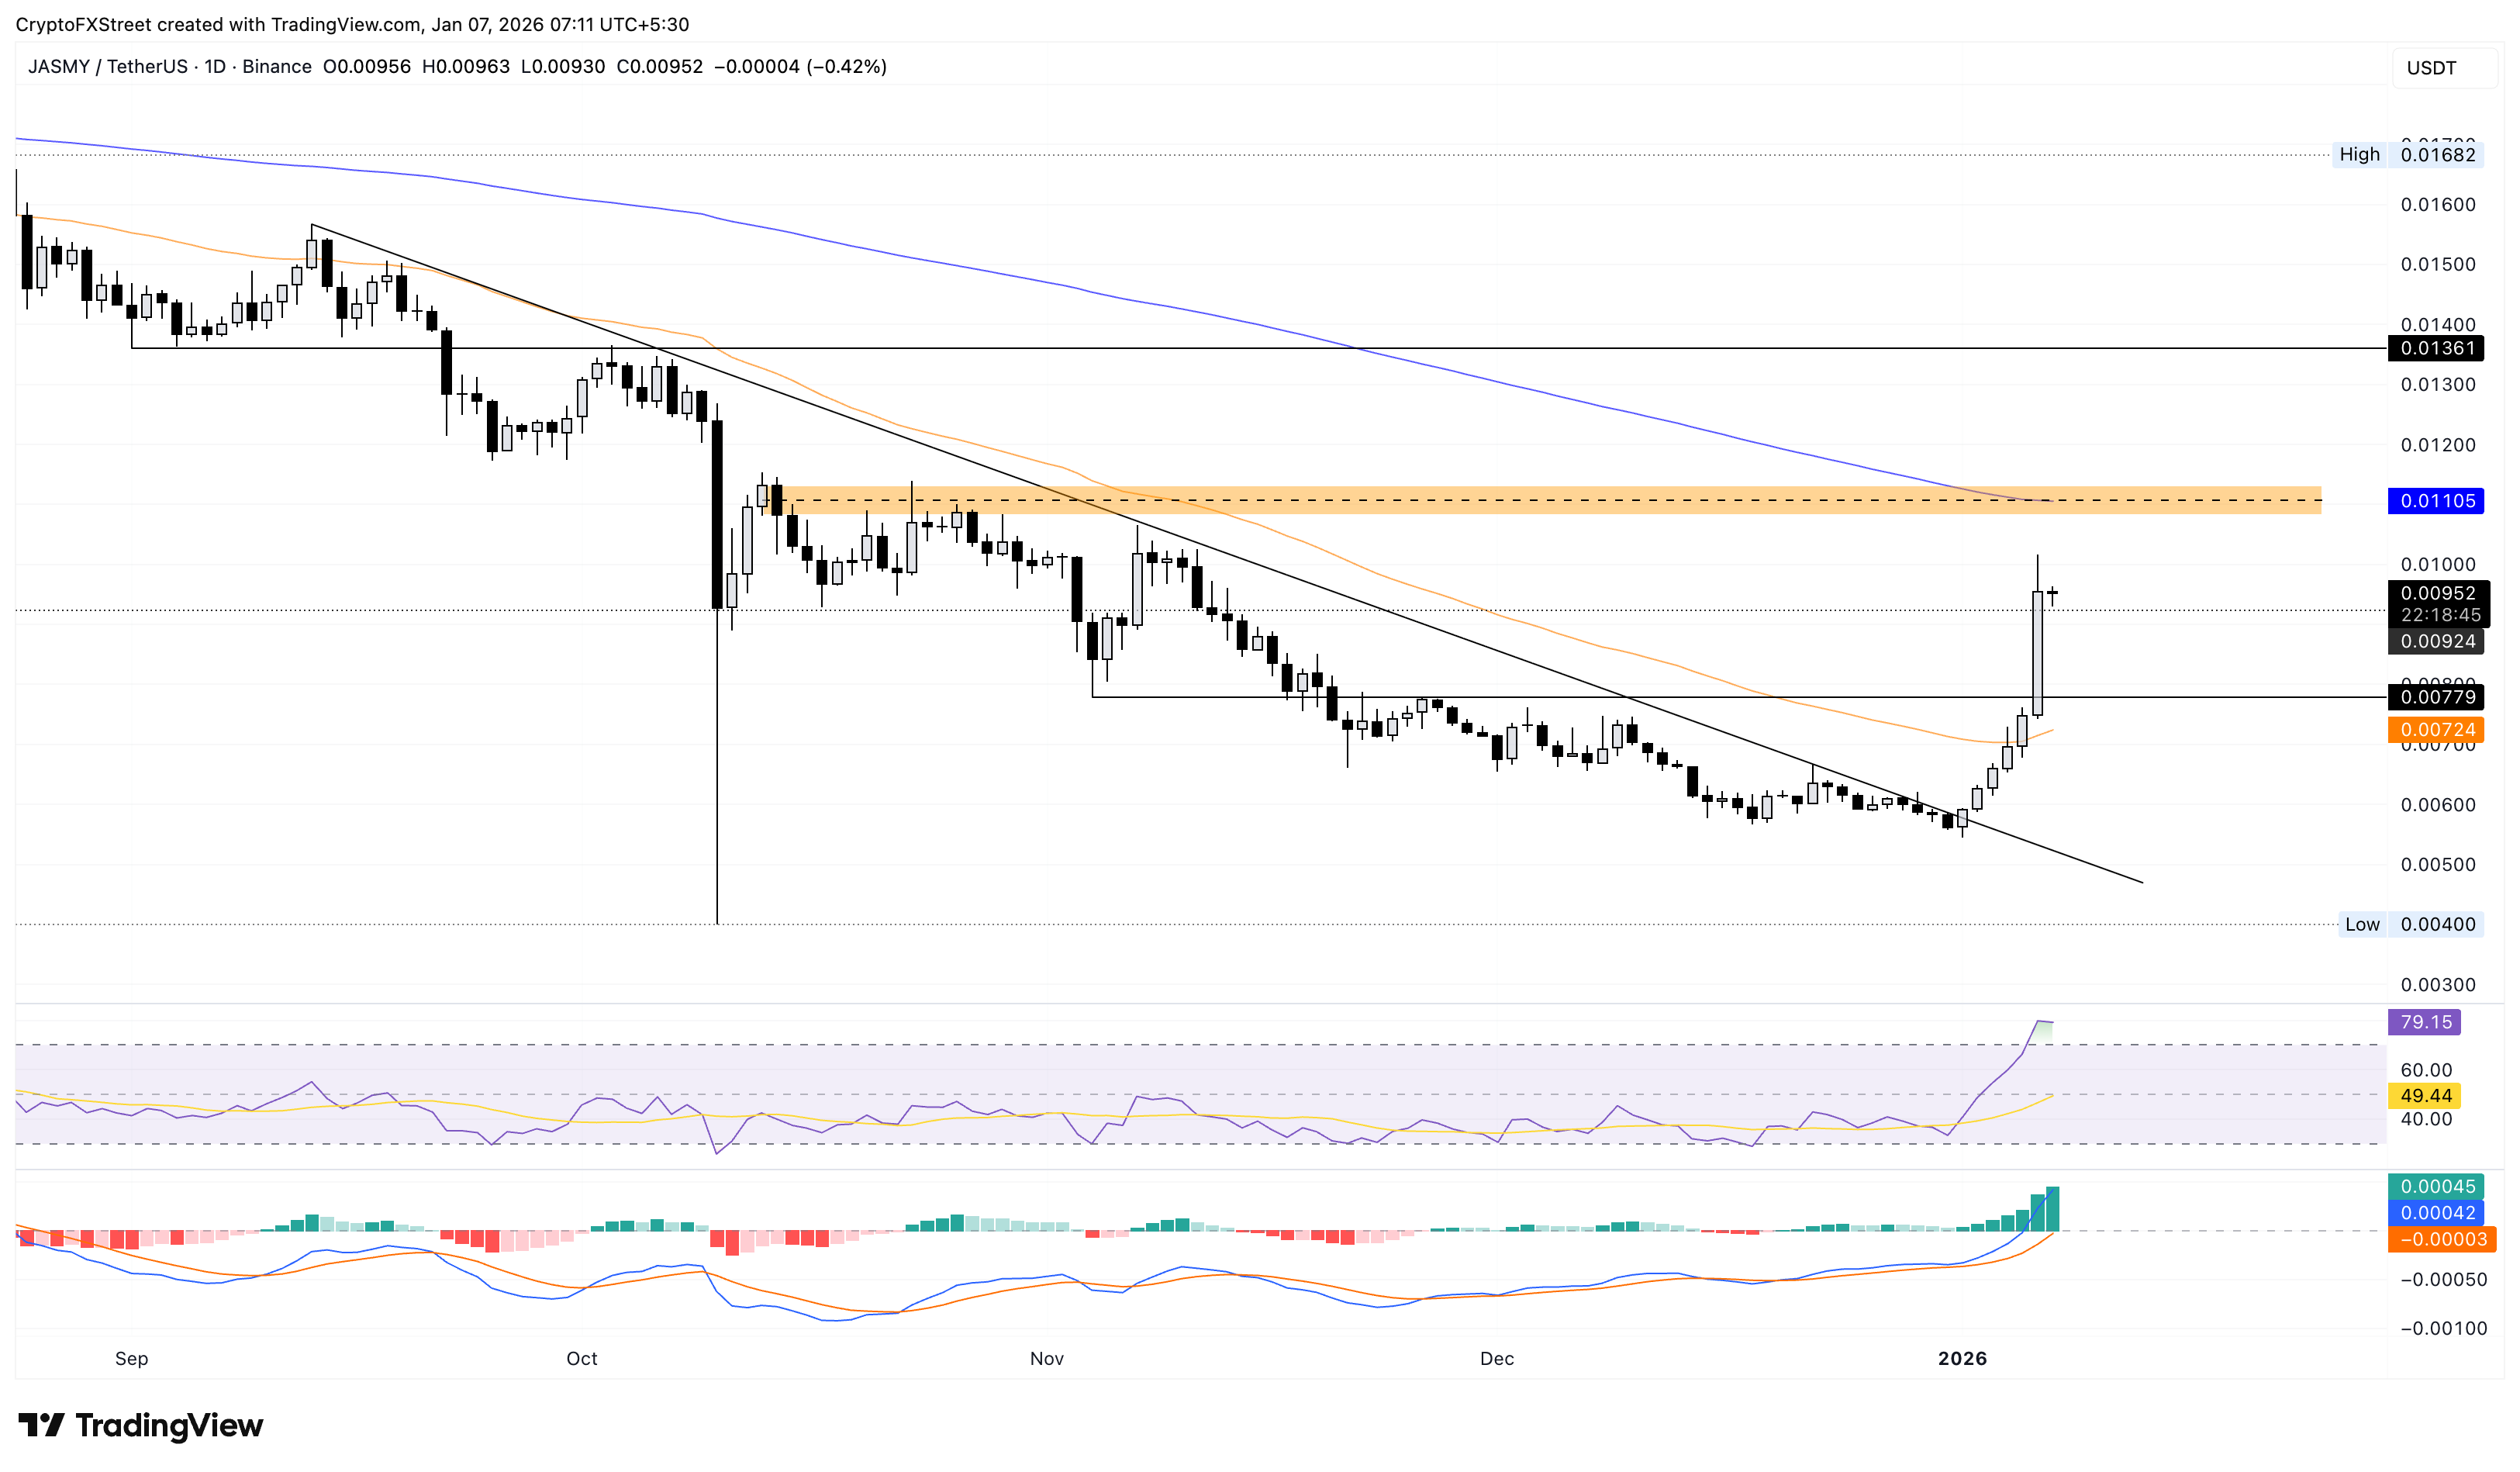
On the flip side, if JASMY reverses from $0.01000, it could retest the $0.00779 level, marked by the November 4 low.

Cosmos fails to extend the six-day recovery

Cosmos edges lower by 2% at the time of writing on Wednesday, halting the six consecutive days of recovery. The intraday pullback approaches the November 4 low at $2.346, close to the 50-day EMA at $2.321.

The momentum indicators on the daily chart are mixed amid the sudden shift of the ATOM price trend. The RSI is at 66, reversing from the overbought boundary, indicating a decline in buying pressure. Meanwhile, the MACD and signal line continue to extend the uptrend, suggesting that the prevailing bullish momentum remains intact.

ATOM/USDT daily price chart.

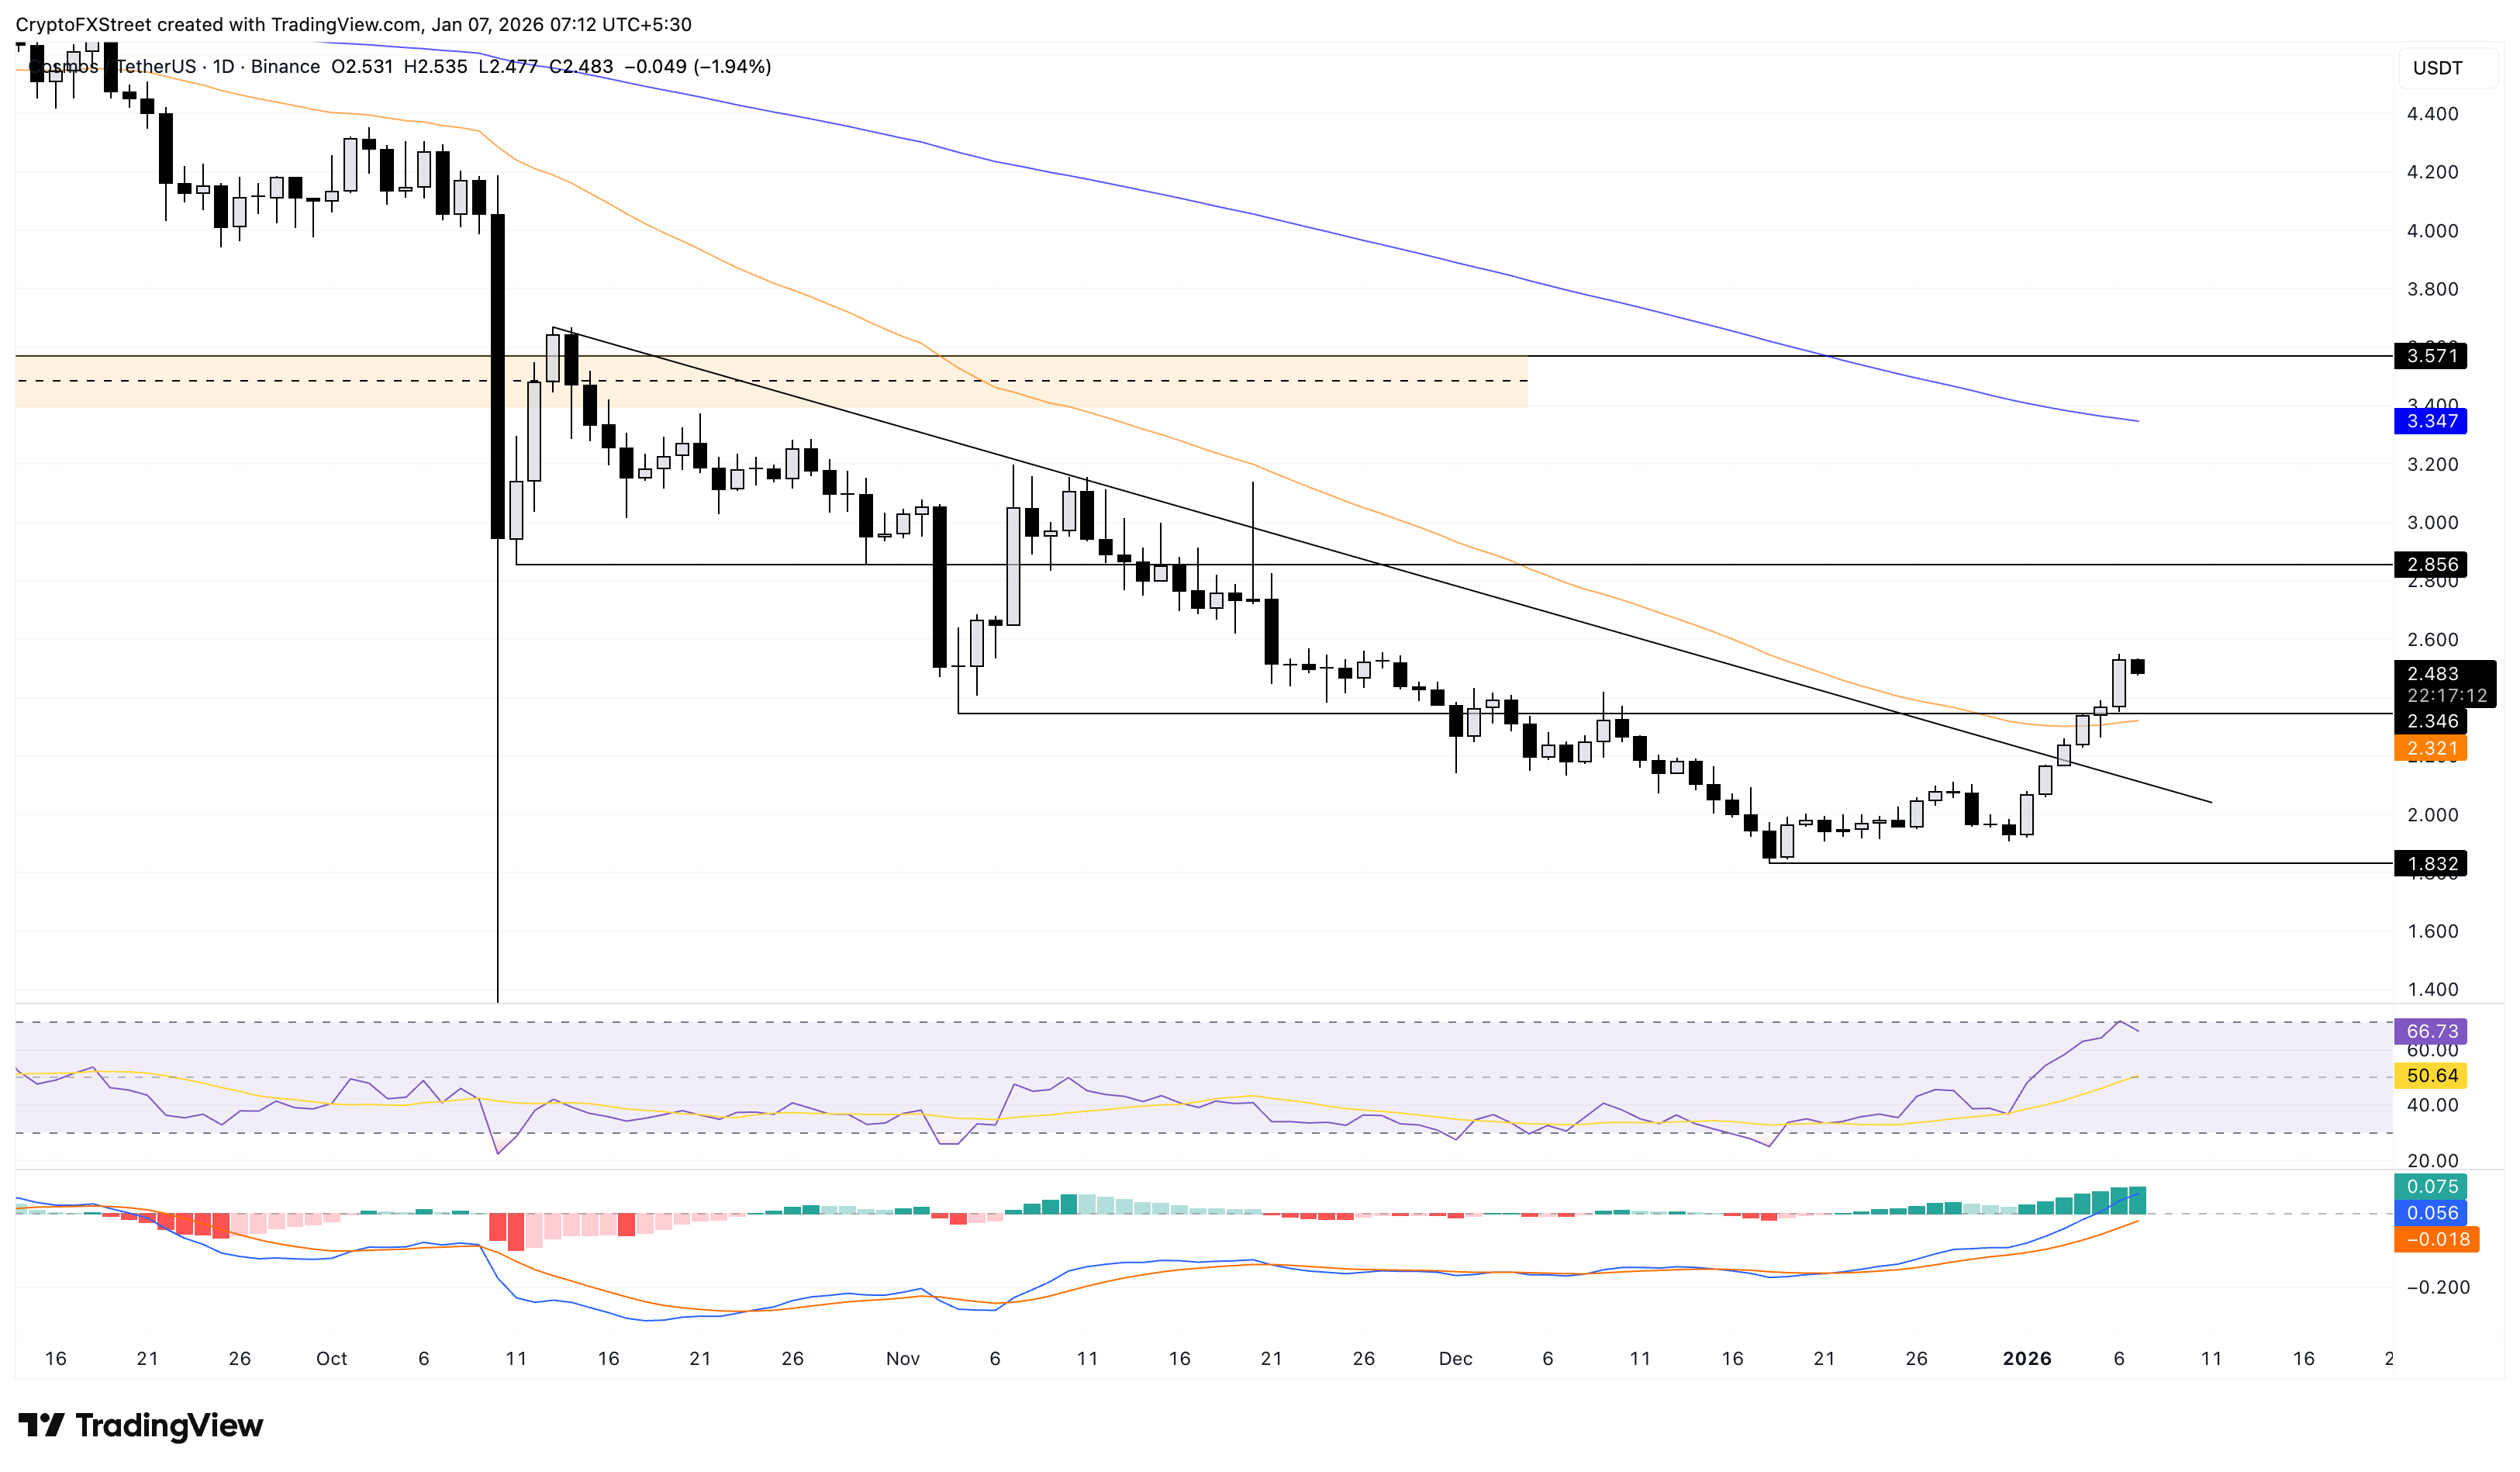
Looking up, the October 11 low at $2.856 serves as the immediate resistance level. 

Bittensor’s recovery falls short of the $300 mark

Bittensor failed to extend the six-day recovery and fell short of the $300 mark. At the time of writing, TAO is down over 3% on Wednesday, approaching the 50-day EMA at $271, slightly above the $260 support level.

If TAO falls below $260, it could extend the decline to the $206 level, marked by the December 24 low.

Similar to Cosmos, the momentum indicators remain mixed, with the RSI at 62 reversing from near the overbought zone, while the MACD and signal line rise.

TAO/USDT daily price chart.

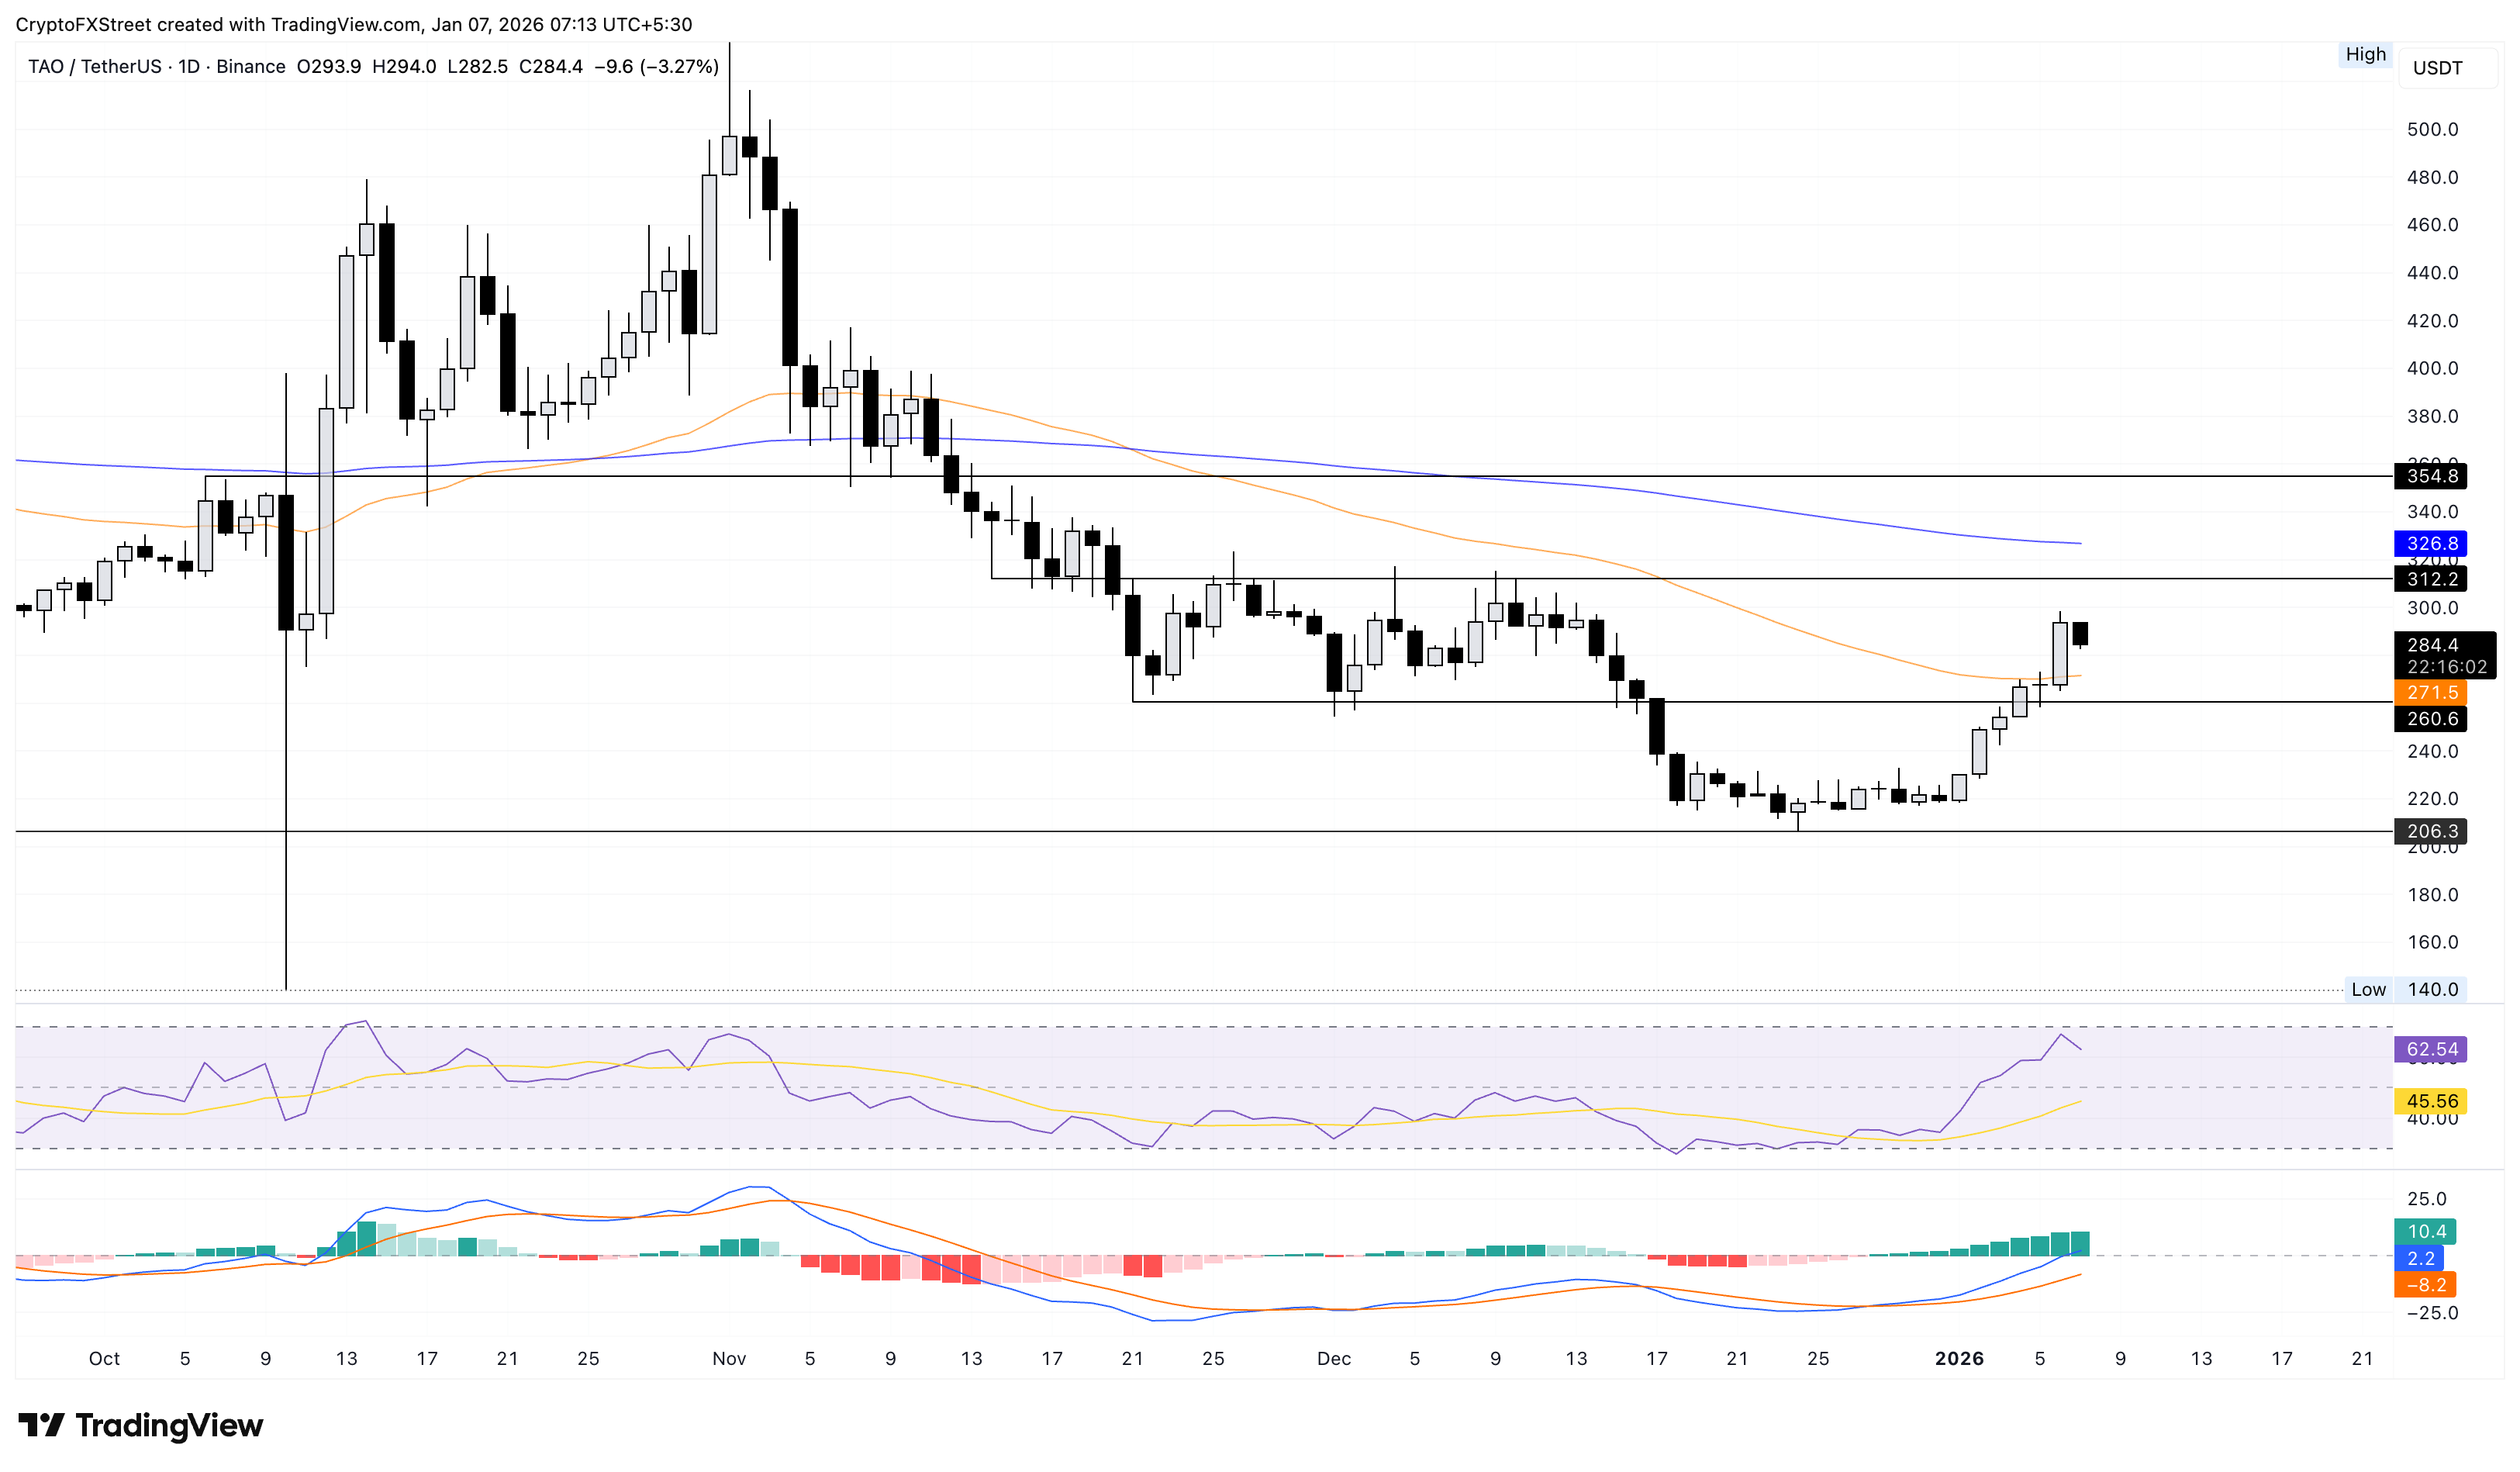
If TAO reclaims $300, it could struggle to exceed the $312 level, last tested on December 12.

Disclaimer: For information purposes only. Past performance is not indicative of future results.
placeholder
My Top 5 Stock Market Predictions for 2026Five 2026 market predictions written in a native, news-style voice: AI’s winners and losers, broader sector leadership, dividend demand, valuation cooling as the Shiller CAPE sits at 39 (Dec. 31, 2025), and quantum-computing bursts—while keeping all original facts and numbers unchanged.
Author  Mitrade
Jan 06, Tue
Five 2026 market predictions written in a native, news-style voice: AI’s winners and losers, broader sector leadership, dividend demand, valuation cooling as the Shiller CAPE sits at 39 (Dec. 31, 2025), and quantum-computing bursts—while keeping all original facts and numbers unchanged.
placeholder
XRP Surges Towards $2.20, Leading Monday Gains as Crypto ETF Flows Tilt in Its FavorXRP rebounds above $2.20 after a 17% weekly surge, supported by $483 million of ETF inflows versus $1.09 billion outflows for Bitcoin ETFs and a $564 million loss for Ethereum products, as traders watch $2.22 resistance and longer-range targets.
Author  Mitrade
Jan 06, Tue
XRP rebounds above $2.20 after a 17% weekly surge, supported by $483 million of ETF inflows versus $1.09 billion outflows for Bitcoin ETFs and a $564 million loss for Ethereum products, as traders watch $2.22 resistance and longer-range targets.
placeholder
Silver Price Analysis: XAG/USD explodes above $80 as rally extendsSilver (XAG/USD) continues to rise parabolically, up more than 5%, trading above the $80.00 threshold a troy ounce, despite rising US Treasury yields and a strong US Dollar.
Author  FXStreet
Yesterday 01: 38
Silver (XAG/USD) continues to rise parabolically, up more than 5%, trading above the $80.00 threshold a troy ounce, despite rising US Treasury yields and a strong US Dollar.
placeholder
Solana’s 2025 Review Flags Fresh Records Across Revenue, Wallet Activity and DEX VolumeSolana’s 2025 annual review reports fresh all-time highs across app revenue, wallet activity and trading—highlighting $2.39 billion in app revenue, $1.5 trillion in DEX volume and $1.02 billion in ETF net inflows as SOL trades at $138.50, still 50% below its $293 peak.
Author  Mitrade
21 hours ago
Solana’s 2025 annual review reports fresh all-time highs across app revenue, wallet activity and trading—highlighting $2.39 billion in app revenue, $1.5 trillion in DEX volume and $1.02 billion in ETF net inflows as SOL trades at $138.50, still 50% below its $293 peak.
placeholder
Gold Price Forecast: XAU/USD declines to near $4,450 as safe-haven demand eases Gold price (XAU/USD) declines to near $4,450 during the early Asian trading hours on Thursday. The precious metal loses momentum as traders book profits after a recent rally. Later on Thursday, the weekly US Initial Jobless Claims data will be released.
Author  FXStreet
2 hours ago
Gold price (XAU/USD) declines to near $4,450 during the early Asian trading hours on Thursday. The precious metal loses momentum as traders book profits after a recent rally. Later on Thursday, the weekly US Initial Jobless Claims data will be released.
goTop
quote