Ripple Price Forecast: XRP holds $1.82 support as low retail demand weighs on the token

Source Fxstreet
  • XRP remains above $1.82 support amid persistent bearish signals and a 14% downward risk.
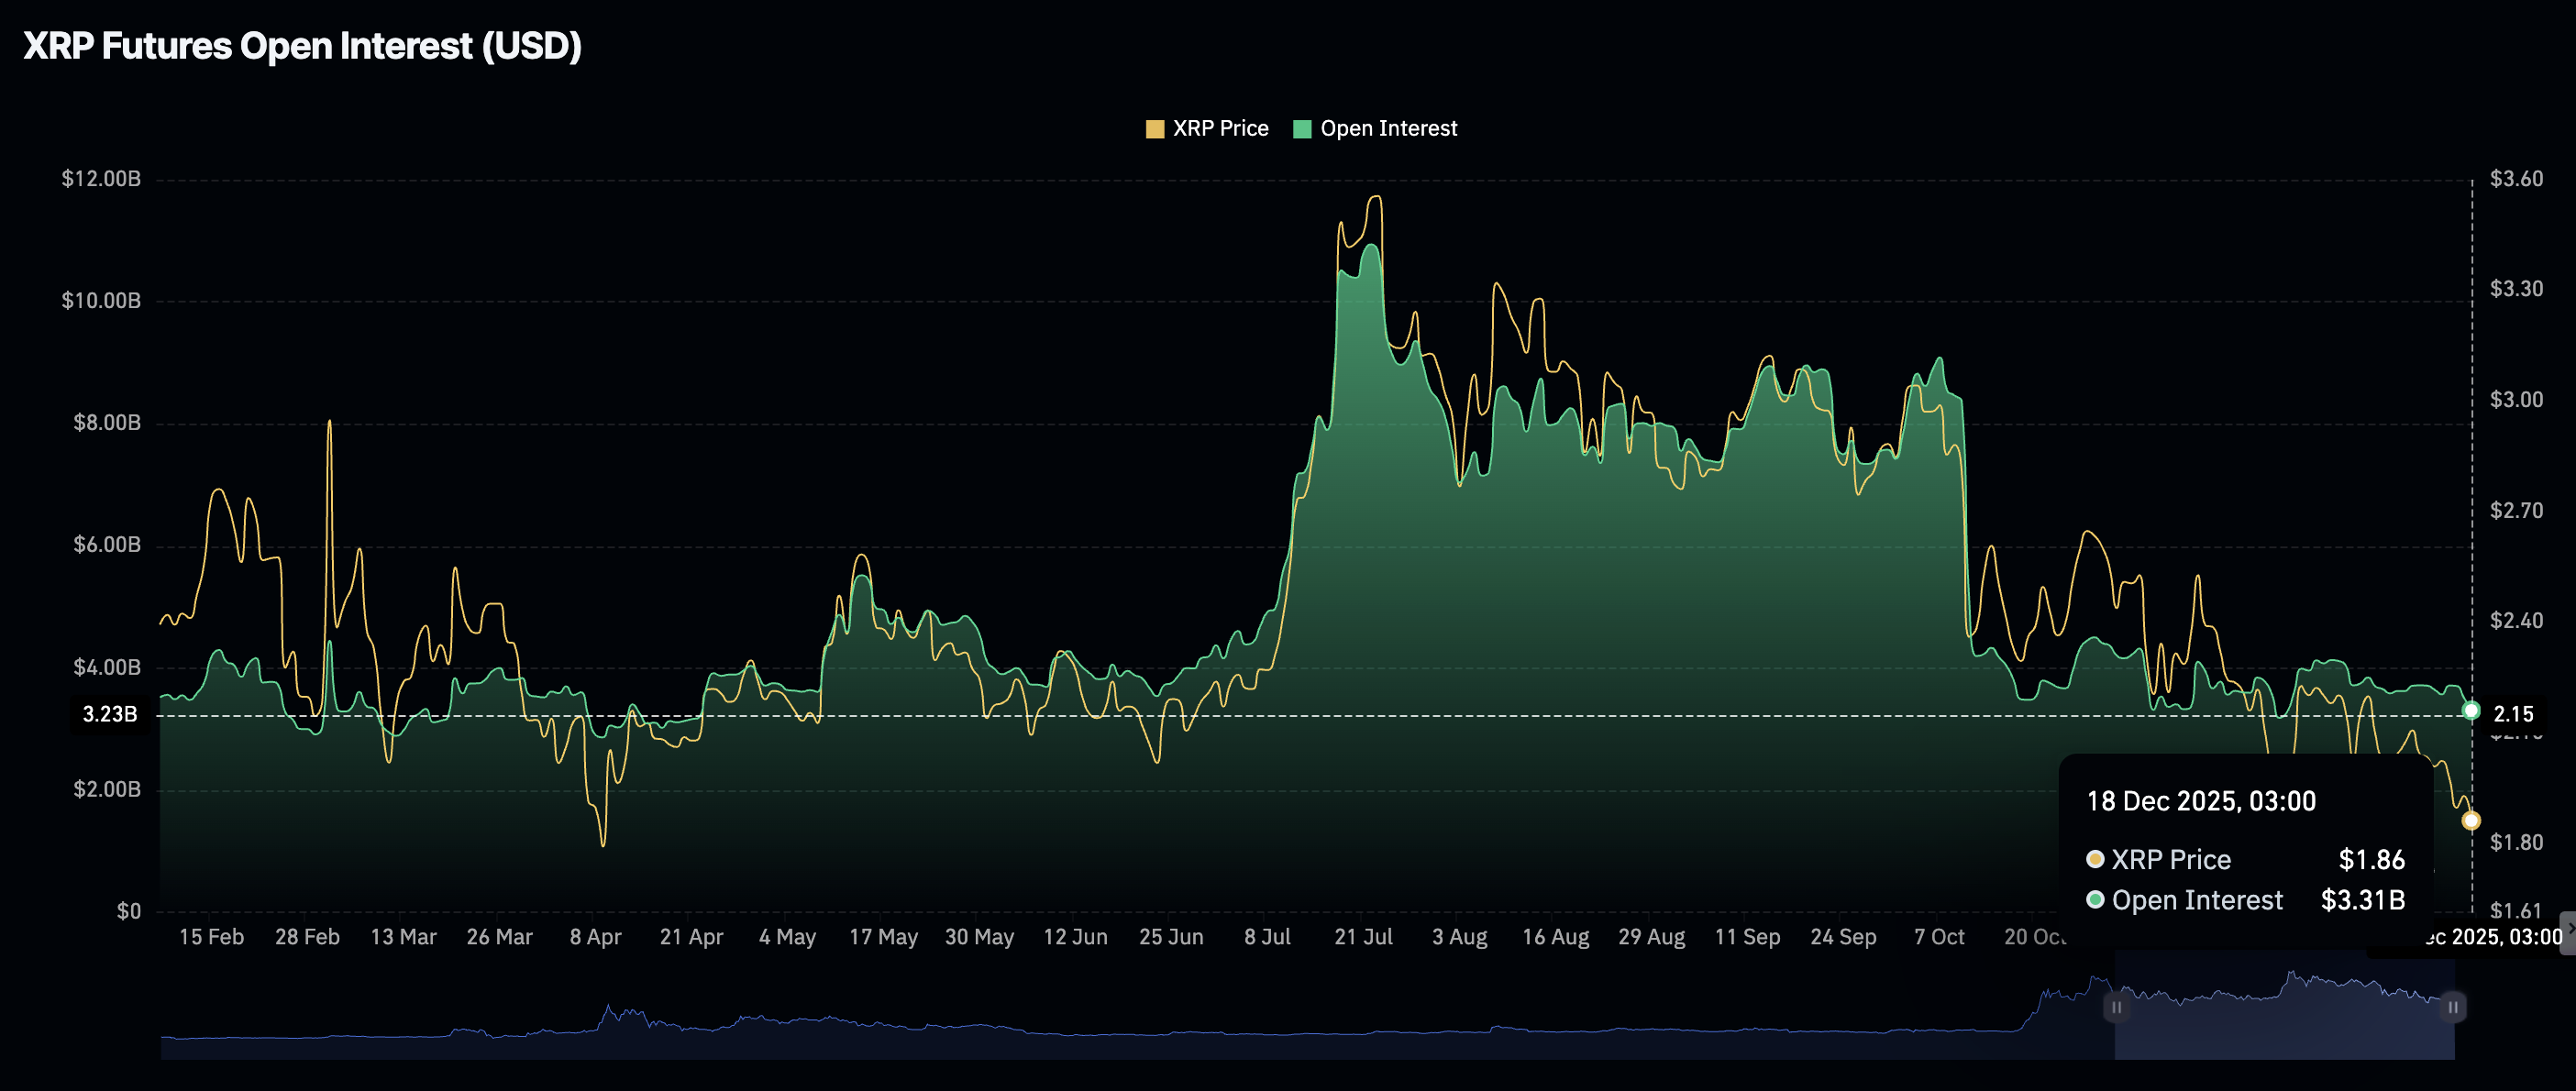
  • Retail demand dwindles, as reflected by futures Open Interest shrinking to $3.31 billion.
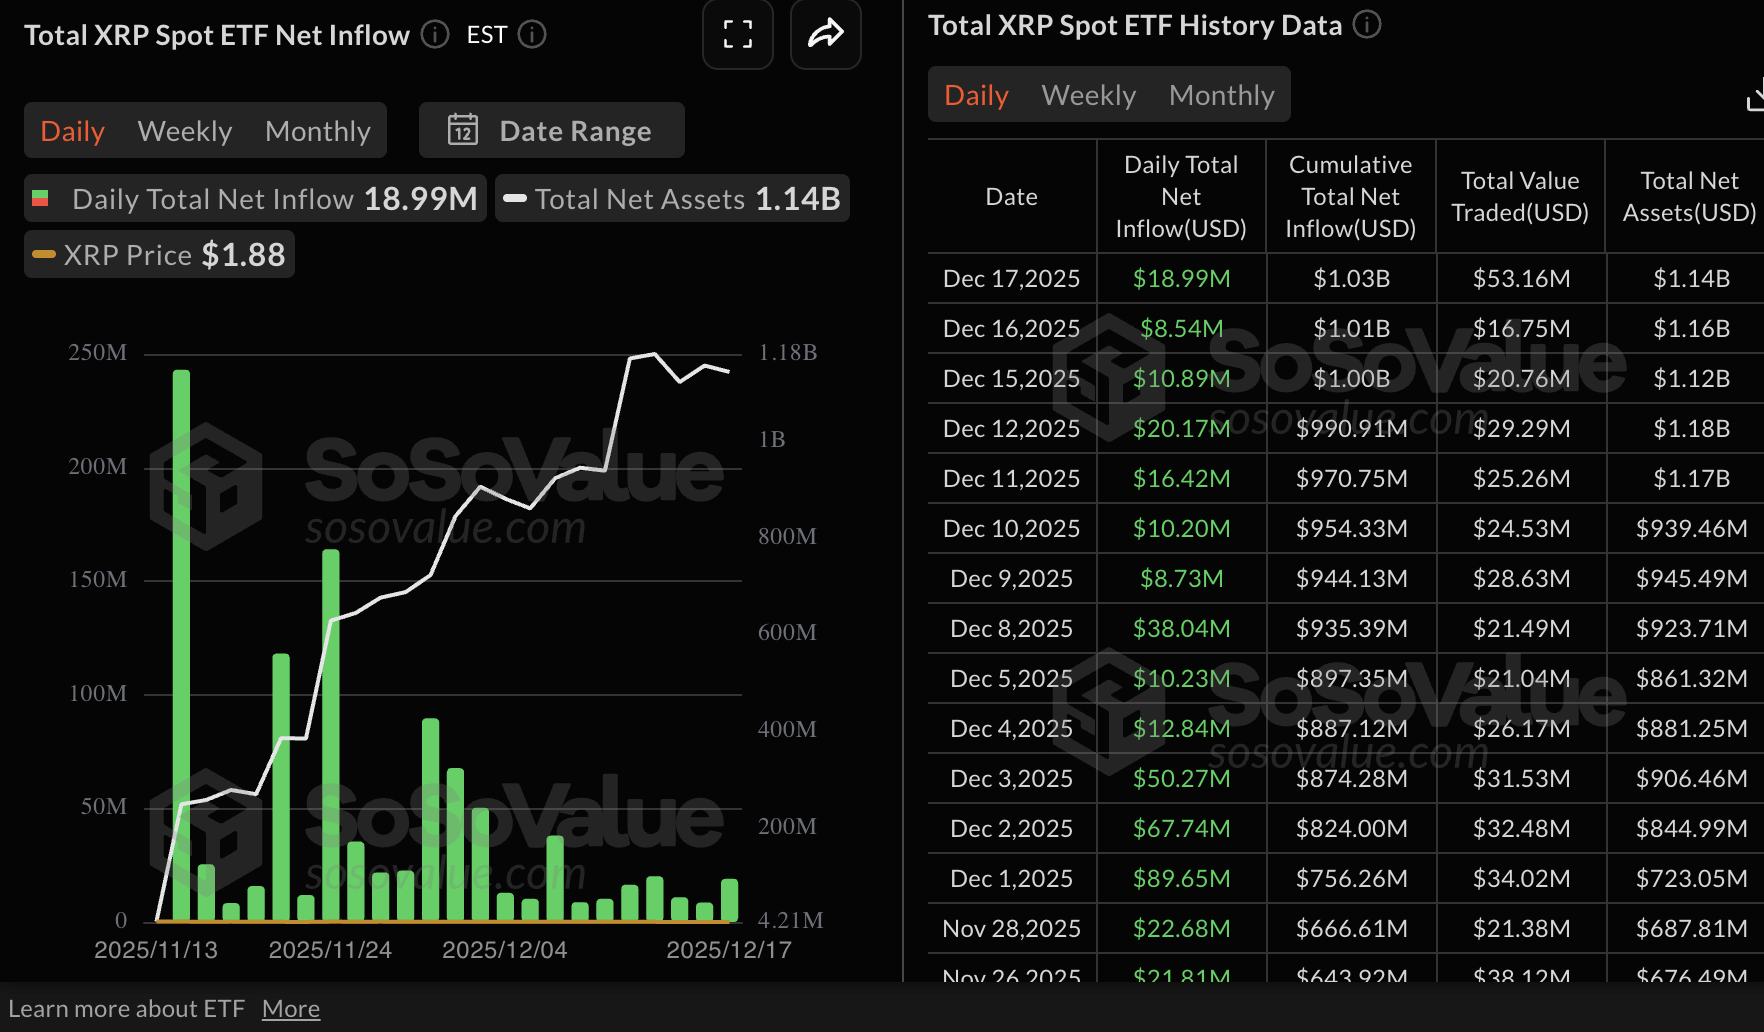
  • XRP’s $18 million inflow into US-listed ETFs fails to trigger a price recovery, signaling broader risk-off sentiment.

Ripple (XRP) is trading between a key support at $1.82 and resistance at $2.00 at the time of writing on Thursday, reflecting the lethargic sentiment in the broader cryptocurrency market.

Despite the cross-border token holding above the immediate support, which was also tested on November 21, the overall outlook remains bearish, as reflected by waning retail interest.

XRP falters as retail demand narrows

XRP is facing a significant drop in retail interest, which is negatively affecting the derivatives market and, on a larger scale, triggering frequent sell-offs. CoinGlass data shows futures Open Interest (OI) at $3.31 billion on Thursday, down from $3.52 billion the previous day and $3.71 billion on Tuesday.

Since the October 10 flash crash, the derivatives market has remained significantly suppressed, with OI fluctuating between $3 billion and $4 billion. Before the deleveraging event, OI stood at $8.36 billion, which emphasizes the prevailing low retail interest and demand.

A sustained uptick in the OI is needed to support steady price increases. Otherwise, recovery could remain a pipe dream, as investors stay on the sidelines.

XRP Open Interest | Source: CoinGlass

On the other hand, institutional investors have, since the debut of XRP spot Exchange Traded Funds (ETFs) in the United States (US), shown immense interest in the token, characterised by persistent inflows.

XRP ETFs recorded approximately $18 million in inflows on Wednesday, a significant increase from the $8.5 million posted on Tuesday. The cumulative net inflow stands at $1.03 billion, with net assets at $1.14 billion, according to SoSoValue data.

Steady ETF inflows support positive sentiment, potentially making XRP attractive not only to institutional investors but also to retail traders.

XRP ETF stats | Source: SoSoValue

Technical outlook: XRP trades under pressure as downside risks escalate

XRP is trading above support at $1.82 at the time of writing, while its upside has been capped below $2.00. The token also sits below the downtrending 50-day Exponential Moving Average (EMA) at $2.17, the 100-day EMA at $2.35 and the 200-day EMA at $2.43, affirming the bearish outlook.

The Moving Average Convergence Divergence (MACD) indicator on the daily chart has maintained a sell signal since Tuesday, prompting investors to reduce exposure. Red histogram bars below the mean line are expanding, suggesting that sellers have the upper hand.

Although the Relative Strength Index (RSI) on the same chart has stabilized at 35, it remains within the bearish region. If the RSI declines further into oversold territory, headwinds may trigger a 14% correction to XRP toward April’s low of $1.61.

XRP/USDT daily chart

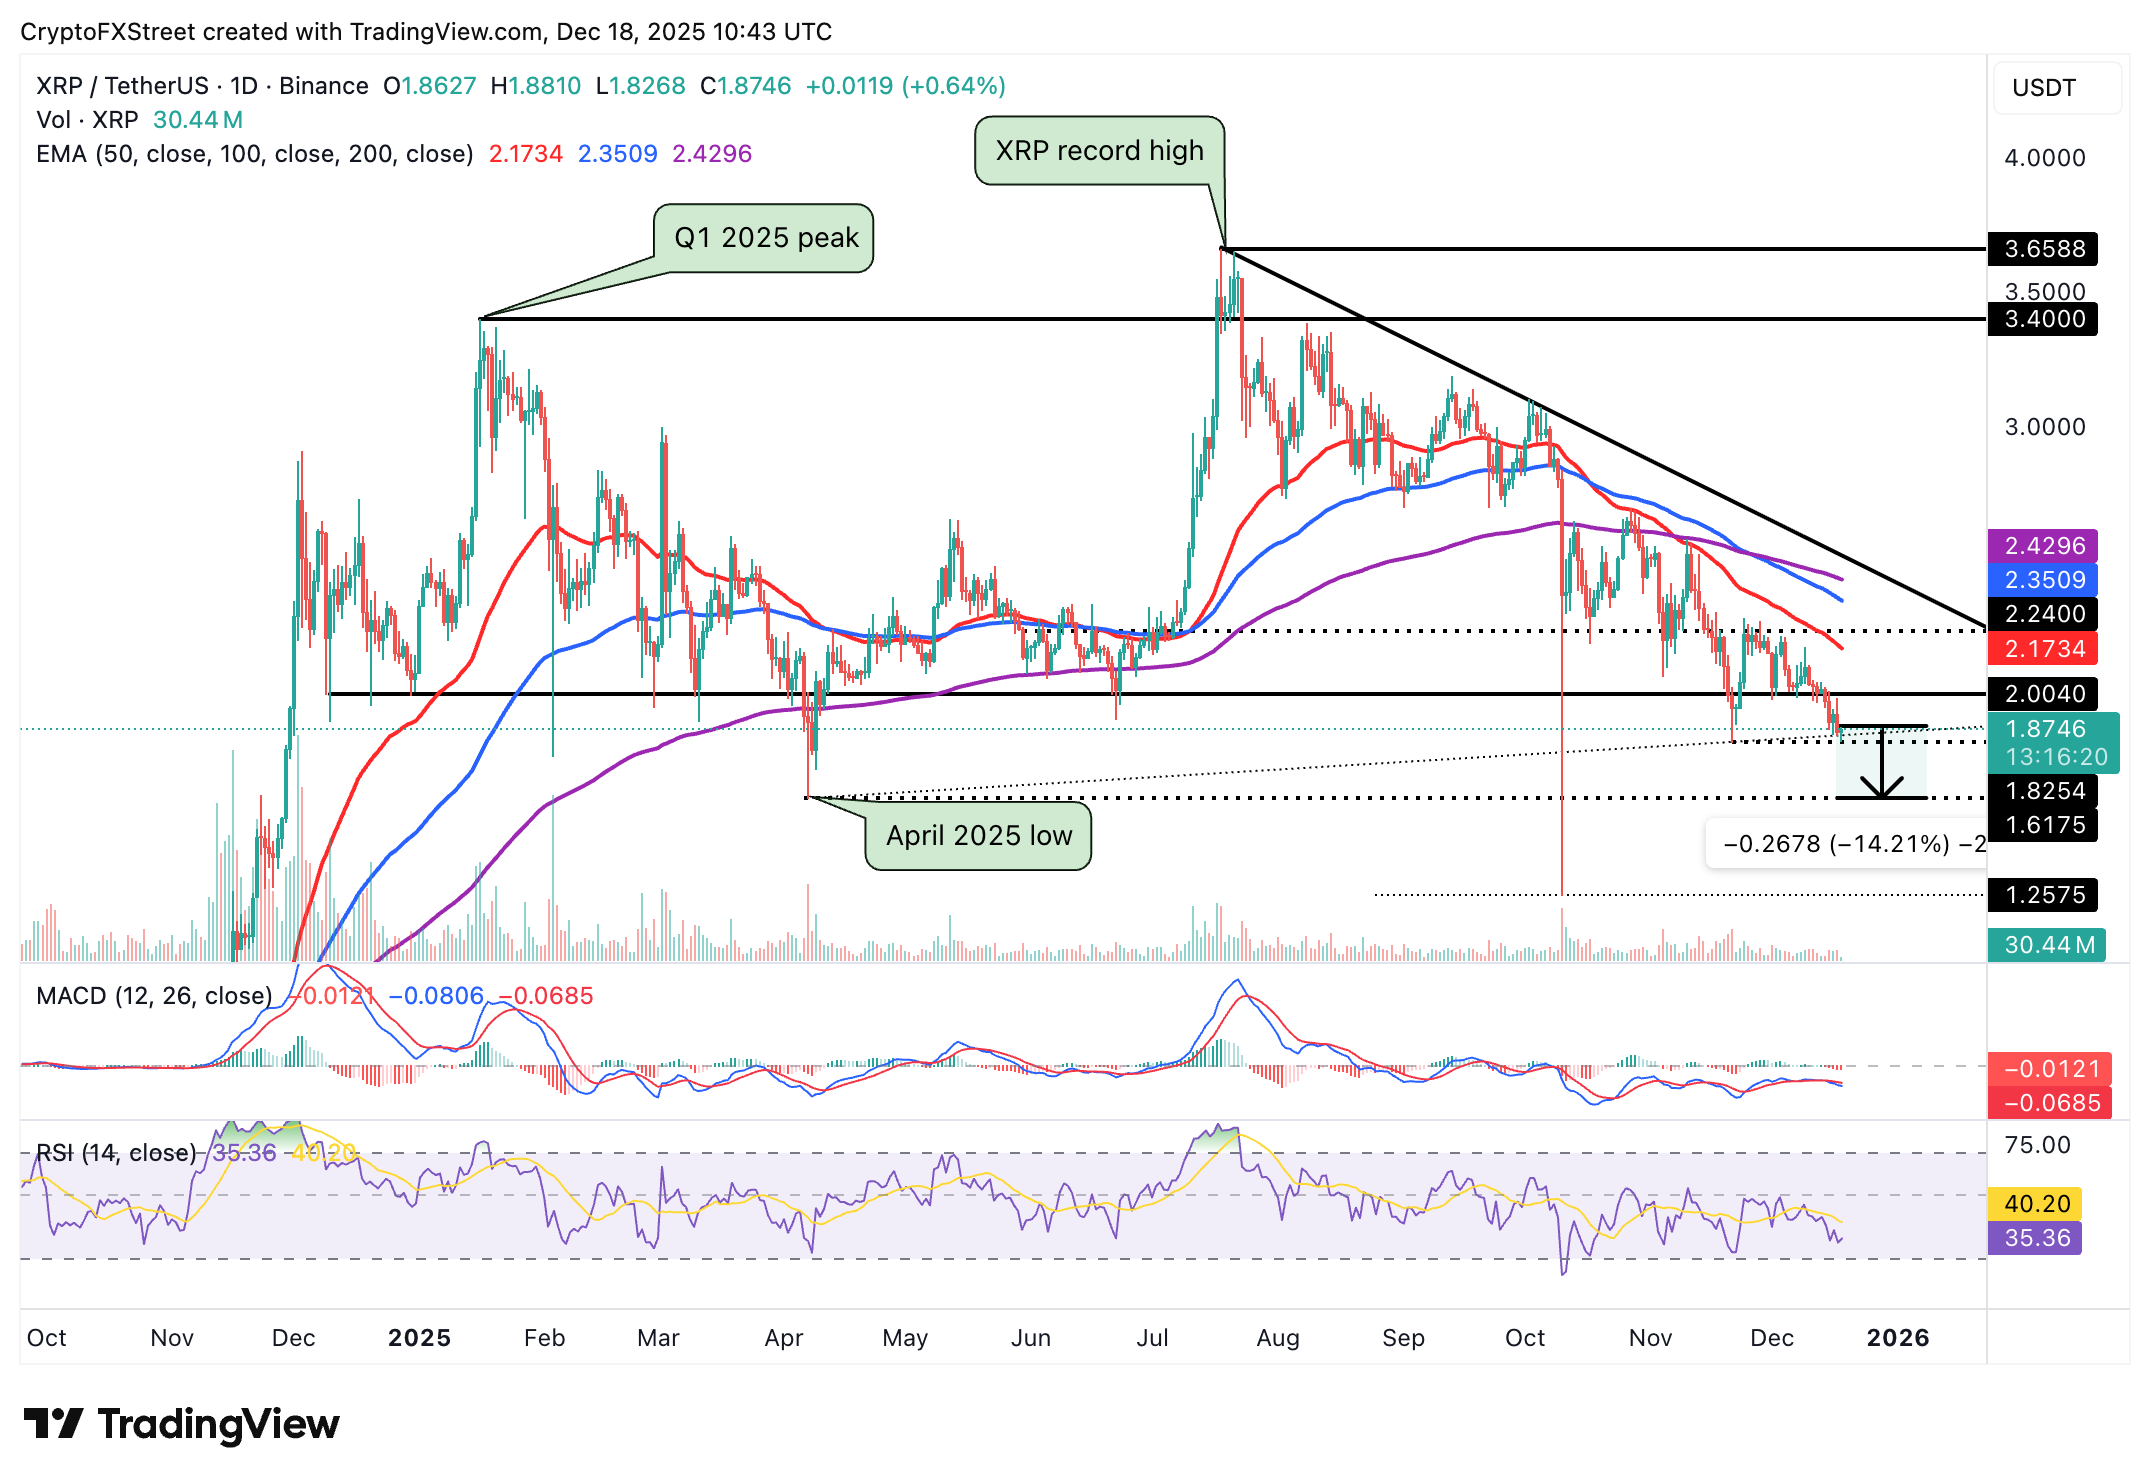
Still, the immediate support at $1.82 could work as a shield against further selling, prompting investors to increase exposure. A close above $2.00 could mark the first step toward a potential bullish turnaround. The 50-day EMA at $2.17 should be reclaimed as support, bolstering a bullish outlook above the descending trendline.

Crypto ETF FAQs

An Exchange-Traded Fund (ETF) is an investment vehicle or an index that tracks the price of an underlying asset. ETFs can not only track a single asset, but a group of assets and sectors. For example, a Bitcoin ETF tracks Bitcoin’s price. ETF is a tool used by investors to gain exposure to a certain asset.

Yes. The first Bitcoin futures ETF in the US was approved by the US Securities & Exchange Commission in October 2021. A total of seven Bitcoin futures ETFs have been approved, with more than 20 still waiting for the regulator’s permission. The SEC says that the cryptocurrency industry is new and subject to manipulation, which is why it has been delaying crypto-related futures ETFs for the last few years.

Yes. The SEC approved in January 2024 the listing and trading of several Bitcoin spot Exchange-Traded Funds, opening the door to institutional capital and mainstream investors to trade the main crypto currency. The decision was hailed by the industry as a game changer.

The main advantage of crypto ETFs is the possibility of gaining exposure to a cryptocurrency without ownership, reducing the risk and cost of holding the asset. Other pros are a lower learning curve and higher security for investors since ETFs take charge of securing the underlying asset holdings. As for the main drawbacks, the main one is that as an investor you can’t have direct ownership of the asset, or, as they say in crypto, “not your keys, not your coins.” Other disadvantages are higher costs associated with holding crypto since ETFs charge fees for active management. Finally, even though investing in ETFs reduces the risk of holding an asset, price swings in the underlying cryptocurrency are likely to be reflected in the investment vehicle too.


Disclaimer: For information purposes only. Past performance is not indicative of future results.
placeholder
Ethereum Price Slips Lower — $3,000 Looms as the Key BattlegroundEthereum is attempting to recover from a $3,026 low but remains below $3,200 and the 100-hour SMA, with a bearish trend line near $3,175 capping rebounds as bulls need a clean break above $3,200 to target $3,250–$3,400, while a drop below $3,050 risks a retest of $3,000 and $2,940.
Author  Mitrade
Dec 15, Mon
Ethereum is attempting to recover from a $3,026 low but remains below $3,200 and the 100-hour SMA, with a bearish trend line near $3,175 capping rebounds as bulls need a clean break above $3,200 to target $3,250–$3,400, while a drop below $3,050 risks a retest of $3,000 and $2,940.
placeholder
Bitcoin Slides 5% as Sellers Lean In — Can BTC Reclaim $88,000?Bitcoin has dropped back below $88,000 after rolling over from $90,500, with price still trading under the 100-hour Simple Moving Average. The sell-off found a floor at $85,151, and BTC is now consolidating near that base, but rebounds are facing pressure from a bearish trend line around $89,000. Bulls need to retake $88,000–$89,000 to ease downside risk; failure to do so keeps $85,500–$85,000 and then $83,500 in play, with $80,000 as the deeper “line in the sand.” Bitcoin (BTC) is back in damage-control mode after a sharp pullback wiped out recent gains. The price failed to reclaim the $90,000–$90,500 band, rolled over, and slid through $88,500 before briefly dipping under $87,000. Buyers did show up around $85,000, but the rebound so far looks more like stabilization than a clear trend reversal. Bitcoin dips hard, finds a bid near $85,000(h3) BTC’s latest move lower began when it couldn’t build follow-through above $90,000 and $90,500. Once that upside stalled, sellers took control and pushed price down through $88,500. The slide accelerated enough to spike below $87,000, but the market didn’t free-fall. Bulls defended the $85,000 zone, printing a low at $85,151. Since then, Bitcoin has been consolidating below the 23.6% Fibonacci retracement of the drop from the $93,560 swing high to the $85,151 low — a clue that the bounce is still shallow and that sellers haven’t fully backed off yet. Structurally, BTC is still on the back foot: It’s trading below $88,000, and It remains below the 100-hour Simple Moving Average, keeping short-term trend pressure pointed downward. Resistance is layered, and $89,000 is the problem area(h3) If bulls try to turn this into a recovery, they’ll have to climb through multiple ceilings in quick succession. First, BTC faces resistance around $87,150, followed by a more meaningful barrier near $87,500. From there, the market’s attention snaps back to $88,000 — the level BTC just lost and now needs to reclaim. A close back above $88,000 would improve the tone, but it doesn’t solve the bigger issue: there’s a bearish trend line on the hourly BTC/USD chart (Kraken feed) with resistance near $89,000, which also lines up with the next technical hurdle. If BTC can push through $89,000 and hold, the rebound could extend toward $90,000, with follow-through targets at $91,000 and $91,500. But until price clears that $88,000–$89,000 zone, rallies are at risk of being sold rather than chased. If BTC fails to reclaim resistance, the downside path is clear(h3) The near-term bear case is simple: if Bitcoin can’t climb back above the $87,000 area and keep traction, sellers may attempt another leg lower. Support levels line up like this: Immediate support: $85,500 First major support: $85,000 Next support: $83,500 Then $82,500 in the near term Below that, the major “don’t break this” level is still $80,000. If BTC slips under $80,000, the risk of acceleration to the downside increases significantly — not because it’s magic, but because it’s the kind of psychological and structural level that tends to trigger forced de-risking. Indicators: momentum still leans bearish(h3) The intraday indicators aren’t offering much comfort yet: Hourly MACD is losing pace in the bearish zone. Hourly RSI remains below 50, suggesting sellers still have the upper hand on short timeframes. So while the $85,000 defense held for now, the market hasn’t flipped bullish — it’s just stopped bleeding.
Author  Mitrade
Dec 16, Tue
Bitcoin has dropped back below $88,000 after rolling over from $90,500, with price still trading under the 100-hour Simple Moving Average. The sell-off found a floor at $85,151, and BTC is now consolidating near that base, but rebounds are facing pressure from a bearish trend line around $89,000. Bulls need to retake $88,000–$89,000 to ease downside risk; failure to do so keeps $85,500–$85,000 and then $83,500 in play, with $80,000 as the deeper “line in the sand.” Bitcoin (BTC) is back in damage-control mode after a sharp pullback wiped out recent gains. The price failed to reclaim the $90,000–$90,500 band, rolled over, and slid through $88,500 before briefly dipping under $87,000. Buyers did show up around $85,000, but the rebound so far looks more like stabilization than a clear trend reversal. Bitcoin dips hard, finds a bid near $85,000(h3) BTC’s latest move lower began when it couldn’t build follow-through above $90,000 and $90,500. Once that upside stalled, sellers took control and pushed price down through $88,500. The slide accelerated enough to spike below $87,000, but the market didn’t free-fall. Bulls defended the $85,000 zone, printing a low at $85,151. Since then, Bitcoin has been consolidating below the 23.6% Fibonacci retracement of the drop from the $93,560 swing high to the $85,151 low — a clue that the bounce is still shallow and that sellers haven’t fully backed off yet. Structurally, BTC is still on the back foot: It’s trading below $88,000, and It remains below the 100-hour Simple Moving Average, keeping short-term trend pressure pointed downward. Resistance is layered, and $89,000 is the problem area(h3) If bulls try to turn this into a recovery, they’ll have to climb through multiple ceilings in quick succession. First, BTC faces resistance around $87,150, followed by a more meaningful barrier near $87,500. From there, the market’s attention snaps back to $88,000 — the level BTC just lost and now needs to reclaim. A close back above $88,000 would improve the tone, but it doesn’t solve the bigger issue: there’s a bearish trend line on the hourly BTC/USD chart (Kraken feed) with resistance near $89,000, which also lines up with the next technical hurdle. If BTC can push through $89,000 and hold, the rebound could extend toward $90,000, with follow-through targets at $91,000 and $91,500. But until price clears that $88,000–$89,000 zone, rallies are at risk of being sold rather than chased. If BTC fails to reclaim resistance, the downside path is clear(h3) The near-term bear case is simple: if Bitcoin can’t climb back above the $87,000 area and keep traction, sellers may attempt another leg lower. Support levels line up like this: Immediate support: $85,500 First major support: $85,000 Next support: $83,500 Then $82,500 in the near term Below that, the major “don’t break this” level is still $80,000. If BTC slips under $80,000, the risk of acceleration to the downside increases significantly — not because it’s magic, but because it’s the kind of psychological and structural level that tends to trigger forced de-risking. Indicators: momentum still leans bearish(h3) The intraday indicators aren’t offering much comfort yet: Hourly MACD is losing pace in the bearish zone. Hourly RSI remains below 50, suggesting sellers still have the upper hand on short timeframes. So while the $85,000 defense held for now, the market hasn’t flipped bullish — it’s just stopped bleeding.
placeholder
December Santa Claus Rally: New highs in sight for US and European stocks?Historical data show a rising trend of US and European stocks in December. If the momentum is strong, fund managers may rush in with a buying frenzy.
Author  Mitrade
Yesterday 02: 50
Historical data show a rising trend of US and European stocks in December. If the momentum is strong, fund managers may rush in with a buying frenzy.
placeholder
XRP’s Price Action Flashes a Warning Even as ETF Flows Stay PositiveXRP’s structure remains weak despite 18 straight positive closes in spot XRP ETFs, with analysts warning that $1.98 and other nearby resistance zones could cap rebounds unless the YO region is reclaimed, while deeper downside scenarios keep $1.53 on watch as a potential (not guaranteed) accumulation area.
Author  Mitrade
Yesterday 06: 37
XRP’s structure remains weak despite 18 straight positive closes in spot XRP ETFs, with analysts warning that $1.98 and other nearby resistance zones could cap rebounds unless the YO region is reclaimed, while deeper downside scenarios keep $1.53 on watch as a potential (not guaranteed) accumulation area.
placeholder
Gold declines on profit-taking, USD strength ahead of US CPI releaseGold price (XAU/USD) edges lower below $4,350 during the Asian trading hours on Thursday. The precious metal retreats from seven-week highs amid some profit-taking and a rebound in the US Dollar (USD).
Author  FXStreet
7 hours ago
Gold price (XAU/USD) edges lower below $4,350 during the Asian trading hours on Thursday. The precious metal retreats from seven-week highs amid some profit-taking and a rebound in the US Dollar (USD).
goTop
quote