Aster Price Forecast: ASTER declines for fifth straight day despite buyback efforts

Source Fxstreet
  • Aster is down 3% on Thursday, extending the previous day's 10% decline to print its fifth straight day of losses.
  • Aster's buyback program resumed on Wednesday, funded by the previous day's Stage 4 fee revenue, and will continue through the end of the same on Sunday.
  • On-chain data shows steady dip-buying from large-wallet investors as retail demand falters.

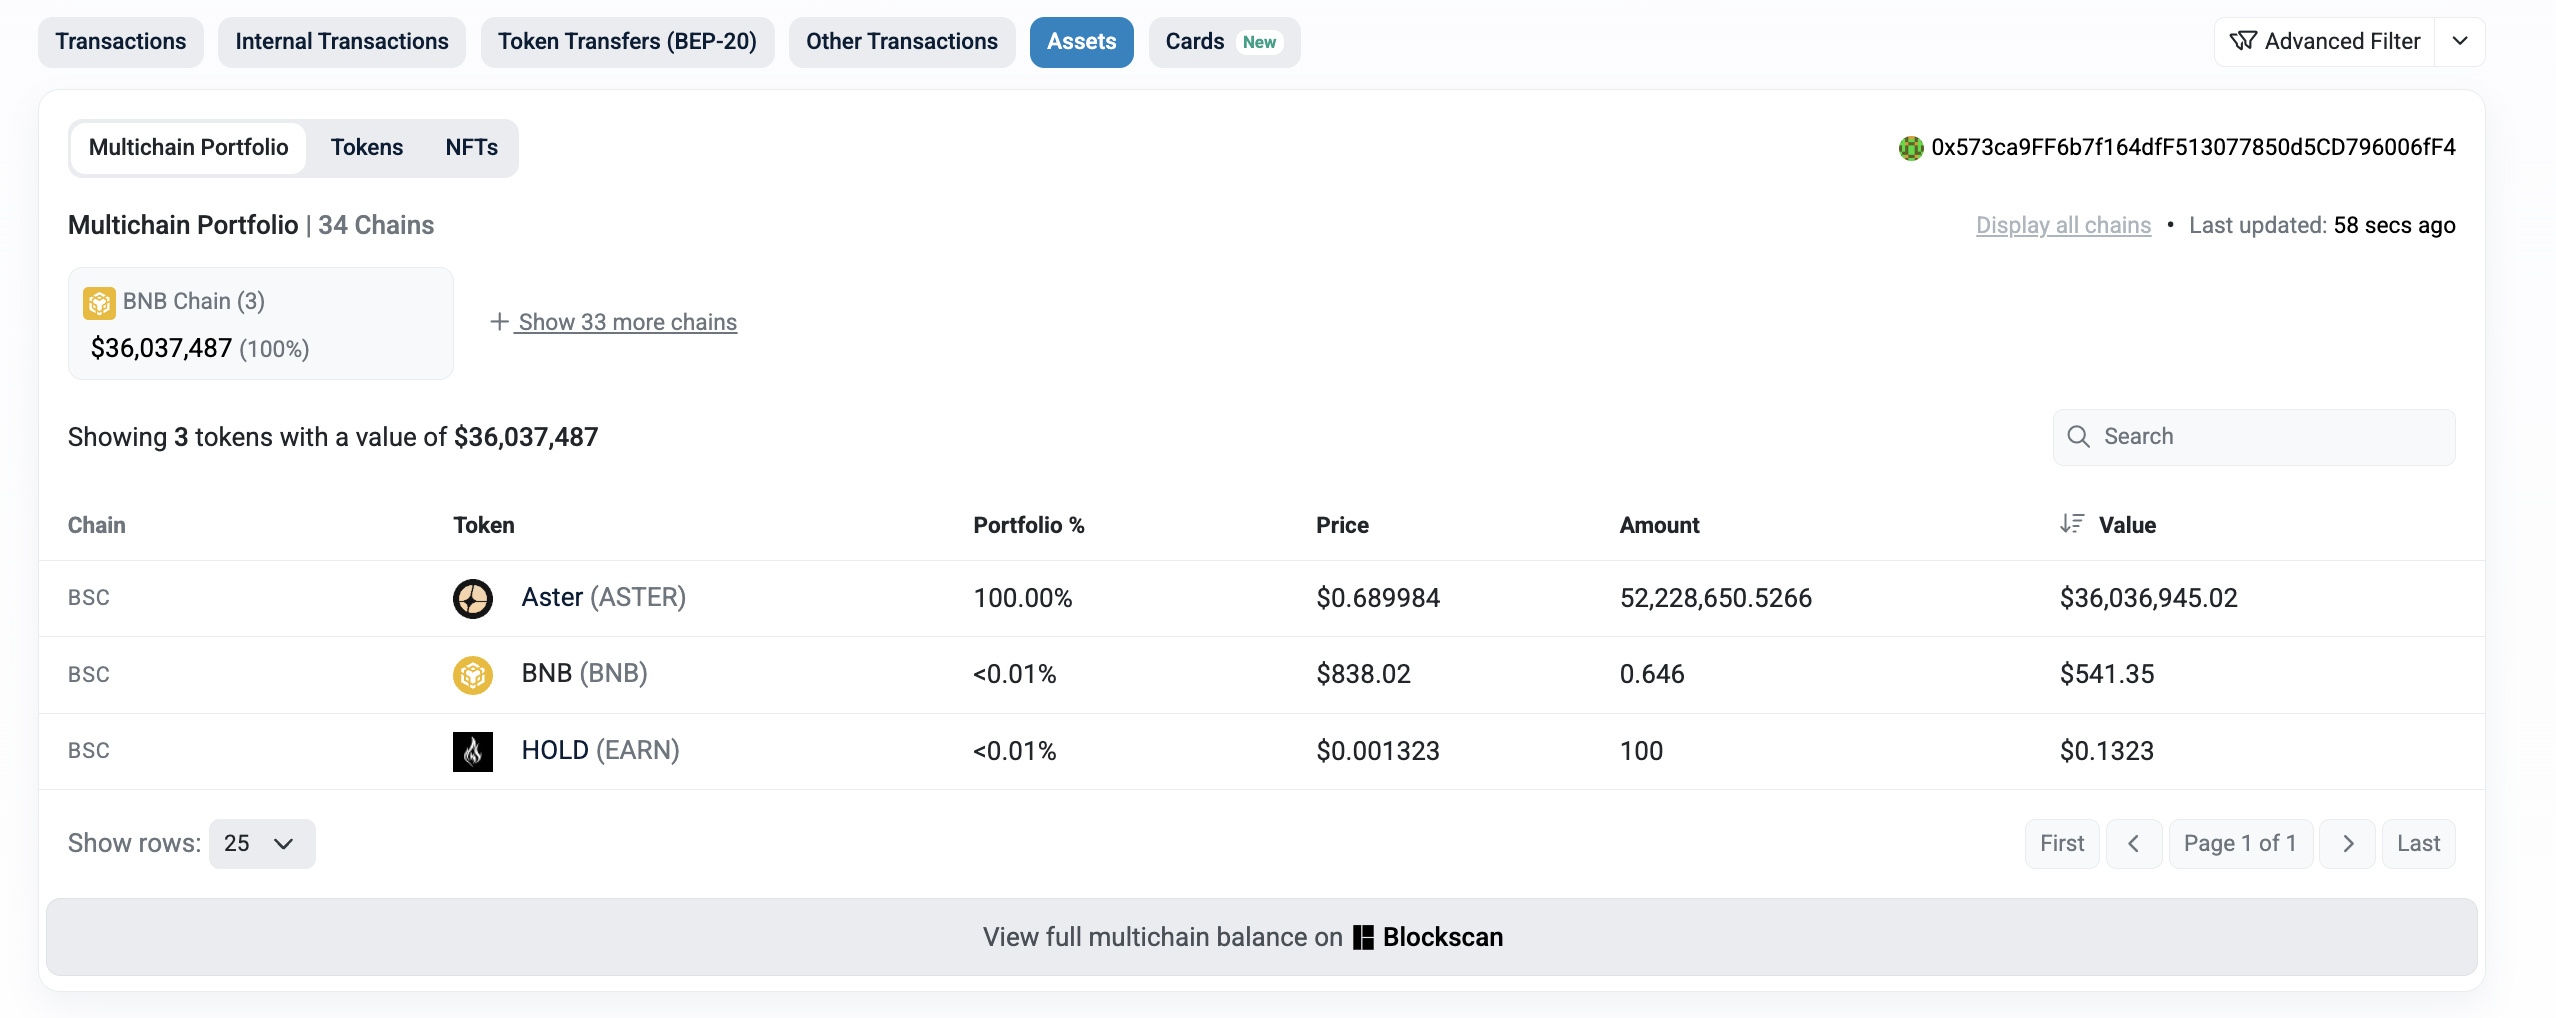
Aster (ASTER) trades under intense selling pressure, recording 3% loss at press time on Thursday. The perpetual-focused exchange resumed its Stage 4 buyback program on Wednesday and currently holds almost 52 million ASTER tokens. Additionally, on-chain data reveals that large-wallet investors, commonly referred to as whales, are buying the dip while retail demand in the derivatives market fluctuates.

The technical outlook for ASTER remains bearish, as indicators suggest intense overhead pressure.

Aster continues buyback after a single-day halt

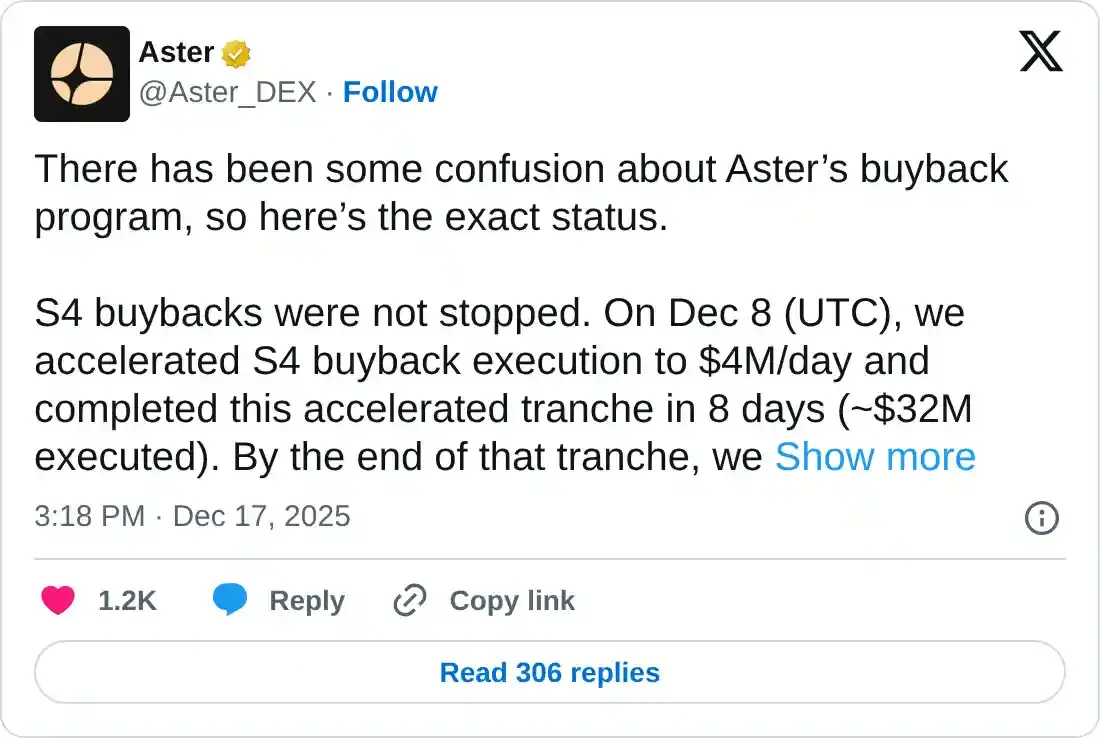
Aster issued a clarification on its buyback program, driven by its Stage 4 daily revenue. The Binance-backed project revealed accelerated buying worth nearly $4 million per day between December 8 and 15, totaling almost $32 million. 

However, the airdrop program paused the buyback schedule for a day on Tuesday, which was later resumed on Wednesday. The buybacks will continue throughout Stage 4, ending on Sunday, and afterward, it will remain a standing policy.

https://x.com/Aster_DEX/status/2001310960397816111

As of December 18, the Stage 4 buyback address holds over 52.22 million ASTER tokens and is likely to cross 70 million ASTER if buying pressure sustains.

ASTER Stage 4 buyback address. Source: BscScan

Whales acquire ASTER amid mixed retail sentiment

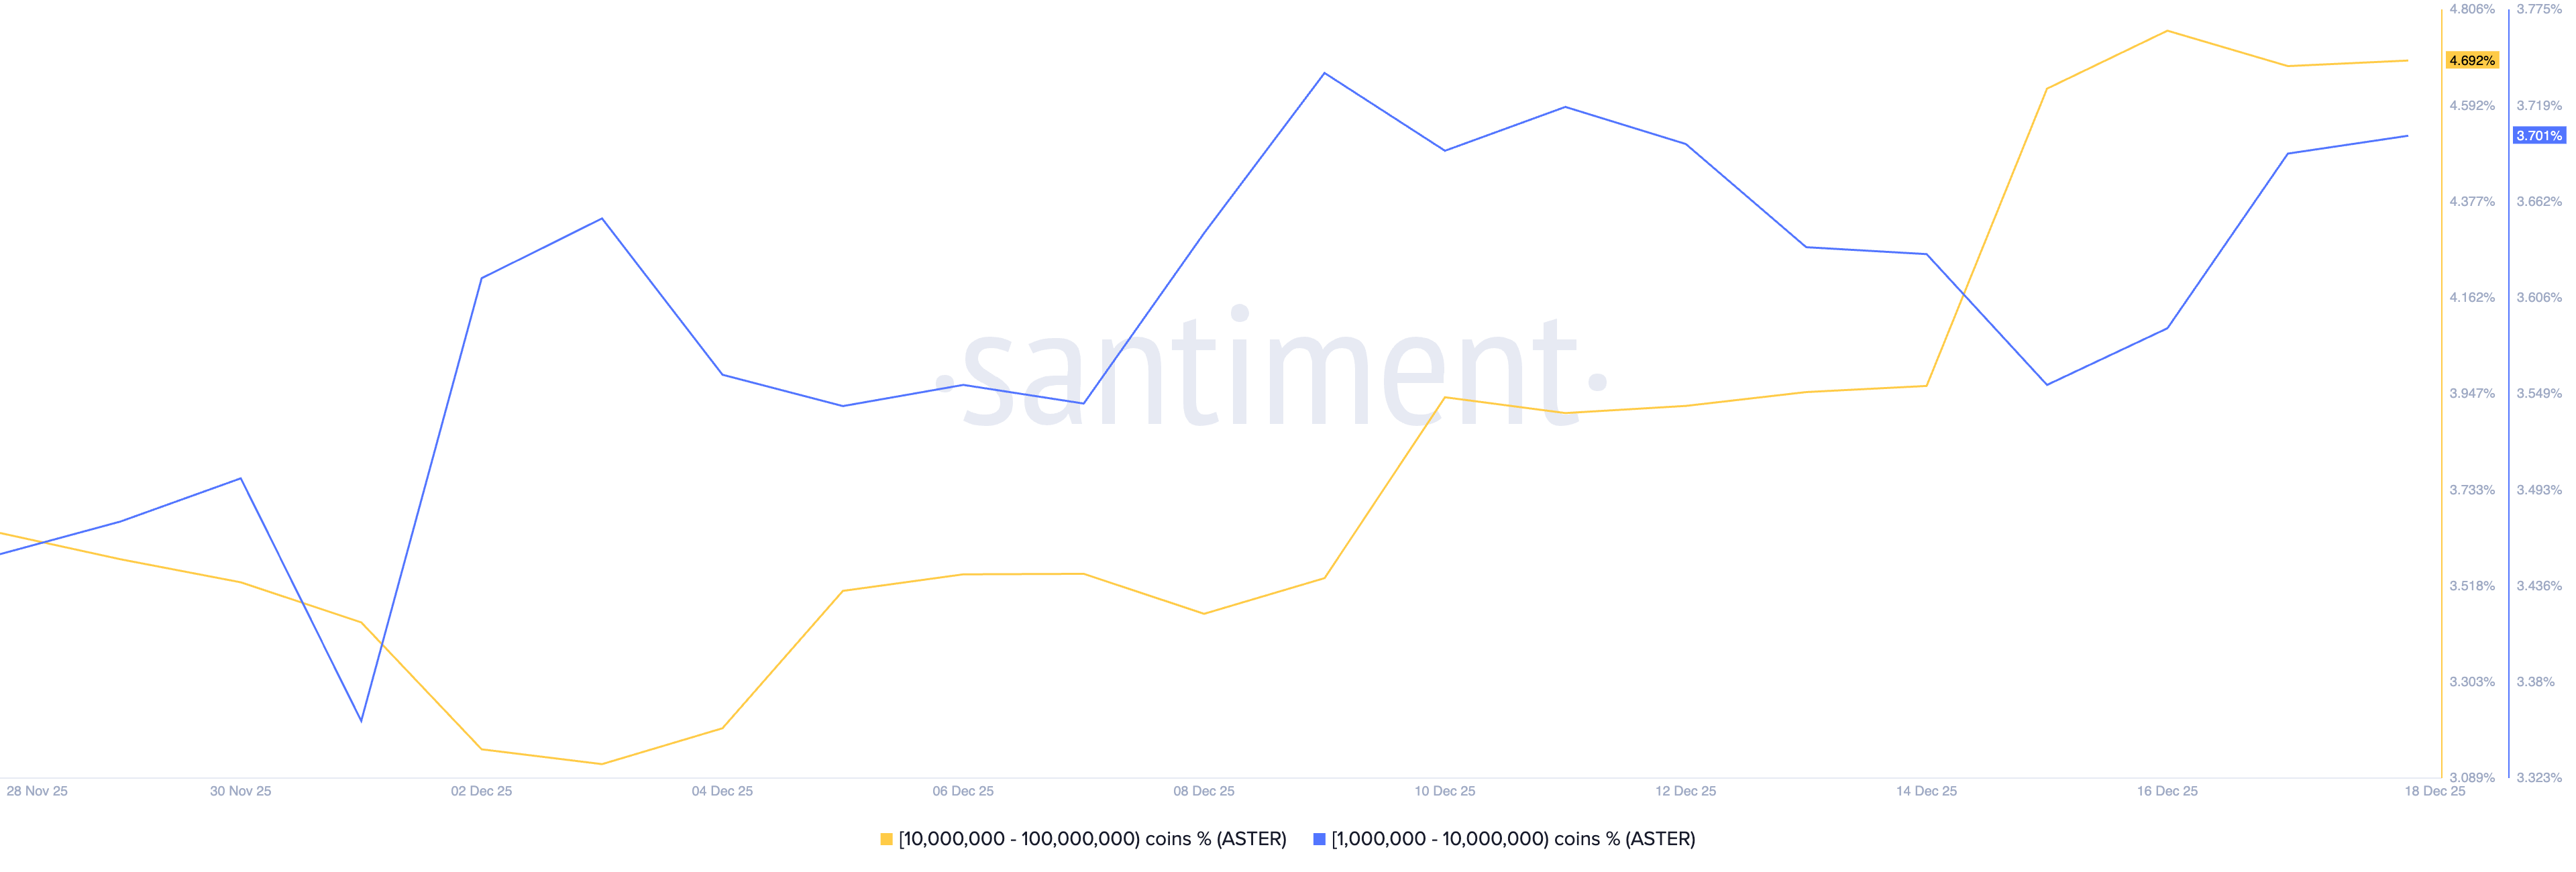
Santiment data shows that large wallet investors are increasing their holdings, indicating a bottom-buying spree from whales. Whales holding 10-100 million ASTER hold 4.69% of the supply, up from 3.44% on December 1. Meanwhile, whales with 1-10 million ASTER hold 3.70%, up from 3.36% over the same period. 

ASTER supply distribution. Source: CoinGlass

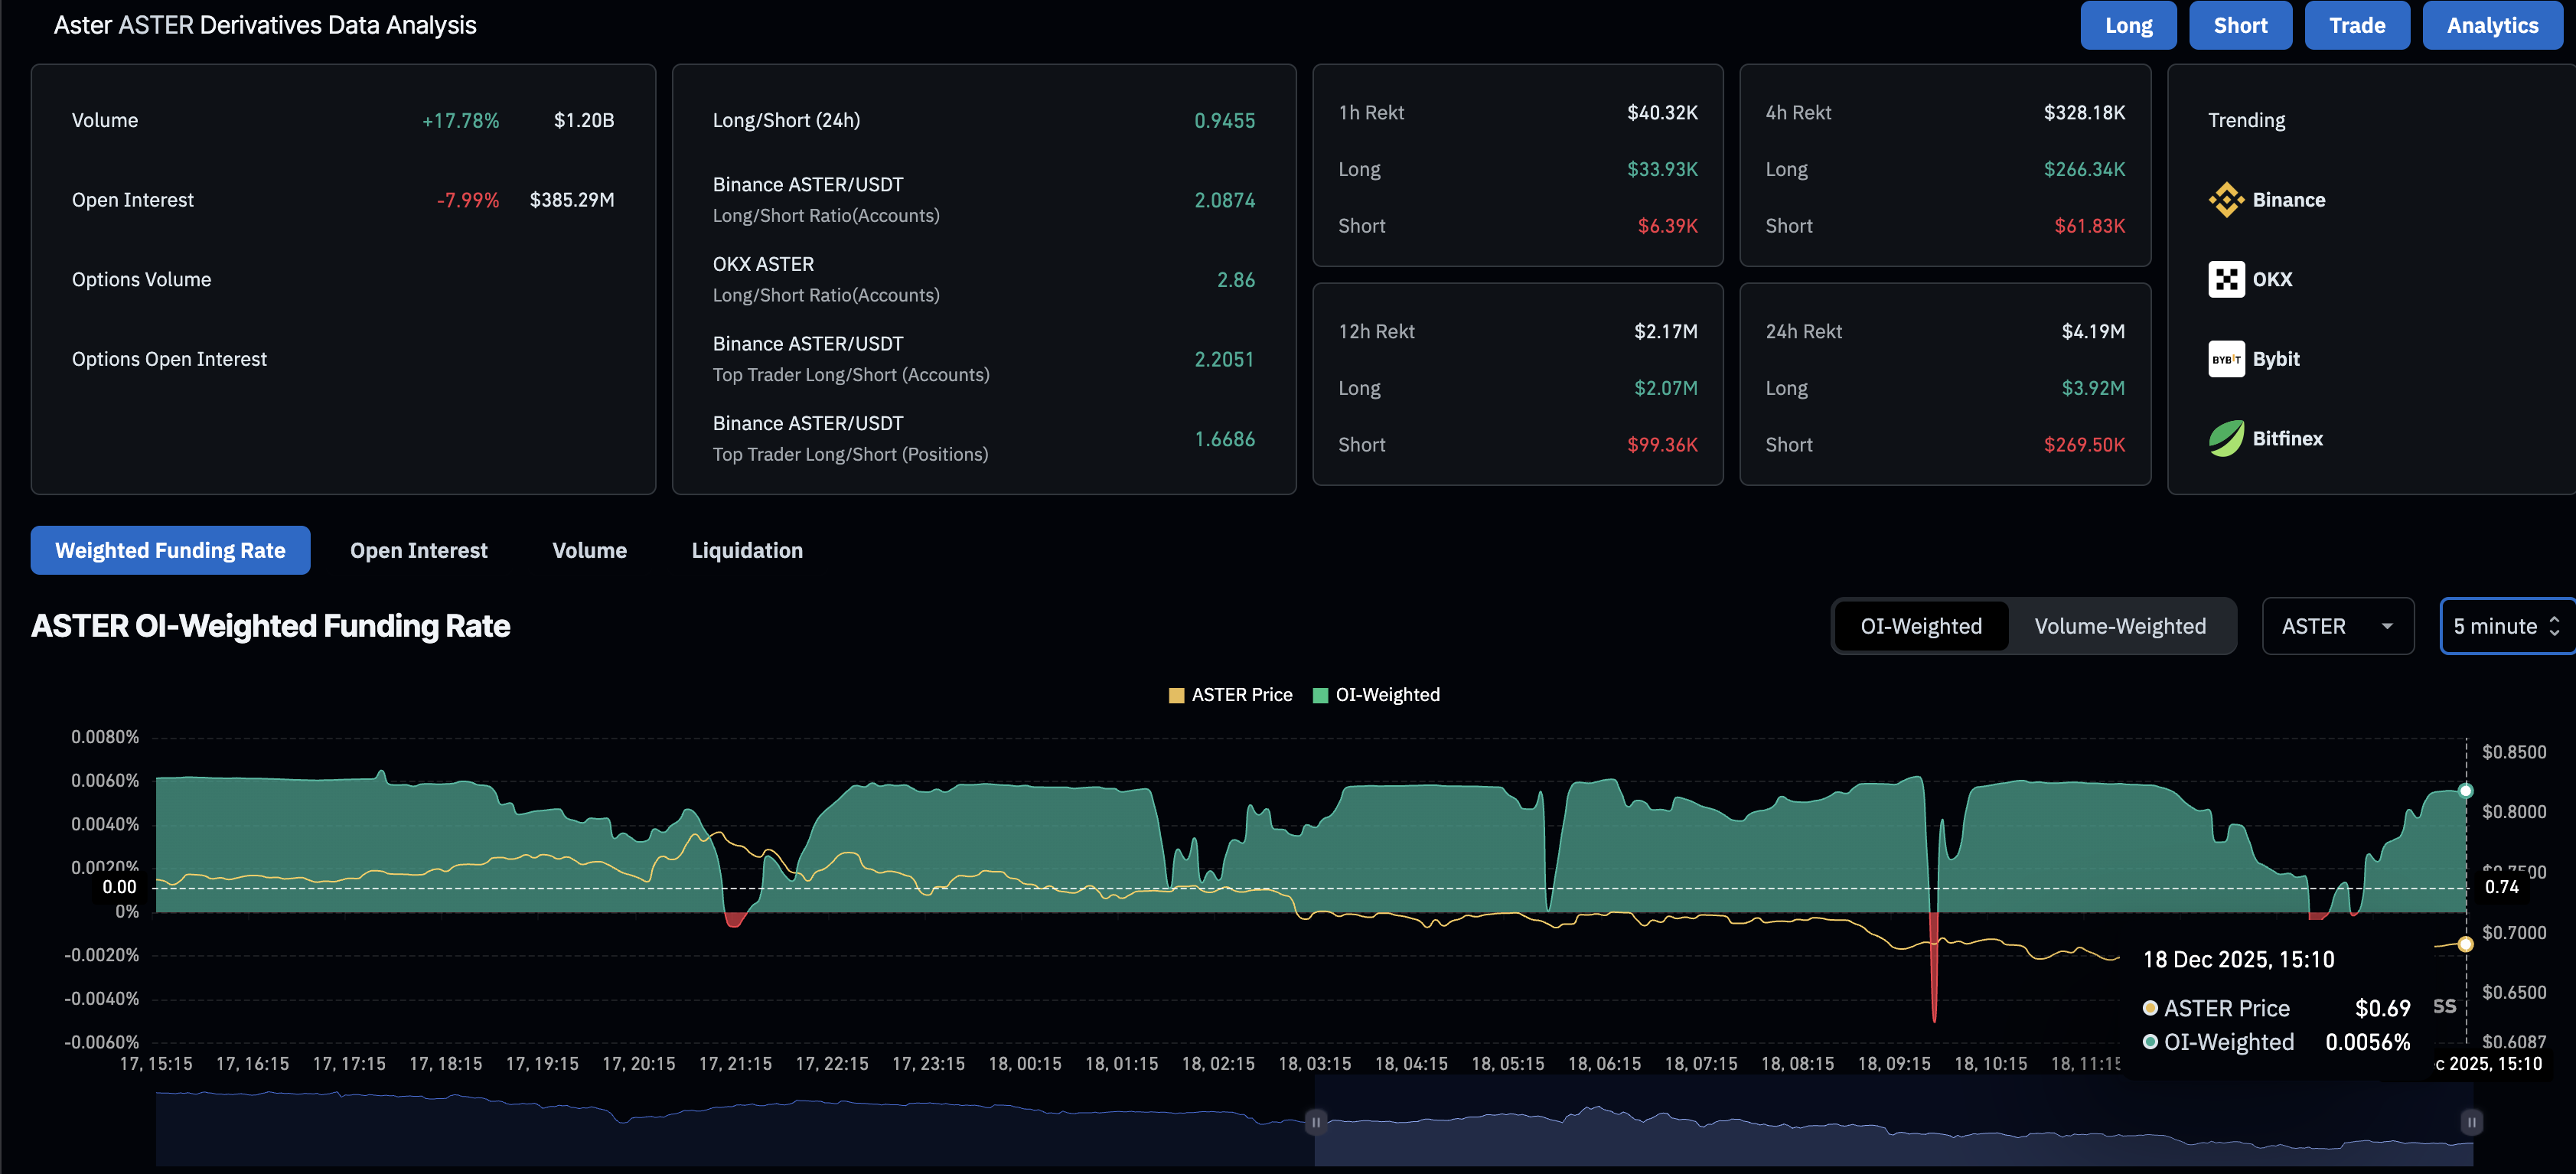
However, on the derivatives side, Aster struggles to retain retail demand amid volatile market conditions. CoinGlass data shows that the ASTER futures Open Interest (OI) is down almost 8% in the last 24 hours, to $385.29 million, indicating a drop in retail activity. 

Meanwhile, the long liquidations during the same period account for $3.92 million, outpacing the short liquidations of $269,500.

Still, the funding rate of 0.0056% indicates short-term bullish interest that could fuel long liquidations. 

ASTER derivatives data. Source: CoinGlass

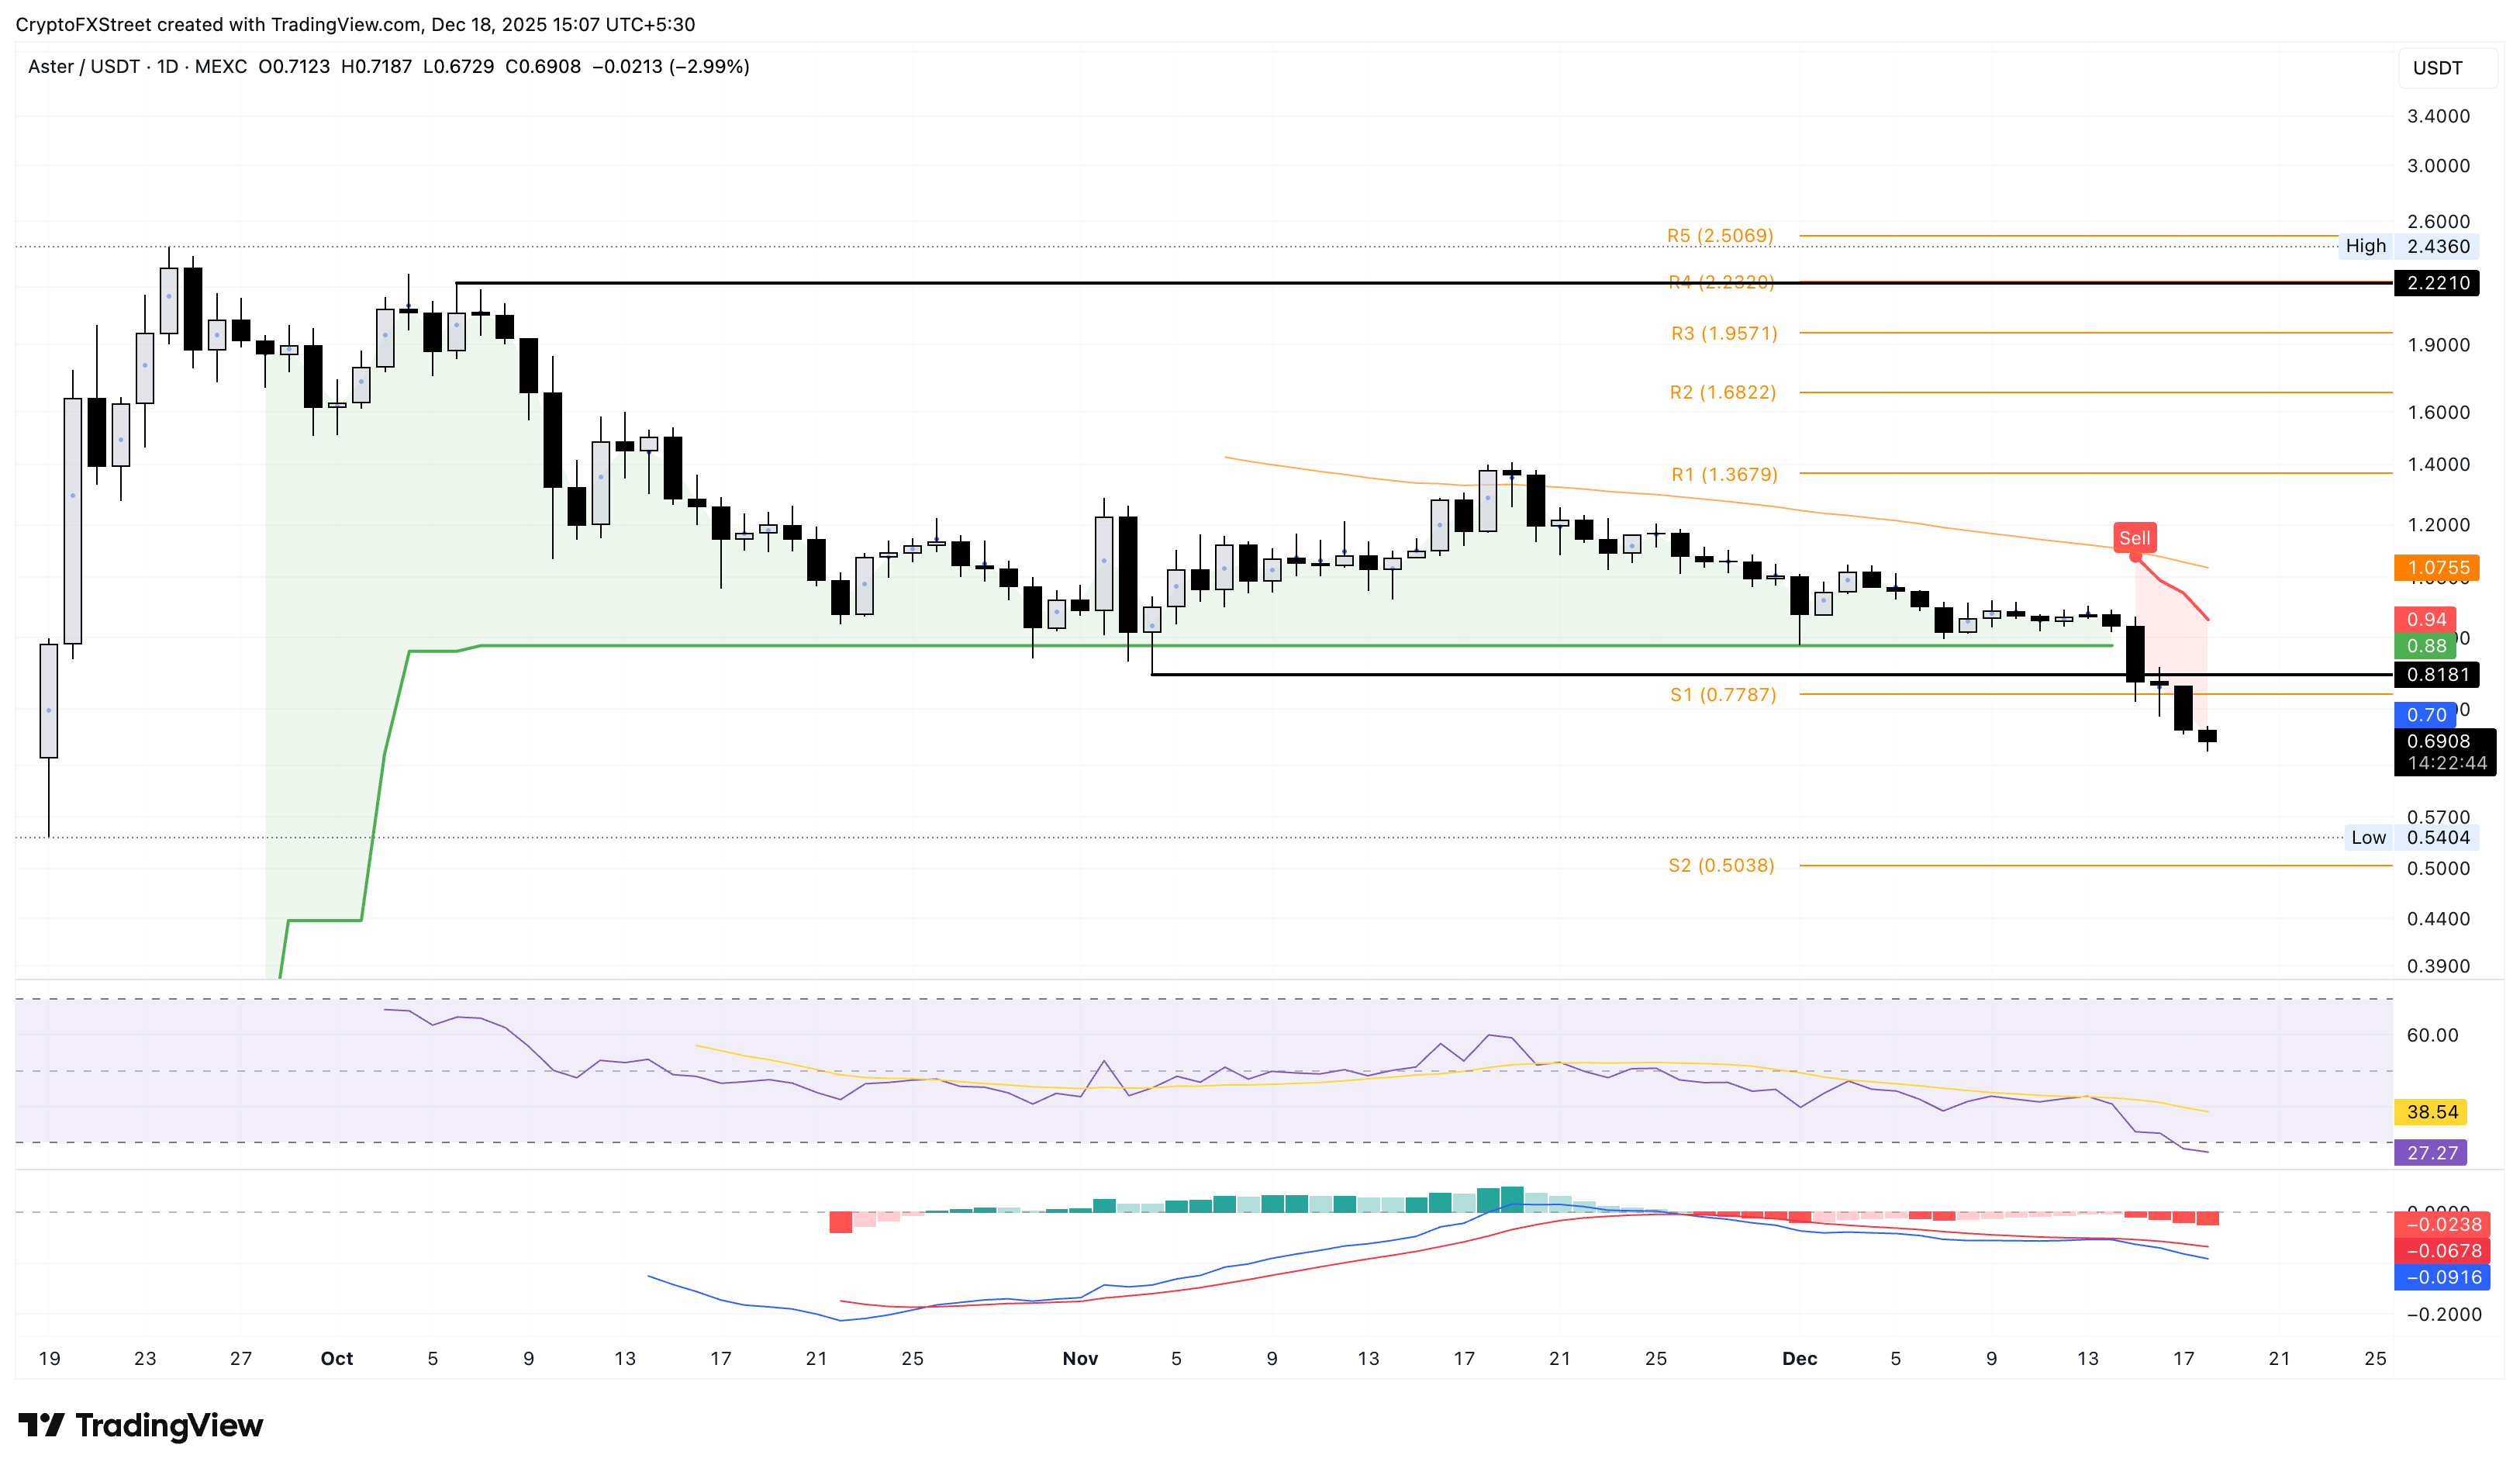
Aster’s downfall picks up momentum, targeting $0.50

Aster trades below $0.70 at the time of writing on Thursday, incurring a 3% loss so far. The exchange token’s 13% decline on Monday triggered a sell signal when it crossed below the Supertrend indicator line at $0.88. So far, ASTER is down 25% this week and aims for the S2 Pivot Point at $0.50.

The technical indicators on the daily chart suggest that the Binance-backed token is under intense selling pressure. The Relative Strength Index (RSI) is at 27, crossing into the oversold zone, while the Moving Average Convergence Divergence (MACD) and signal line continue to fall after briefly converging last week. 

ASTER/USDT daily price chart.

Looking upside, ASTER should reclaim the $1.00 psychological level to reinstate a recovery run.

Disclaimer: For information purposes only. Past performance is not indicative of future results.
placeholder
Ethereum Price Slips Lower — $3,000 Looms as the Key BattlegroundEthereum is attempting to recover from a $3,026 low but remains below $3,200 and the 100-hour SMA, with a bearish trend line near $3,175 capping rebounds as bulls need a clean break above $3,200 to target $3,250–$3,400, while a drop below $3,050 risks a retest of $3,000 and $2,940.
Author  Mitrade
Dec 15, Mon
Ethereum is attempting to recover from a $3,026 low but remains below $3,200 and the 100-hour SMA, with a bearish trend line near $3,175 capping rebounds as bulls need a clean break above $3,200 to target $3,250–$3,400, while a drop below $3,050 risks a retest of $3,000 and $2,940.
placeholder
Bitcoin Slides 5% as Sellers Lean In — Can BTC Reclaim $88,000?Bitcoin has dropped back below $88,000 after rolling over from $90,500, with price still trading under the 100-hour Simple Moving Average. The sell-off found a floor at $85,151, and BTC is now consolidating near that base, but rebounds are facing pressure from a bearish trend line around $89,000. Bulls need to retake $88,000–$89,000 to ease downside risk; failure to do so keeps $85,500–$85,000 and then $83,500 in play, with $80,000 as the deeper “line in the sand.” Bitcoin (BTC) is back in damage-control mode after a sharp pullback wiped out recent gains. The price failed to reclaim the $90,000–$90,500 band, rolled over, and slid through $88,500 before briefly dipping under $87,000. Buyers did show up around $85,000, but the rebound so far looks more like stabilization than a clear trend reversal. Bitcoin dips hard, finds a bid near $85,000(h3) BTC’s latest move lower began when it couldn’t build follow-through above $90,000 and $90,500. Once that upside stalled, sellers took control and pushed price down through $88,500. The slide accelerated enough to spike below $87,000, but the market didn’t free-fall. Bulls defended the $85,000 zone, printing a low at $85,151. Since then, Bitcoin has been consolidating below the 23.6% Fibonacci retracement of the drop from the $93,560 swing high to the $85,151 low — a clue that the bounce is still shallow and that sellers haven’t fully backed off yet. Structurally, BTC is still on the back foot: It’s trading below $88,000, and It remains below the 100-hour Simple Moving Average, keeping short-term trend pressure pointed downward. Resistance is layered, and $89,000 is the problem area(h3) If bulls try to turn this into a recovery, they’ll have to climb through multiple ceilings in quick succession. First, BTC faces resistance around $87,150, followed by a more meaningful barrier near $87,500. From there, the market’s attention snaps back to $88,000 — the level BTC just lost and now needs to reclaim. A close back above $88,000 would improve the tone, but it doesn’t solve the bigger issue: there’s a bearish trend line on the hourly BTC/USD chart (Kraken feed) with resistance near $89,000, which also lines up with the next technical hurdle. If BTC can push through $89,000 and hold, the rebound could extend toward $90,000, with follow-through targets at $91,000 and $91,500. But until price clears that $88,000–$89,000 zone, rallies are at risk of being sold rather than chased. If BTC fails to reclaim resistance, the downside path is clear(h3) The near-term bear case is simple: if Bitcoin can’t climb back above the $87,000 area and keep traction, sellers may attempt another leg lower. Support levels line up like this: Immediate support: $85,500 First major support: $85,000 Next support: $83,500 Then $82,500 in the near term Below that, the major “don’t break this” level is still $80,000. If BTC slips under $80,000, the risk of acceleration to the downside increases significantly — not because it’s magic, but because it’s the kind of psychological and structural level that tends to trigger forced de-risking. Indicators: momentum still leans bearish(h3) The intraday indicators aren’t offering much comfort yet: Hourly MACD is losing pace in the bearish zone. Hourly RSI remains below 50, suggesting sellers still have the upper hand on short timeframes. So while the $85,000 defense held for now, the market hasn’t flipped bullish — it’s just stopped bleeding.
Author  Mitrade
Dec 16, Tue
Bitcoin has dropped back below $88,000 after rolling over from $90,500, with price still trading under the 100-hour Simple Moving Average. The sell-off found a floor at $85,151, and BTC is now consolidating near that base, but rebounds are facing pressure from a bearish trend line around $89,000. Bulls need to retake $88,000–$89,000 to ease downside risk; failure to do so keeps $85,500–$85,000 and then $83,500 in play, with $80,000 as the deeper “line in the sand.” Bitcoin (BTC) is back in damage-control mode after a sharp pullback wiped out recent gains. The price failed to reclaim the $90,000–$90,500 band, rolled over, and slid through $88,500 before briefly dipping under $87,000. Buyers did show up around $85,000, but the rebound so far looks more like stabilization than a clear trend reversal. Bitcoin dips hard, finds a bid near $85,000(h3) BTC’s latest move lower began when it couldn’t build follow-through above $90,000 and $90,500. Once that upside stalled, sellers took control and pushed price down through $88,500. The slide accelerated enough to spike below $87,000, but the market didn’t free-fall. Bulls defended the $85,000 zone, printing a low at $85,151. Since then, Bitcoin has been consolidating below the 23.6% Fibonacci retracement of the drop from the $93,560 swing high to the $85,151 low — a clue that the bounce is still shallow and that sellers haven’t fully backed off yet. Structurally, BTC is still on the back foot: It’s trading below $88,000, and It remains below the 100-hour Simple Moving Average, keeping short-term trend pressure pointed downward. Resistance is layered, and $89,000 is the problem area(h3) If bulls try to turn this into a recovery, they’ll have to climb through multiple ceilings in quick succession. First, BTC faces resistance around $87,150, followed by a more meaningful barrier near $87,500. From there, the market’s attention snaps back to $88,000 — the level BTC just lost and now needs to reclaim. A close back above $88,000 would improve the tone, but it doesn’t solve the bigger issue: there’s a bearish trend line on the hourly BTC/USD chart (Kraken feed) with resistance near $89,000, which also lines up with the next technical hurdle. If BTC can push through $89,000 and hold, the rebound could extend toward $90,000, with follow-through targets at $91,000 and $91,500. But until price clears that $88,000–$89,000 zone, rallies are at risk of being sold rather than chased. If BTC fails to reclaim resistance, the downside path is clear(h3) The near-term bear case is simple: if Bitcoin can’t climb back above the $87,000 area and keep traction, sellers may attempt another leg lower. Support levels line up like this: Immediate support: $85,500 First major support: $85,000 Next support: $83,500 Then $82,500 in the near term Below that, the major “don’t break this” level is still $80,000. If BTC slips under $80,000, the risk of acceleration to the downside increases significantly — not because it’s magic, but because it’s the kind of psychological and structural level that tends to trigger forced de-risking. Indicators: momentum still leans bearish(h3) The intraday indicators aren’t offering much comfort yet: Hourly MACD is losing pace in the bearish zone. Hourly RSI remains below 50, suggesting sellers still have the upper hand on short timeframes. So while the $85,000 defense held for now, the market hasn’t flipped bullish — it’s just stopped bleeding.
placeholder
December Santa Claus Rally: New highs in sight for US and European stocks?Historical data show a rising trend of US and European stocks in December. If the momentum is strong, fund managers may rush in with a buying frenzy.
Author  Mitrade
Yesterday 02: 50
Historical data show a rising trend of US and European stocks in December. If the momentum is strong, fund managers may rush in with a buying frenzy.
placeholder
XRP’s Price Action Flashes a Warning Even as ETF Flows Stay PositiveXRP’s structure remains weak despite 18 straight positive closes in spot XRP ETFs, with analysts warning that $1.98 and other nearby resistance zones could cap rebounds unless the YO region is reclaimed, while deeper downside scenarios keep $1.53 on watch as a potential (not guaranteed) accumulation area.
Author  Mitrade
Yesterday 06: 37
XRP’s structure remains weak despite 18 straight positive closes in spot XRP ETFs, with analysts warning that $1.98 and other nearby resistance zones could cap rebounds unless the YO region is reclaimed, while deeper downside scenarios keep $1.53 on watch as a potential (not guaranteed) accumulation area.
placeholder
Gold declines on profit-taking, USD strength ahead of US CPI releaseGold price (XAU/USD) edges lower below $4,350 during the Asian trading hours on Thursday. The precious metal retreats from seven-week highs amid some profit-taking and a rebound in the US Dollar (USD).
Author  FXStreet
6 hours ago
Gold price (XAU/USD) edges lower below $4,350 during the Asian trading hours on Thursday. The precious metal retreats from seven-week highs amid some profit-taking and a rebound in the US Dollar (USD).
goTop
quote