Crypto Today: Bitcoin, Ethereum hold steady while XRP slides amid mixed ETF flows

Source Fxstreet
  • Bitcoin eyes short-term breakout above $87,000, underpinned by a significant increase in ETF inflows.
  • Ethereum defends support around $2,800 as mild ETF outflows suppress its recovery.
  • XRP holds above at $1.82 amid bearish technical signals and persistent inflows into ETFs.

Bitcoin (BTC) is trading above $87,000 at the time of writing on Thursday, supported by a resurgence of inflows into spot Exchange Traded Funds (ETFs). High volatility has characterized trading in the cryptocurrency market, as seen in a sharp rebound above $90,000, followed by aggressive selling that brought prices to Wednesday’s low of $85,314.

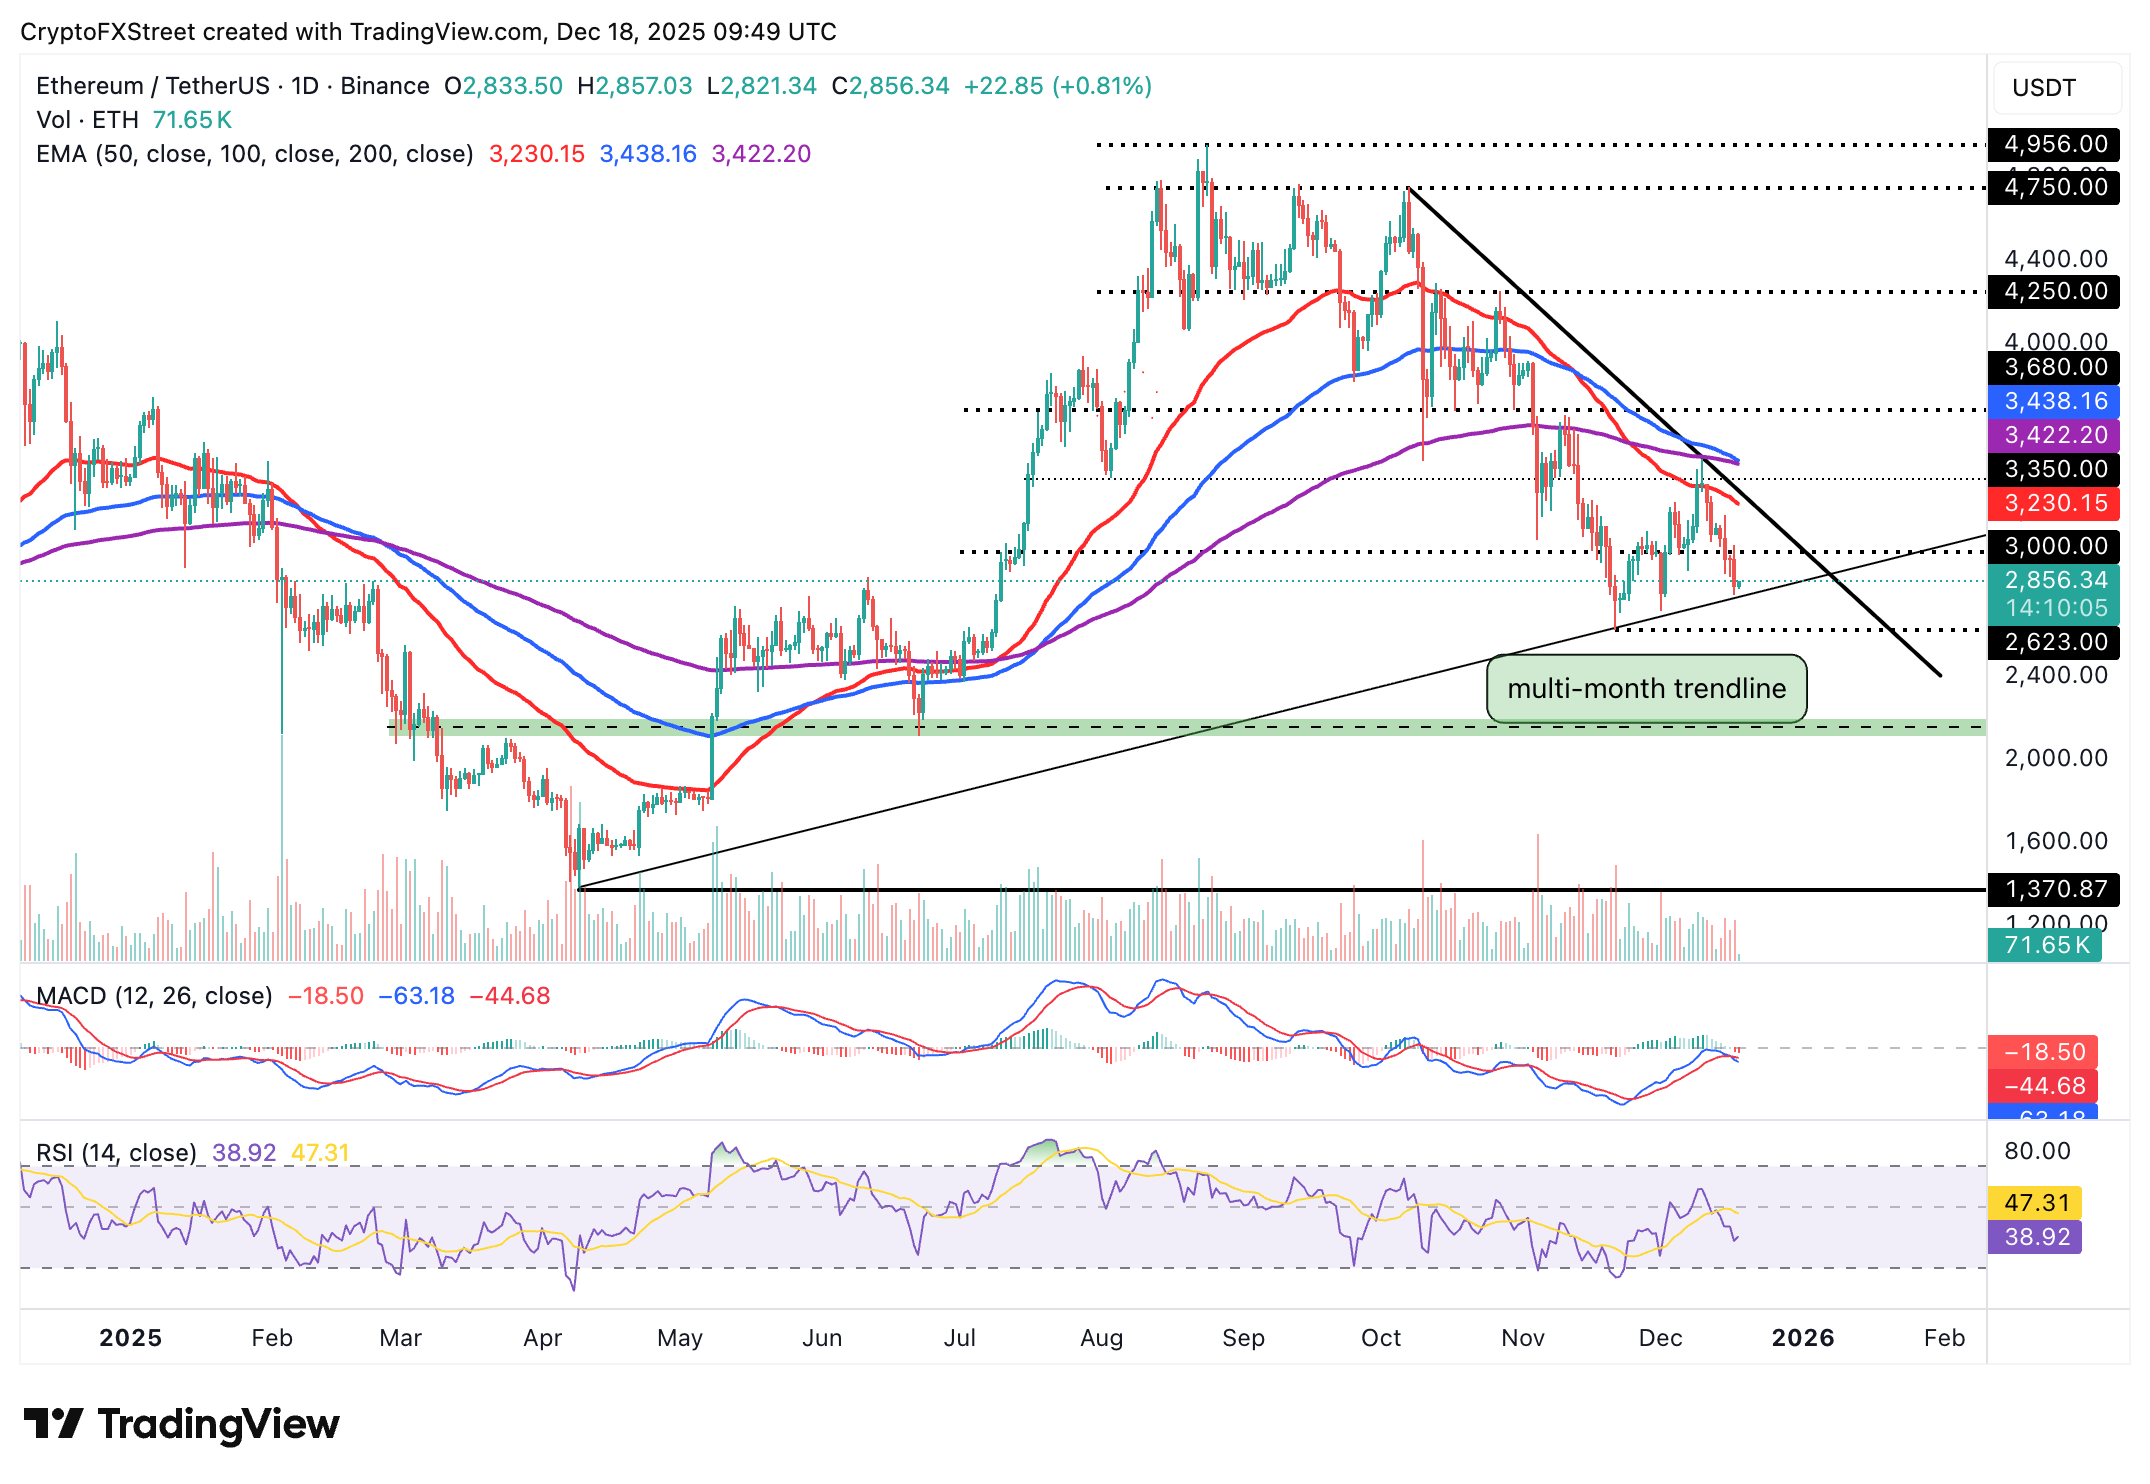
Ethereum (ETH) showcases stability above its short-term $2,800 support, but sentiment surrounding the smart contracts token has continued to deteriorate, as evidenced by steady ETF outflows.

Meanwhile, Ripple (XRP) is struggling to hold above $1.82, despite steady inflows into ETFs. A close above $2.00 would confirm a bullish turnaround, but if bears tighten their grip, the downtrend may stretch to April’s low of $1.61.

Data spotlight: Bitcoin, XRP see ETF inflows as ETH outflows continue

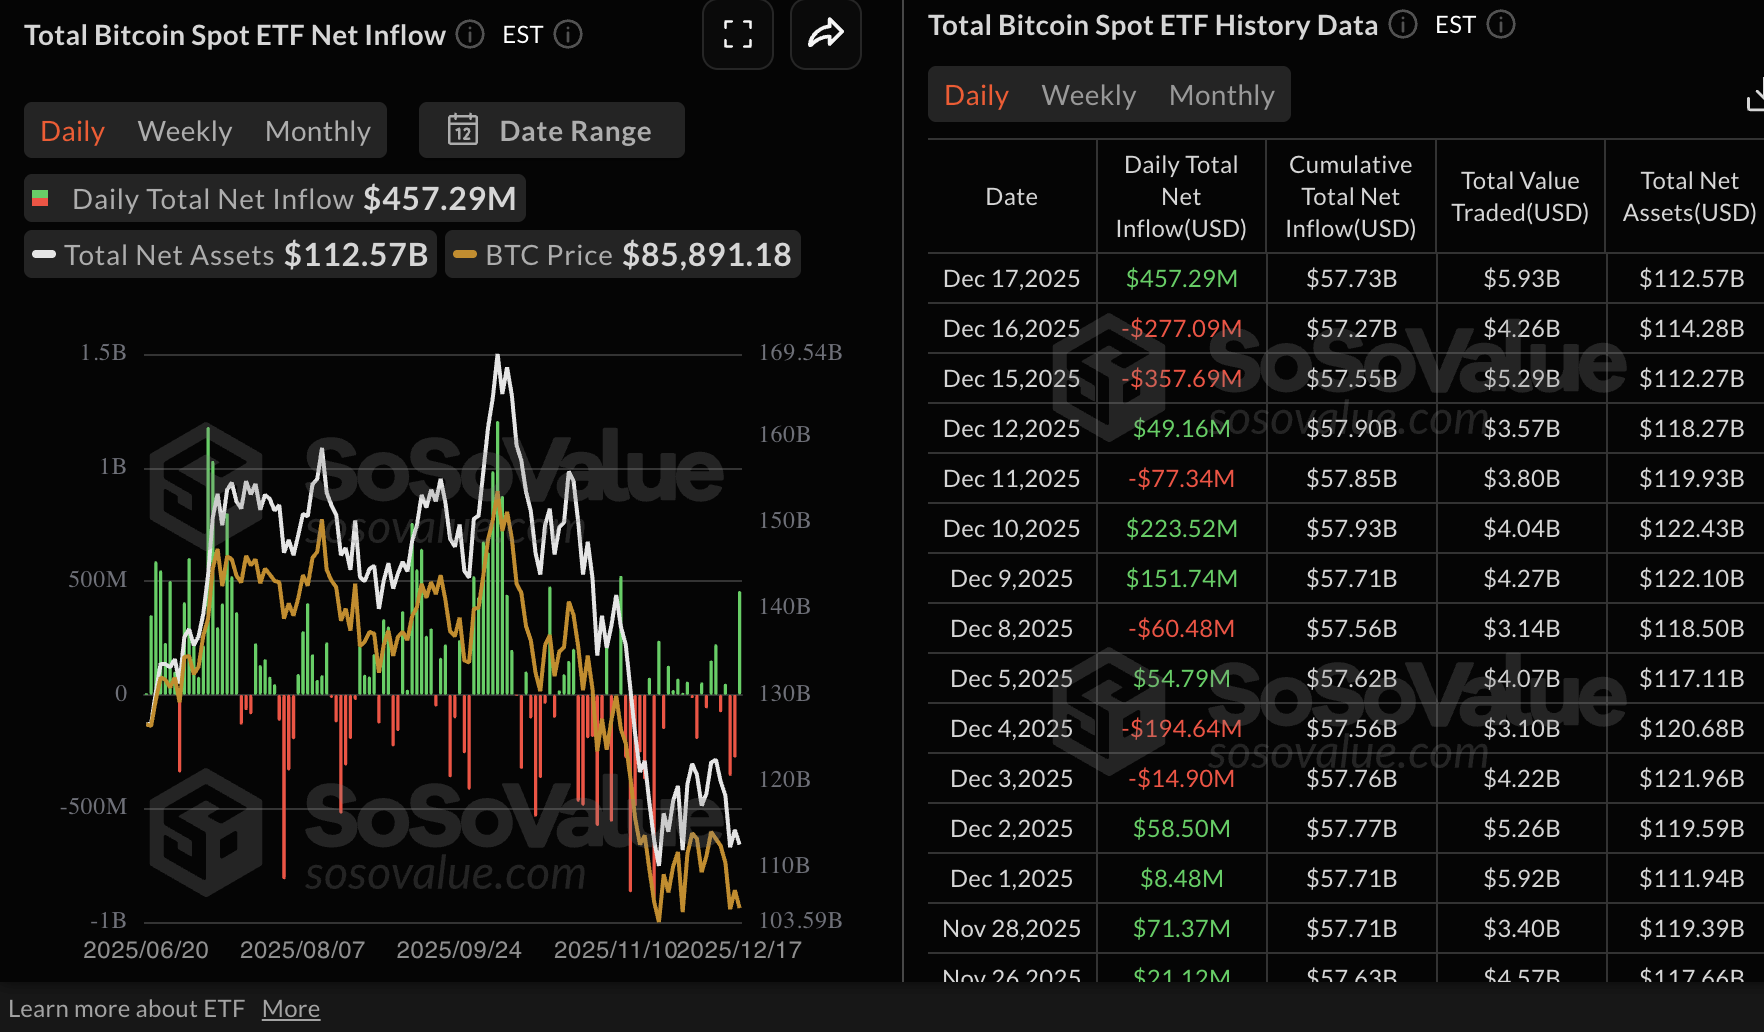
Bitcoin spot ETFs listed in the United States (US) experienced a significant resurgence in inflows, with approximately $457 million deposited on Wednesday. SoSoValue data shows that the cumulative net inflow currently stands at $57.73 billion and net assets at $112.57 billion. If inflows are steady toward the end of December, market sentiment may improve, making Bitcoin attractive to investors ahead of the New Year.

Bitcoin ETF stats | Source: SoSoValue

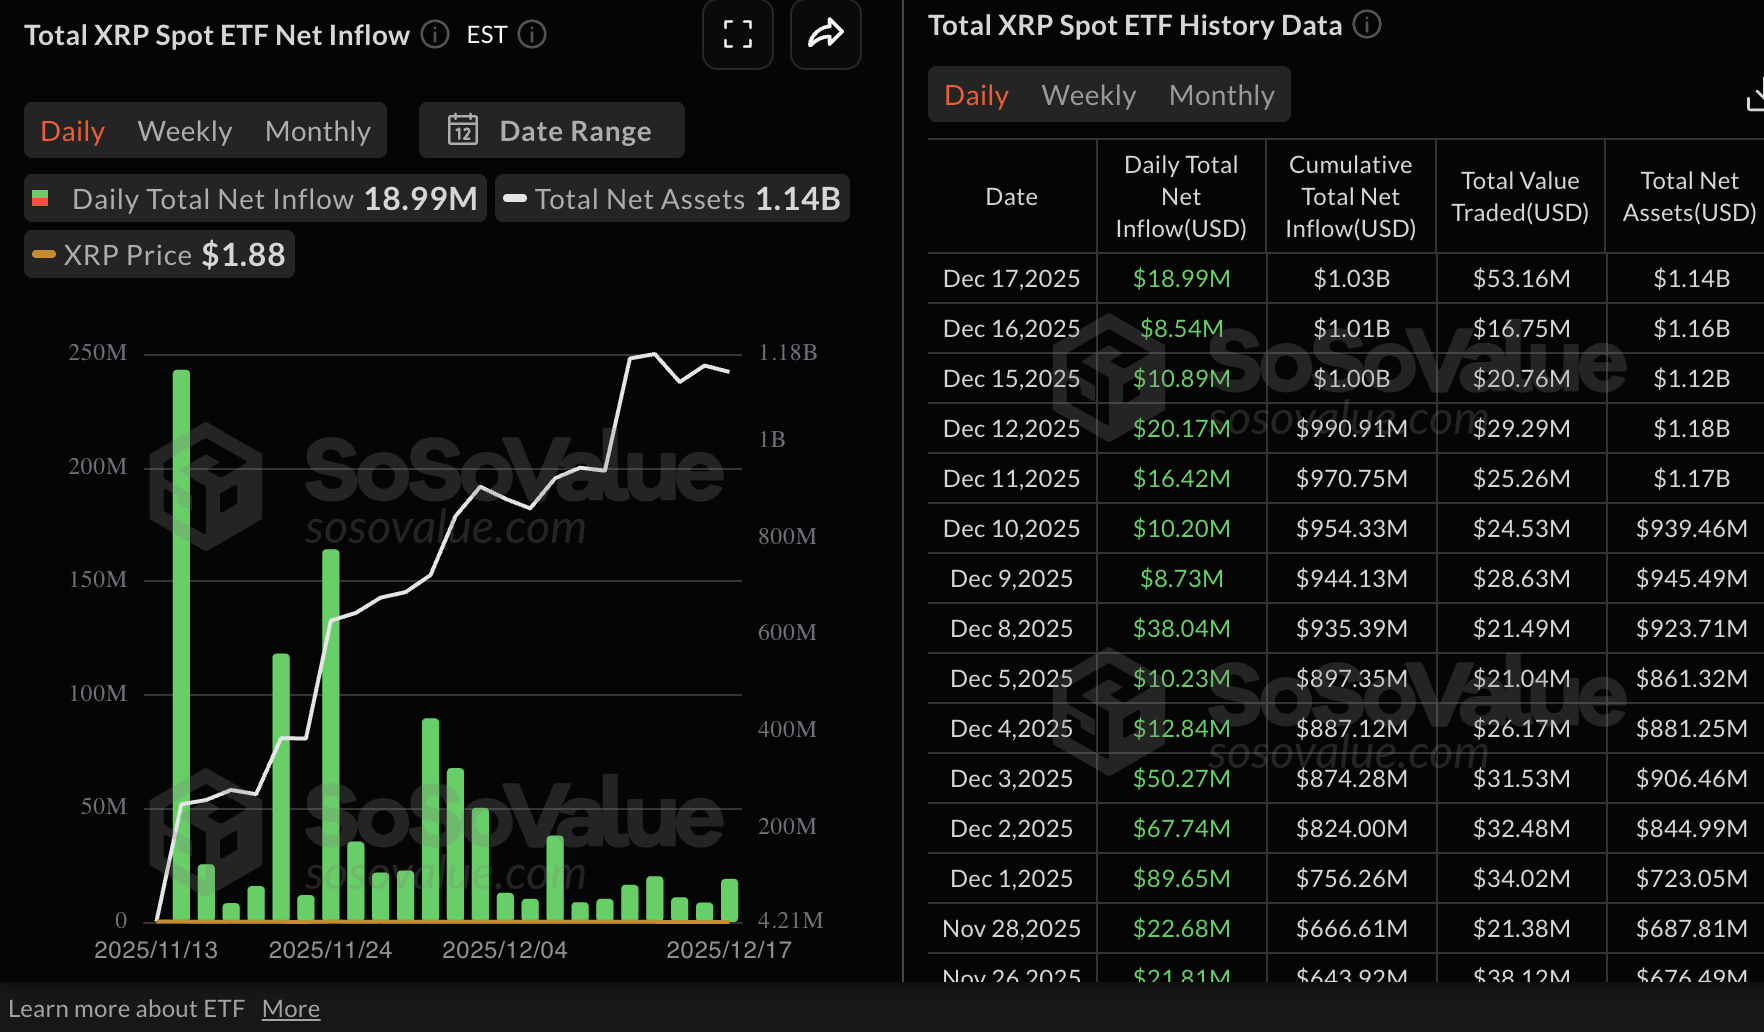
Meanwhile, inflows into XRP spot ETFs have been steady since their debut on November 13. Approximately $19 million was deposited into US-listed XRP ETFs on Wednesday, bringing the cumulative net inflow to $1.03 billion and net assets to $1.14 billion, according to SoSoValue data.

The persistent inflows indicate that institutional interest in XRP-related investment products is growing, potentially supporting price increases.

XRP ETF stats | Source: SoSoValue

Ethereum, on the other hand, recorded the fifth consecutive day of outflows, with investors withdrawing approximately $22 million on Wednesday. The persistent outflow streak suggests that investors are not convinced Ethereum can make an immediate turnaround and sustain an uptrend, which could explain the need to reduce their risk exposure.

Ethereum stats | Source: SoSoValue

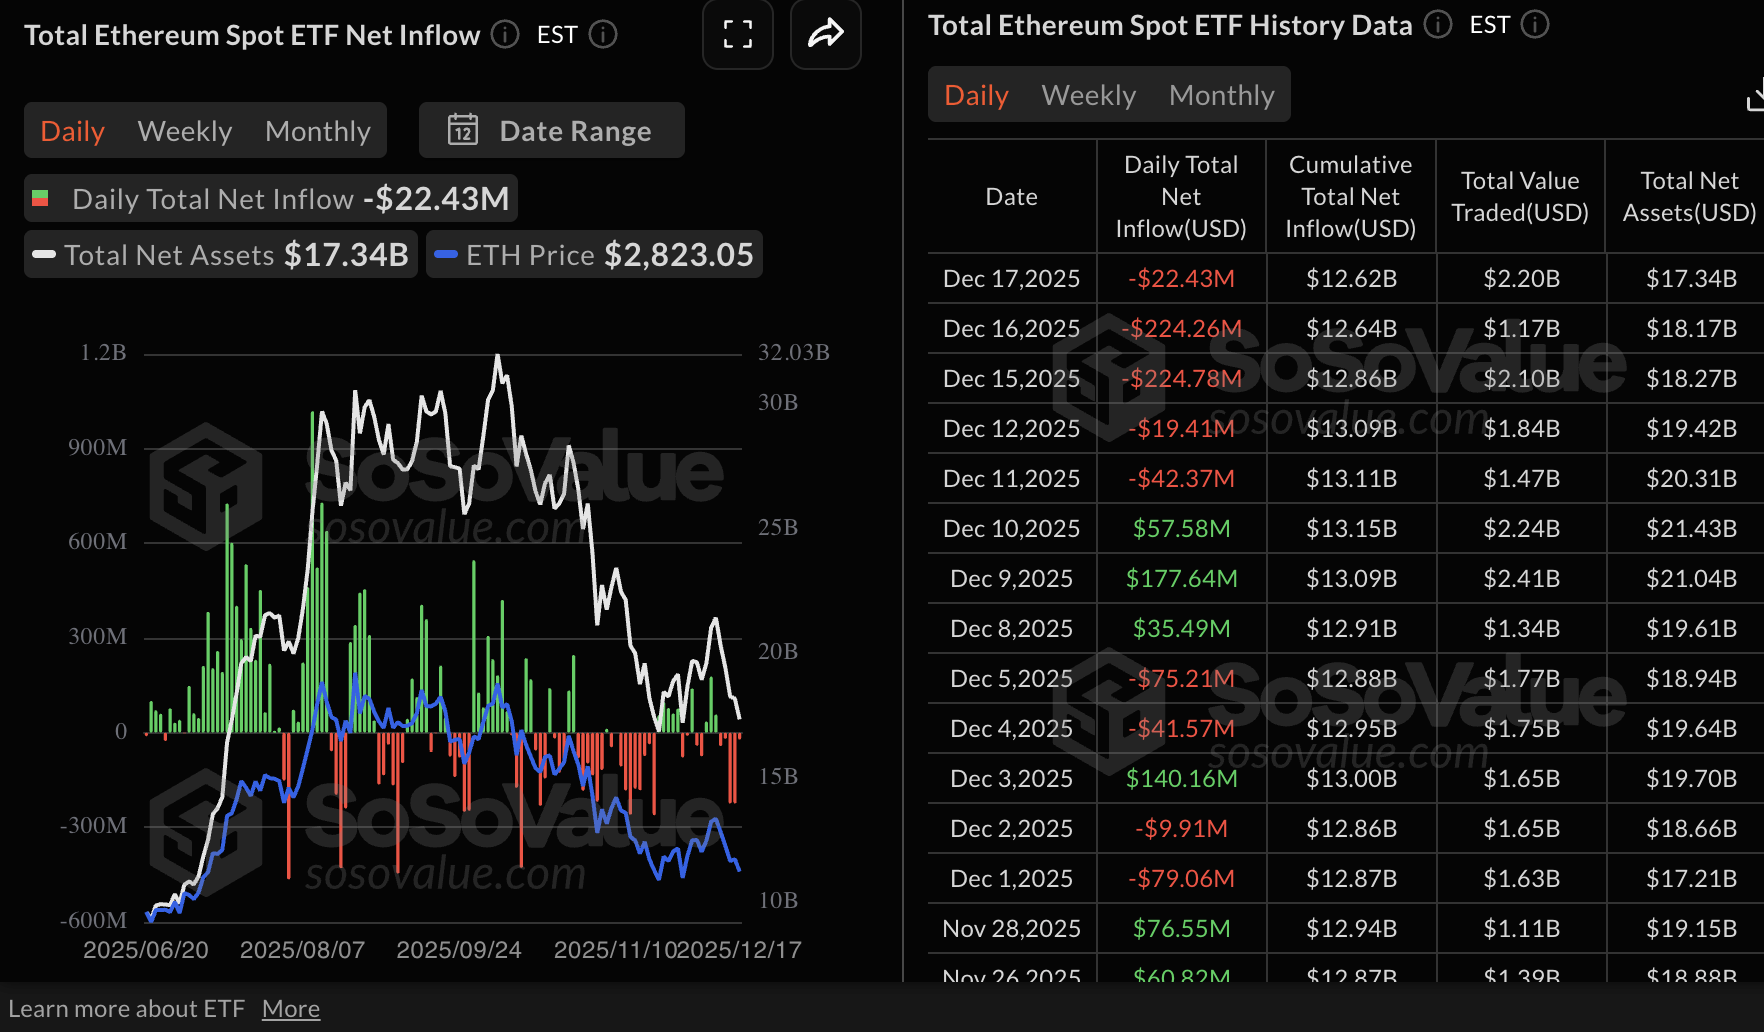
Chart of the day: Bitcoin trades under pressure and bearish signals

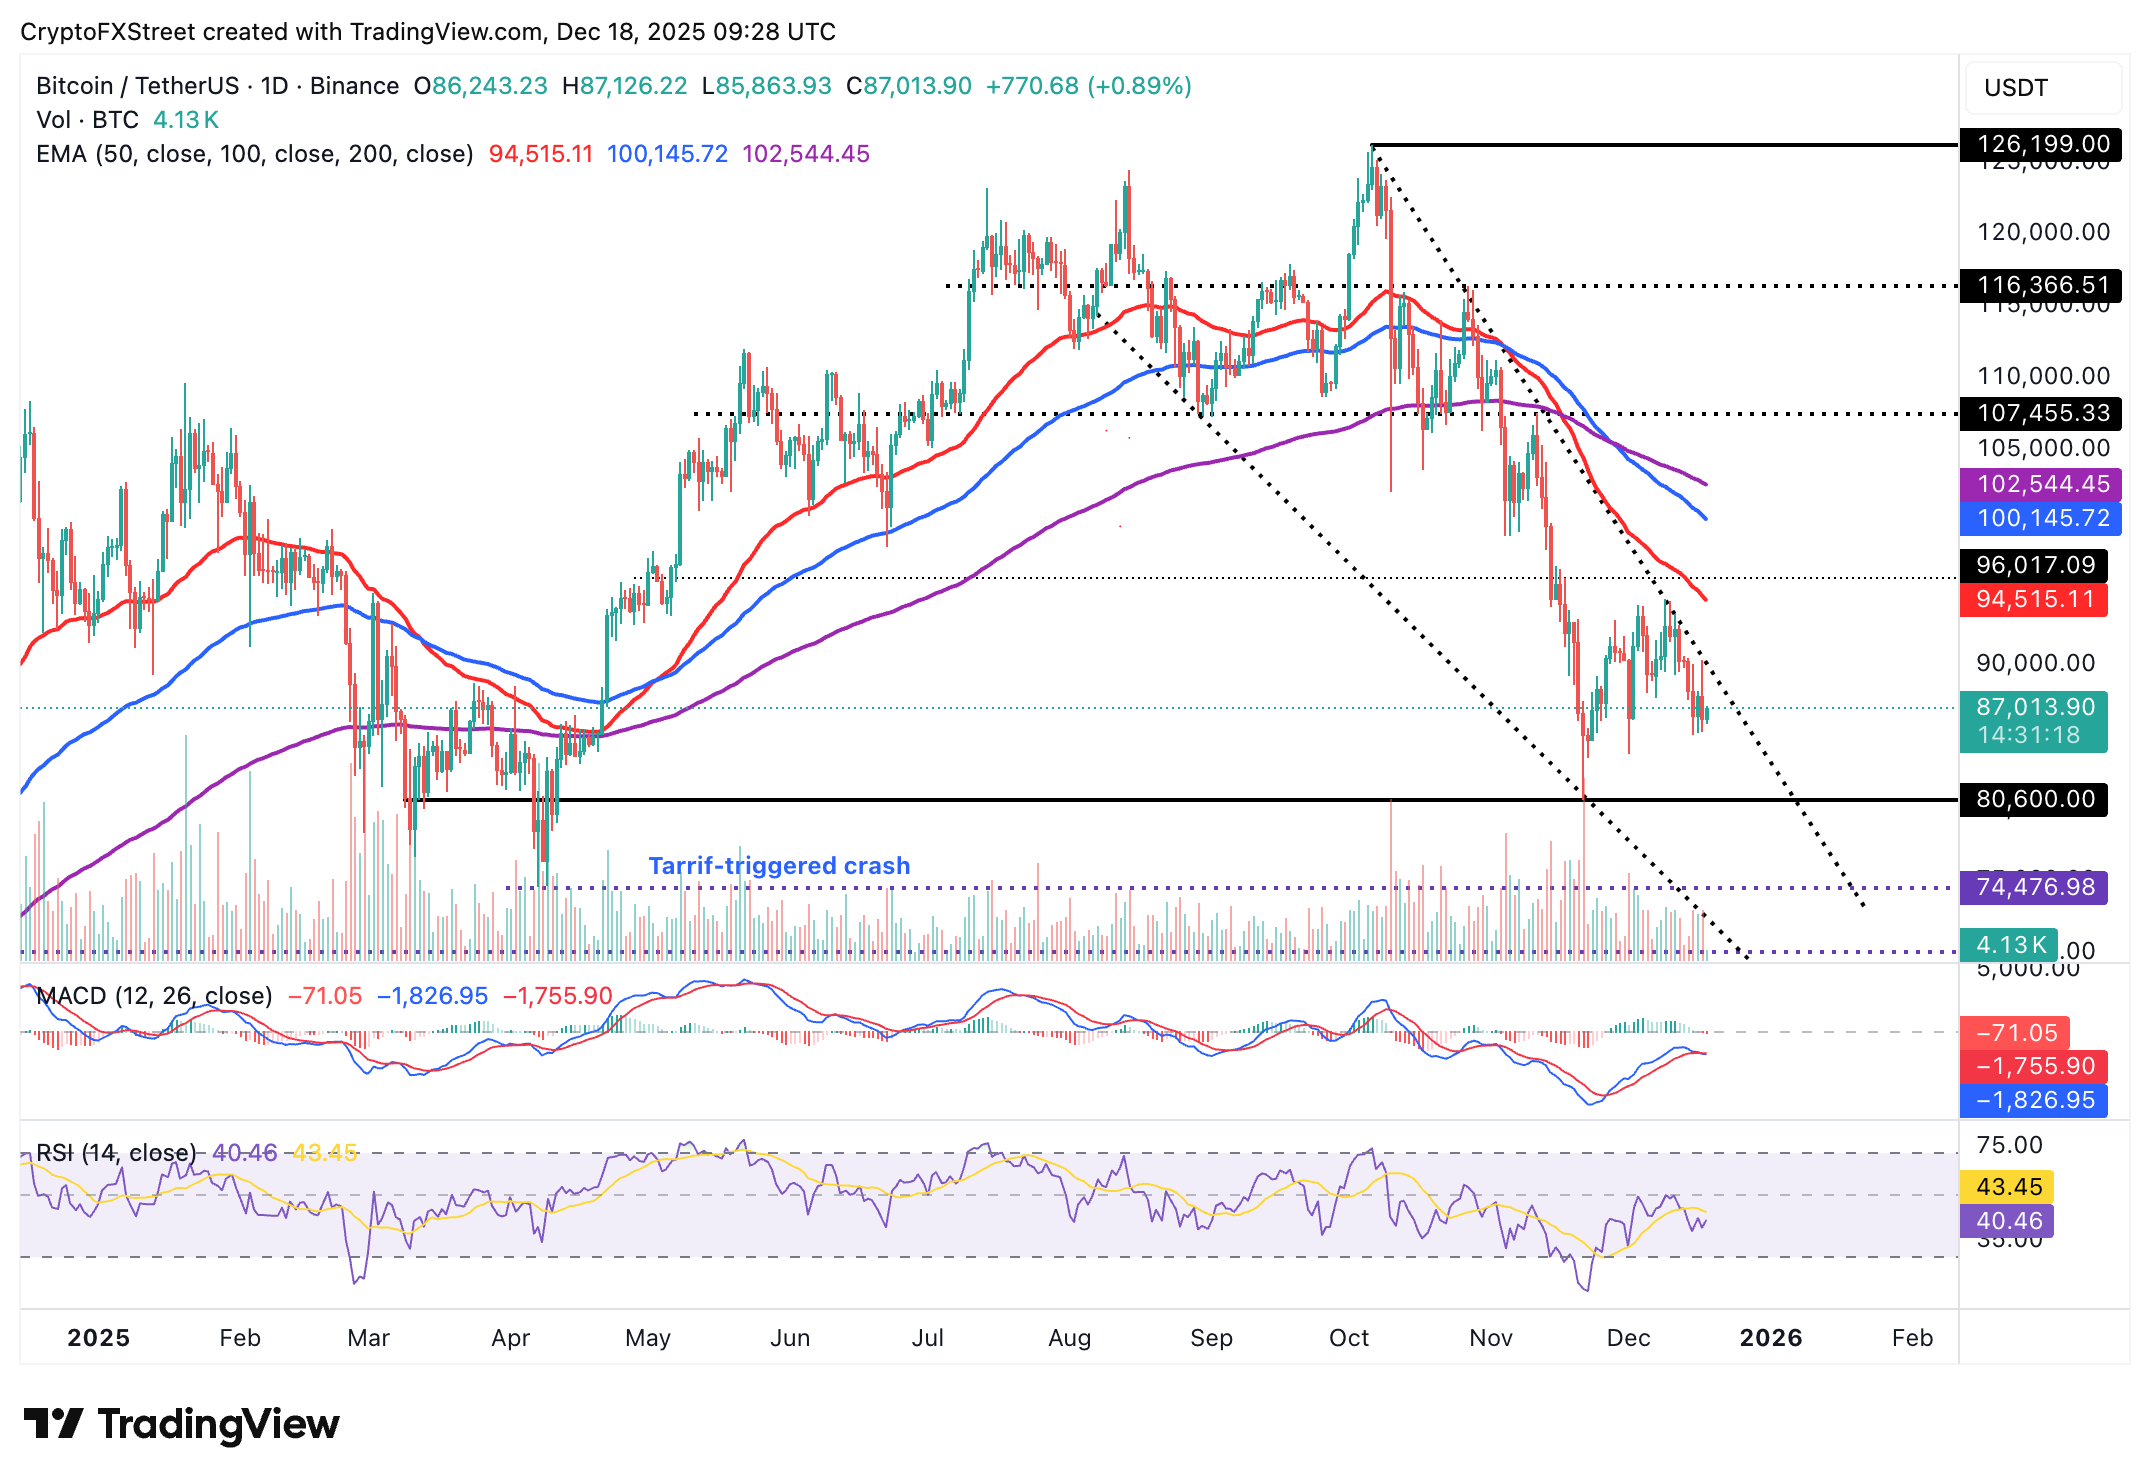
Bitcoin price is struggling to hold above $87,000 at the time of writing on Thursday after rebounding from the previous day’s low of $85,314. The Moving Average Convergence Divergence (MACD) indicator is poised to confirm a sell signal on the daily chart, which will manifest with the blue line crossing and settling below the red signal line.

Bitcoin also sits below the 50-day Exponential Moving Average (EMA) at $94,515, the 100-day EMA at $100,145 and the 200-day EMA at $102,544, all of which slope downward, affirming the bearish outlook.

On the upside, a close above the dotted descending trendline would mark the first step toward gaining momentum, potentially pushing BTC past the 50-day EMA. The Relative Strength Index (RSI) on the same daily chart has risen marginally to 40, as bulls push to reclaim $90,000. The RSI should extend its recovery above the midline to reinforce a bullish turnaround toward $100,000.

BTC/USDT daily chart

Altcoins update: Can Ethereum, XRP hold key support?

Ethereum is trading above its short-term support at $2,800 at the time of writing on Thursday, as the broader cryptocurrency market struggles with heightened volatility.

The RSI on the daily chart has stabilised at 38 within the bearish region, suggesting that ETH has the potential for a knee-jerk recovery, but remains largely in bearish hands.

The MACD indicator on the daily chart confirmed a sell signal on Wednesday when the blue line crossed below the red signal line. Investors may consider reducing their exposure, especially with the red histogram bars expanding below the mean line.

Looking up, a close above the pivotal $3,000 level could help shape the uptrend. However, the downward-trending 50-day EMA at $3,230, the 200-day EMA at $3,422 and the 100-day EMA at $3,438 support an overall bearish outlook. Bulls should push to reclaim the moving averages as support, paving the way for a sustained uptrend.

ETH/USDT daily chart

As for XRP, sellers are largely in control despite support at $1.82 holding on Thursday. The MACD indicator on the daily chart has maintained a sell signal since Tuesday, which may prompt investors to reduce risk exposure, further driving selling pressure.

XRP/USDT daily chart

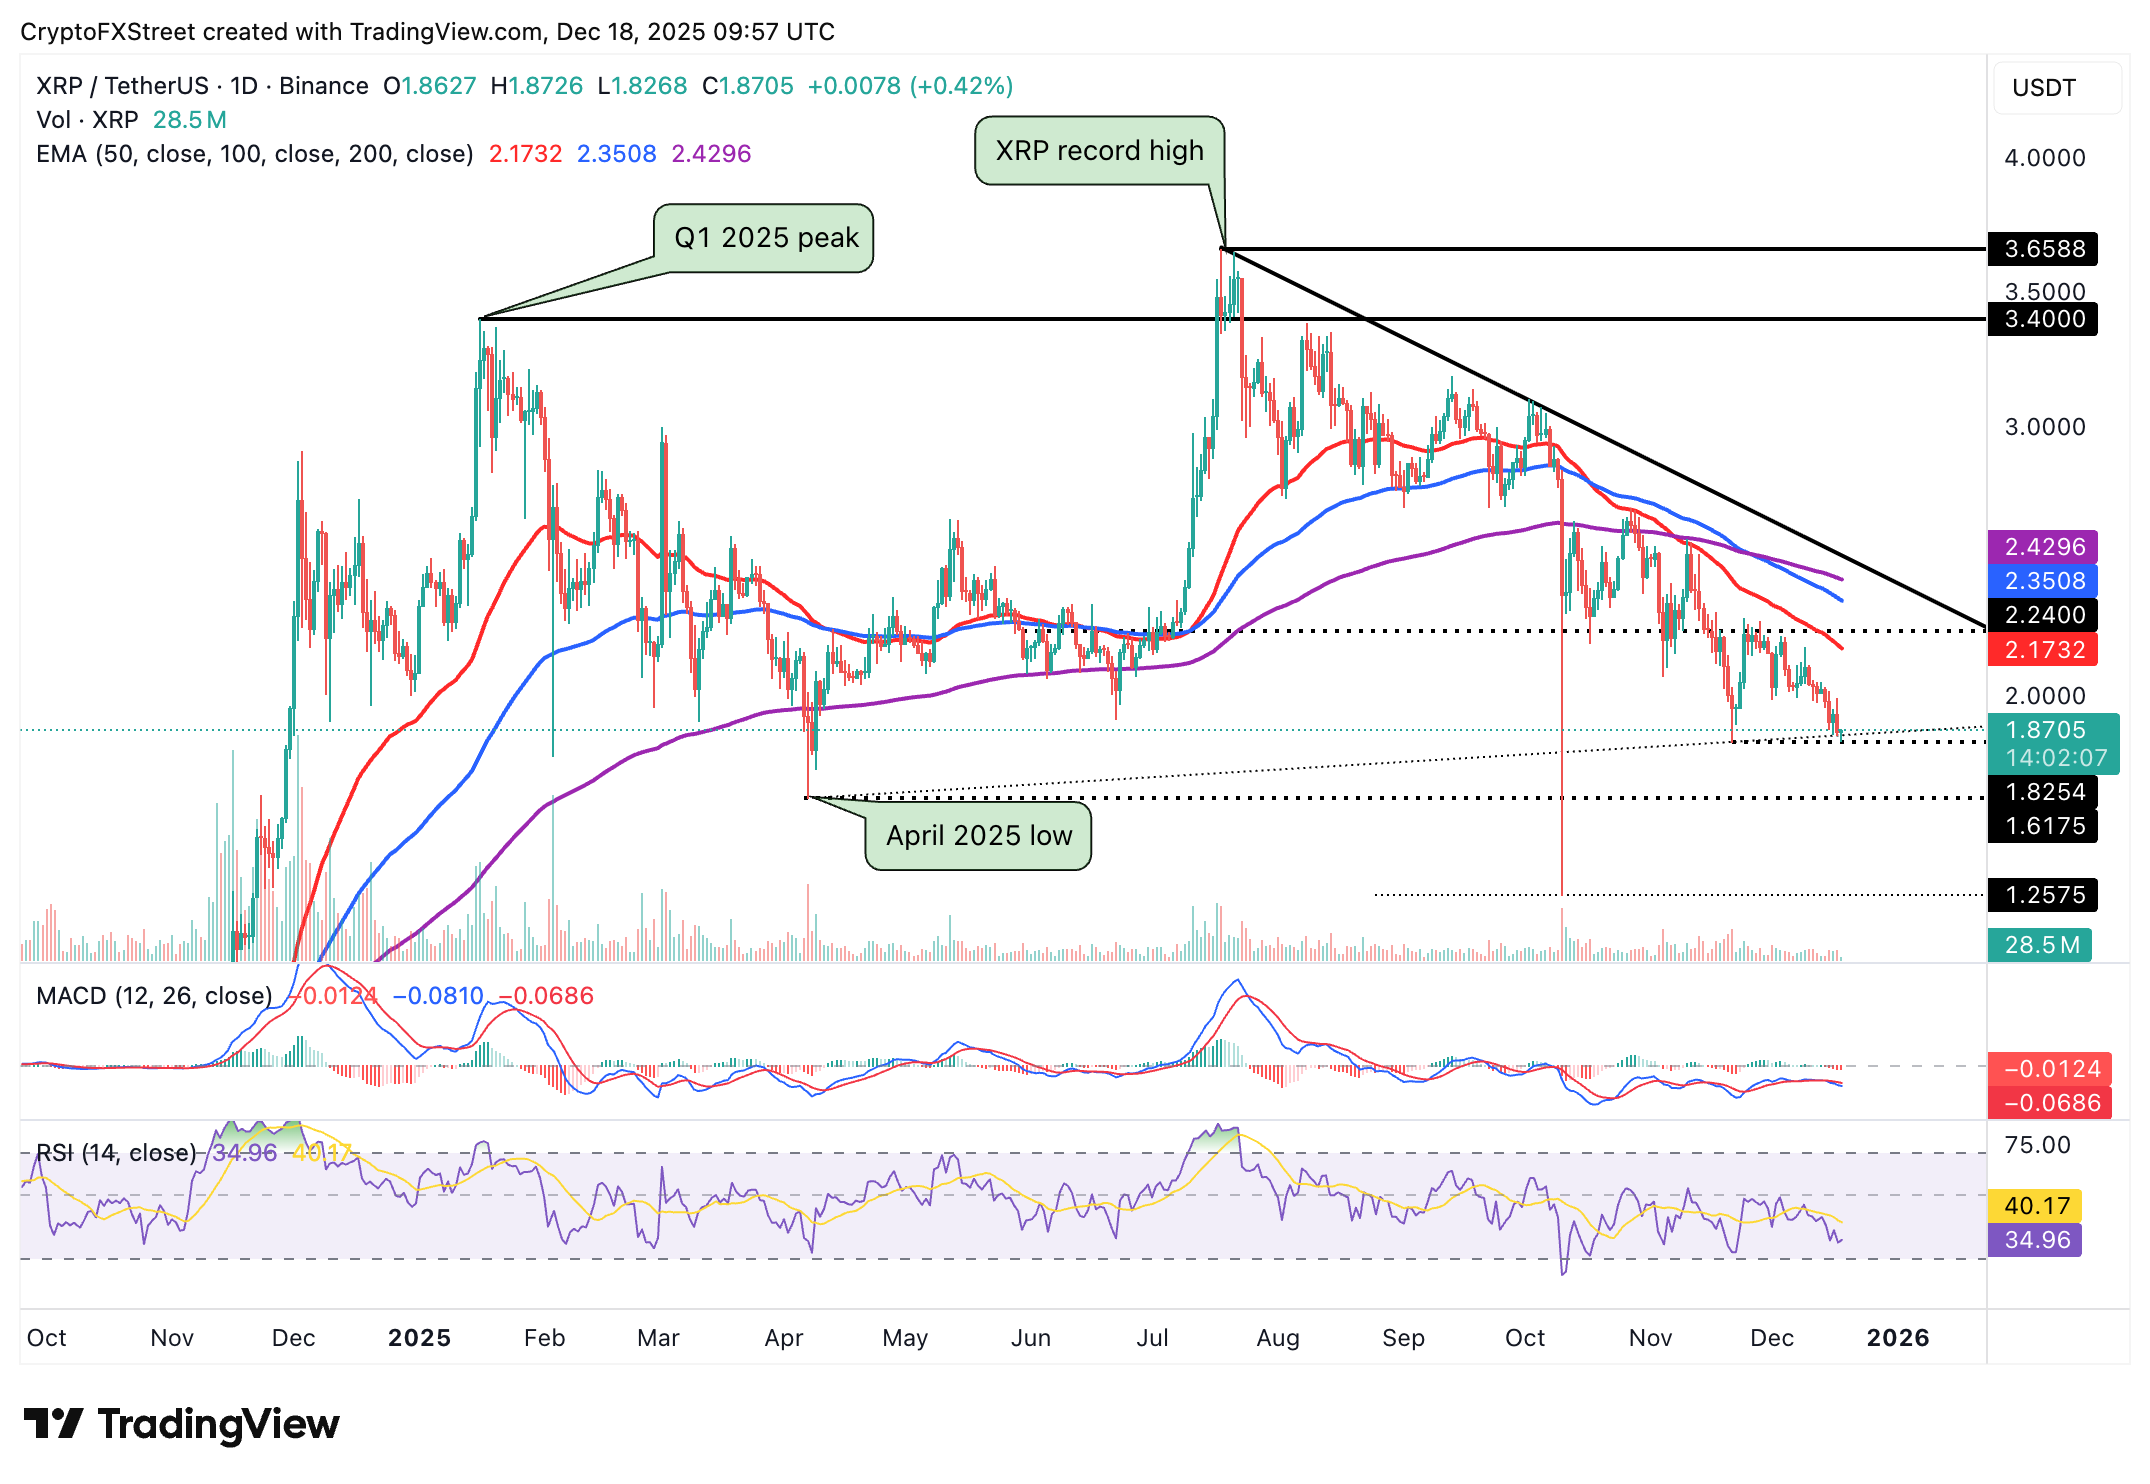
Meanwhile, the RSI has stabilized at 35 on the same chart, which implies XRP may consolidate ahead of a potential recovery targeting highs above $2.00. However, XRP should close above the 50-day EMA at $2.17 to mark the first major step toward a sustained uptrend. A descending trendline marks a significant resistance. This hurdle should be breached to pave the way for recovery beyond $2.50.

Crypto ETF FAQs

An Exchange-Traded Fund (ETF) is an investment vehicle or an index that tracks the price of an underlying asset. ETFs can not only track a single asset, but a group of assets and sectors. For example, a Bitcoin ETF tracks Bitcoin’s price. ETF is a tool used by investors to gain exposure to a certain asset.

Yes. The first Bitcoin futures ETF in the US was approved by the US Securities & Exchange Commission in October 2021. A total of seven Bitcoin futures ETFs have been approved, with more than 20 still waiting for the regulator’s permission. The SEC says that the cryptocurrency industry is new and subject to manipulation, which is why it has been delaying crypto-related futures ETFs for the last few years.

Yes. The SEC approved in January 2024 the listing and trading of several Bitcoin spot Exchange-Traded Funds, opening the door to institutional capital and mainstream investors to trade the main crypto currency. The decision was hailed by the industry as a game changer.

The main advantage of crypto ETFs is the possibility of gaining exposure to a cryptocurrency without ownership, reducing the risk and cost of holding the asset. Other pros are a lower learning curve and higher security for investors since ETFs take charge of securing the underlying asset holdings. As for the main drawbacks, the main one is that as an investor you can’t have direct ownership of the asset, or, as they say in crypto, “not your keys, not your coins.” Other disadvantages are higher costs associated with holding crypto since ETFs charge fees for active management. Finally, even though investing in ETFs reduces the risk of holding an asset, price swings in the underlying cryptocurrency are likely to be reflected in the investment vehicle too.

Disclaimer: For information purposes only. Past performance is not indicative of future results.
placeholder
Ethereum Price Slips Lower — $3,000 Looms as the Key BattlegroundEthereum is attempting to recover from a $3,026 low but remains below $3,200 and the 100-hour SMA, with a bearish trend line near $3,175 capping rebounds as bulls need a clean break above $3,200 to target $3,250–$3,400, while a drop below $3,050 risks a retest of $3,000 and $2,940.
Author  Mitrade
Dec 15, Mon
Ethereum is attempting to recover from a $3,026 low but remains below $3,200 and the 100-hour SMA, with a bearish trend line near $3,175 capping rebounds as bulls need a clean break above $3,200 to target $3,250–$3,400, while a drop below $3,050 risks a retest of $3,000 and $2,940.
placeholder
Bitcoin Slides 5% as Sellers Lean In — Can BTC Reclaim $88,000?Bitcoin has dropped back below $88,000 after rolling over from $90,500, with price still trading under the 100-hour Simple Moving Average. The sell-off found a floor at $85,151, and BTC is now consolidating near that base, but rebounds are facing pressure from a bearish trend line around $89,000. Bulls need to retake $88,000–$89,000 to ease downside risk; failure to do so keeps $85,500–$85,000 and then $83,500 in play, with $80,000 as the deeper “line in the sand.” Bitcoin (BTC) is back in damage-control mode after a sharp pullback wiped out recent gains. The price failed to reclaim the $90,000–$90,500 band, rolled over, and slid through $88,500 before briefly dipping under $87,000. Buyers did show up around $85,000, but the rebound so far looks more like stabilization than a clear trend reversal. Bitcoin dips hard, finds a bid near $85,000(h3) BTC’s latest move lower began when it couldn’t build follow-through above $90,000 and $90,500. Once that upside stalled, sellers took control and pushed price down through $88,500. The slide accelerated enough to spike below $87,000, but the market didn’t free-fall. Bulls defended the $85,000 zone, printing a low at $85,151. Since then, Bitcoin has been consolidating below the 23.6% Fibonacci retracement of the drop from the $93,560 swing high to the $85,151 low — a clue that the bounce is still shallow and that sellers haven’t fully backed off yet. Structurally, BTC is still on the back foot: It’s trading below $88,000, and It remains below the 100-hour Simple Moving Average, keeping short-term trend pressure pointed downward. Resistance is layered, and $89,000 is the problem area(h3) If bulls try to turn this into a recovery, they’ll have to climb through multiple ceilings in quick succession. First, BTC faces resistance around $87,150, followed by a more meaningful barrier near $87,500. From there, the market’s attention snaps back to $88,000 — the level BTC just lost and now needs to reclaim. A close back above $88,000 would improve the tone, but it doesn’t solve the bigger issue: there’s a bearish trend line on the hourly BTC/USD chart (Kraken feed) with resistance near $89,000, which also lines up with the next technical hurdle. If BTC can push through $89,000 and hold, the rebound could extend toward $90,000, with follow-through targets at $91,000 and $91,500. But until price clears that $88,000–$89,000 zone, rallies are at risk of being sold rather than chased. If BTC fails to reclaim resistance, the downside path is clear(h3) The near-term bear case is simple: if Bitcoin can’t climb back above the $87,000 area and keep traction, sellers may attempt another leg lower. Support levels line up like this: Immediate support: $85,500 First major support: $85,000 Next support: $83,500 Then $82,500 in the near term Below that, the major “don’t break this” level is still $80,000. If BTC slips under $80,000, the risk of acceleration to the downside increases significantly — not because it’s magic, but because it’s the kind of psychological and structural level that tends to trigger forced de-risking. Indicators: momentum still leans bearish(h3) The intraday indicators aren’t offering much comfort yet: Hourly MACD is losing pace in the bearish zone. Hourly RSI remains below 50, suggesting sellers still have the upper hand on short timeframes. So while the $85,000 defense held for now, the market hasn’t flipped bullish — it’s just stopped bleeding.
Author  Mitrade
Dec 16, Tue
Bitcoin has dropped back below $88,000 after rolling over from $90,500, with price still trading under the 100-hour Simple Moving Average. The sell-off found a floor at $85,151, and BTC is now consolidating near that base, but rebounds are facing pressure from a bearish trend line around $89,000. Bulls need to retake $88,000–$89,000 to ease downside risk; failure to do so keeps $85,500–$85,000 and then $83,500 in play, with $80,000 as the deeper “line in the sand.” Bitcoin (BTC) is back in damage-control mode after a sharp pullback wiped out recent gains. The price failed to reclaim the $90,000–$90,500 band, rolled over, and slid through $88,500 before briefly dipping under $87,000. Buyers did show up around $85,000, but the rebound so far looks more like stabilization than a clear trend reversal. Bitcoin dips hard, finds a bid near $85,000(h3) BTC’s latest move lower began when it couldn’t build follow-through above $90,000 and $90,500. Once that upside stalled, sellers took control and pushed price down through $88,500. The slide accelerated enough to spike below $87,000, but the market didn’t free-fall. Bulls defended the $85,000 zone, printing a low at $85,151. Since then, Bitcoin has been consolidating below the 23.6% Fibonacci retracement of the drop from the $93,560 swing high to the $85,151 low — a clue that the bounce is still shallow and that sellers haven’t fully backed off yet. Structurally, BTC is still on the back foot: It’s trading below $88,000, and It remains below the 100-hour Simple Moving Average, keeping short-term trend pressure pointed downward. Resistance is layered, and $89,000 is the problem area(h3) If bulls try to turn this into a recovery, they’ll have to climb through multiple ceilings in quick succession. First, BTC faces resistance around $87,150, followed by a more meaningful barrier near $87,500. From there, the market’s attention snaps back to $88,000 — the level BTC just lost and now needs to reclaim. A close back above $88,000 would improve the tone, but it doesn’t solve the bigger issue: there’s a bearish trend line on the hourly BTC/USD chart (Kraken feed) with resistance near $89,000, which also lines up with the next technical hurdle. If BTC can push through $89,000 and hold, the rebound could extend toward $90,000, with follow-through targets at $91,000 and $91,500. But until price clears that $88,000–$89,000 zone, rallies are at risk of being sold rather than chased. If BTC fails to reclaim resistance, the downside path is clear(h3) The near-term bear case is simple: if Bitcoin can’t climb back above the $87,000 area and keep traction, sellers may attempt another leg lower. Support levels line up like this: Immediate support: $85,500 First major support: $85,000 Next support: $83,500 Then $82,500 in the near term Below that, the major “don’t break this” level is still $80,000. If BTC slips under $80,000, the risk of acceleration to the downside increases significantly — not because it’s magic, but because it’s the kind of psychological and structural level that tends to trigger forced de-risking. Indicators: momentum still leans bearish(h3) The intraday indicators aren’t offering much comfort yet: Hourly MACD is losing pace in the bearish zone. Hourly RSI remains below 50, suggesting sellers still have the upper hand on short timeframes. So while the $85,000 defense held for now, the market hasn’t flipped bullish — it’s just stopped bleeding.
placeholder
December Santa Claus Rally: New highs in sight for US and European stocks?Historical data show a rising trend of US and European stocks in December. If the momentum is strong, fund managers may rush in with a buying frenzy.
Author  Mitrade
Yesterday 02: 50
Historical data show a rising trend of US and European stocks in December. If the momentum is strong, fund managers may rush in with a buying frenzy.
placeholder
XRP’s Price Action Flashes a Warning Even as ETF Flows Stay PositiveXRP’s structure remains weak despite 18 straight positive closes in spot XRP ETFs, with analysts warning that $1.98 and other nearby resistance zones could cap rebounds unless the YO region is reclaimed, while deeper downside scenarios keep $1.53 on watch as a potential (not guaranteed) accumulation area.
Author  Mitrade
Yesterday 06: 37
XRP’s structure remains weak despite 18 straight positive closes in spot XRP ETFs, with analysts warning that $1.98 and other nearby resistance zones could cap rebounds unless the YO region is reclaimed, while deeper downside scenarios keep $1.53 on watch as a potential (not guaranteed) accumulation area.
placeholder
Gold declines on profit-taking, USD strength ahead of US CPI releaseGold price (XAU/USD) edges lower below $4,350 during the Asian trading hours on Thursday. The precious metal retreats from seven-week highs amid some profit-taking and a rebound in the US Dollar (USD).
Author  FXStreet
6 hours ago
Gold price (XAU/USD) edges lower below $4,350 during the Asian trading hours on Thursday. The precious metal retreats from seven-week highs amid some profit-taking and a rebound in the US Dollar (USD).
goTop
quote