

Top Crypto Gainers: SPX6900, Pi Network, Filecoin – Sudden rebound lifts bullish spirit
- SPX6900 holds above $0.50 with a 5% rebound on Tuesday, breaking above a short-term resistance trendline.
- Pi Network is up nearly 2% on Wednesday, extending the breakout of a falling channel pattern on the 4-hour chart.
- Filecoin recovers nearly 4% in the last 24 hours, indicating a decline in selling pressure that could extend the rebound.
SPX6900 (SPX), Pi Network (PI), and Filecoin (FIL) emerge as top gainers in the last 24 hours as the broader cryptocurrency market remains under bearish pressure. The sudden rebound in SPX, PI, and FIL suggests a possible rally, as the Moving Average Convergence Divergence (MACD) indicator on the 4-hour chart flashes a buy signal.
SPX6900 recovery run takes a breather
SPX6900 breaks above a local resistance trendline on the 4-hour chart after a 5% jump on Tuesday to hold above the $0.5000 psychological level. At the time of writing, SPX takes a breather on Wednesday, struggling to break above $0.5500.
If the uptrend extends, the meme coin could face Friday’s low at $0.5727 as the immediate resistance, followed by the 50-period Exponential Moving Average (EMA) at $0.5807.
Apart from the MACD buy signal highlighted by a crossover, the Relative Strength Index (RSI) at 43 on the 4-hour chart signals a reduction in selling pressure.
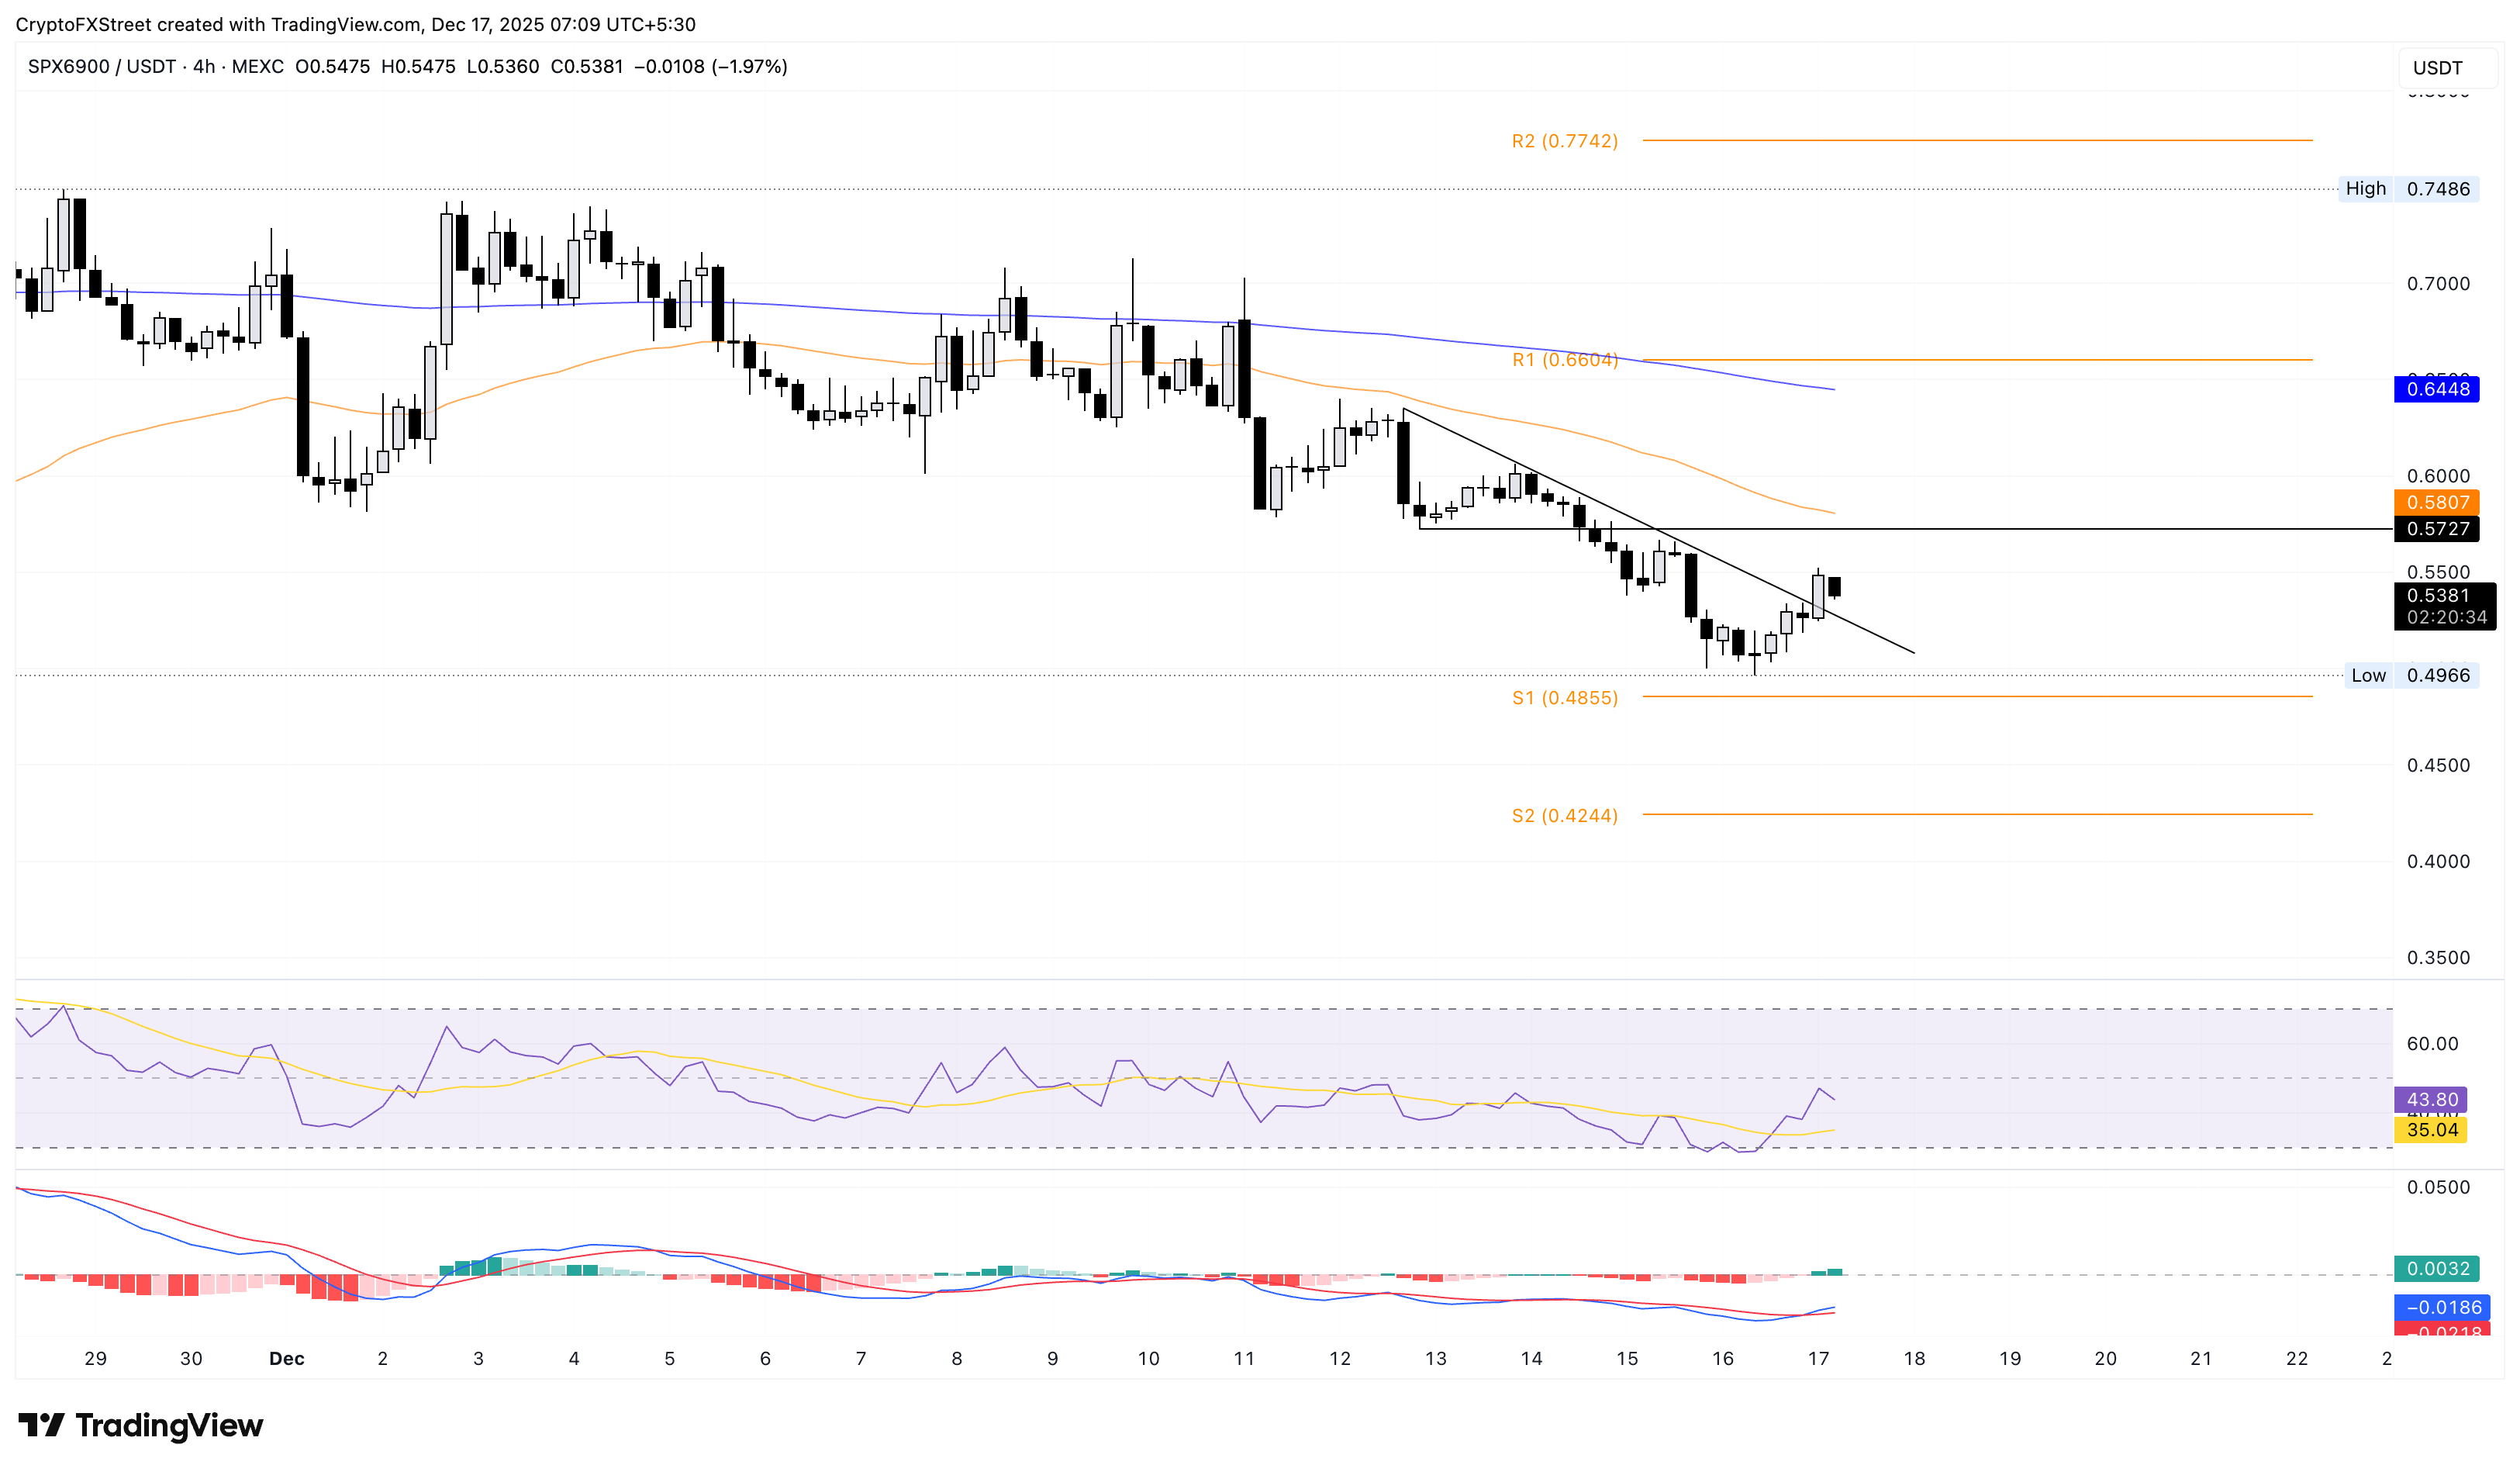
Looking down, if SPX dips below the S1 Pivot Point at $0.4855, it could extend the decline to the S2 Pivot Point at $0.4244.
Pi Network’s recovery faces opposition at a crucial moving average
Pi Network edges higher by nearly 2% at press time on Wednesday, resurfacing above the $0.2000 psychological level. The PI token breaks out of a falling channel pattern on the 4-hour chart formed by two parallel declining trendlines.
The breakout rally tests the 50-period EMA at $0.2080, and a decisive close above this level could further boost the recovery to the R1 Pivot Point at $0.2179.
The RSI at 58 signals renewed buying pressure on the 4-hour timeframe, while the MACD shows a fresh green histogram, indicating a rise in bullish momentum.
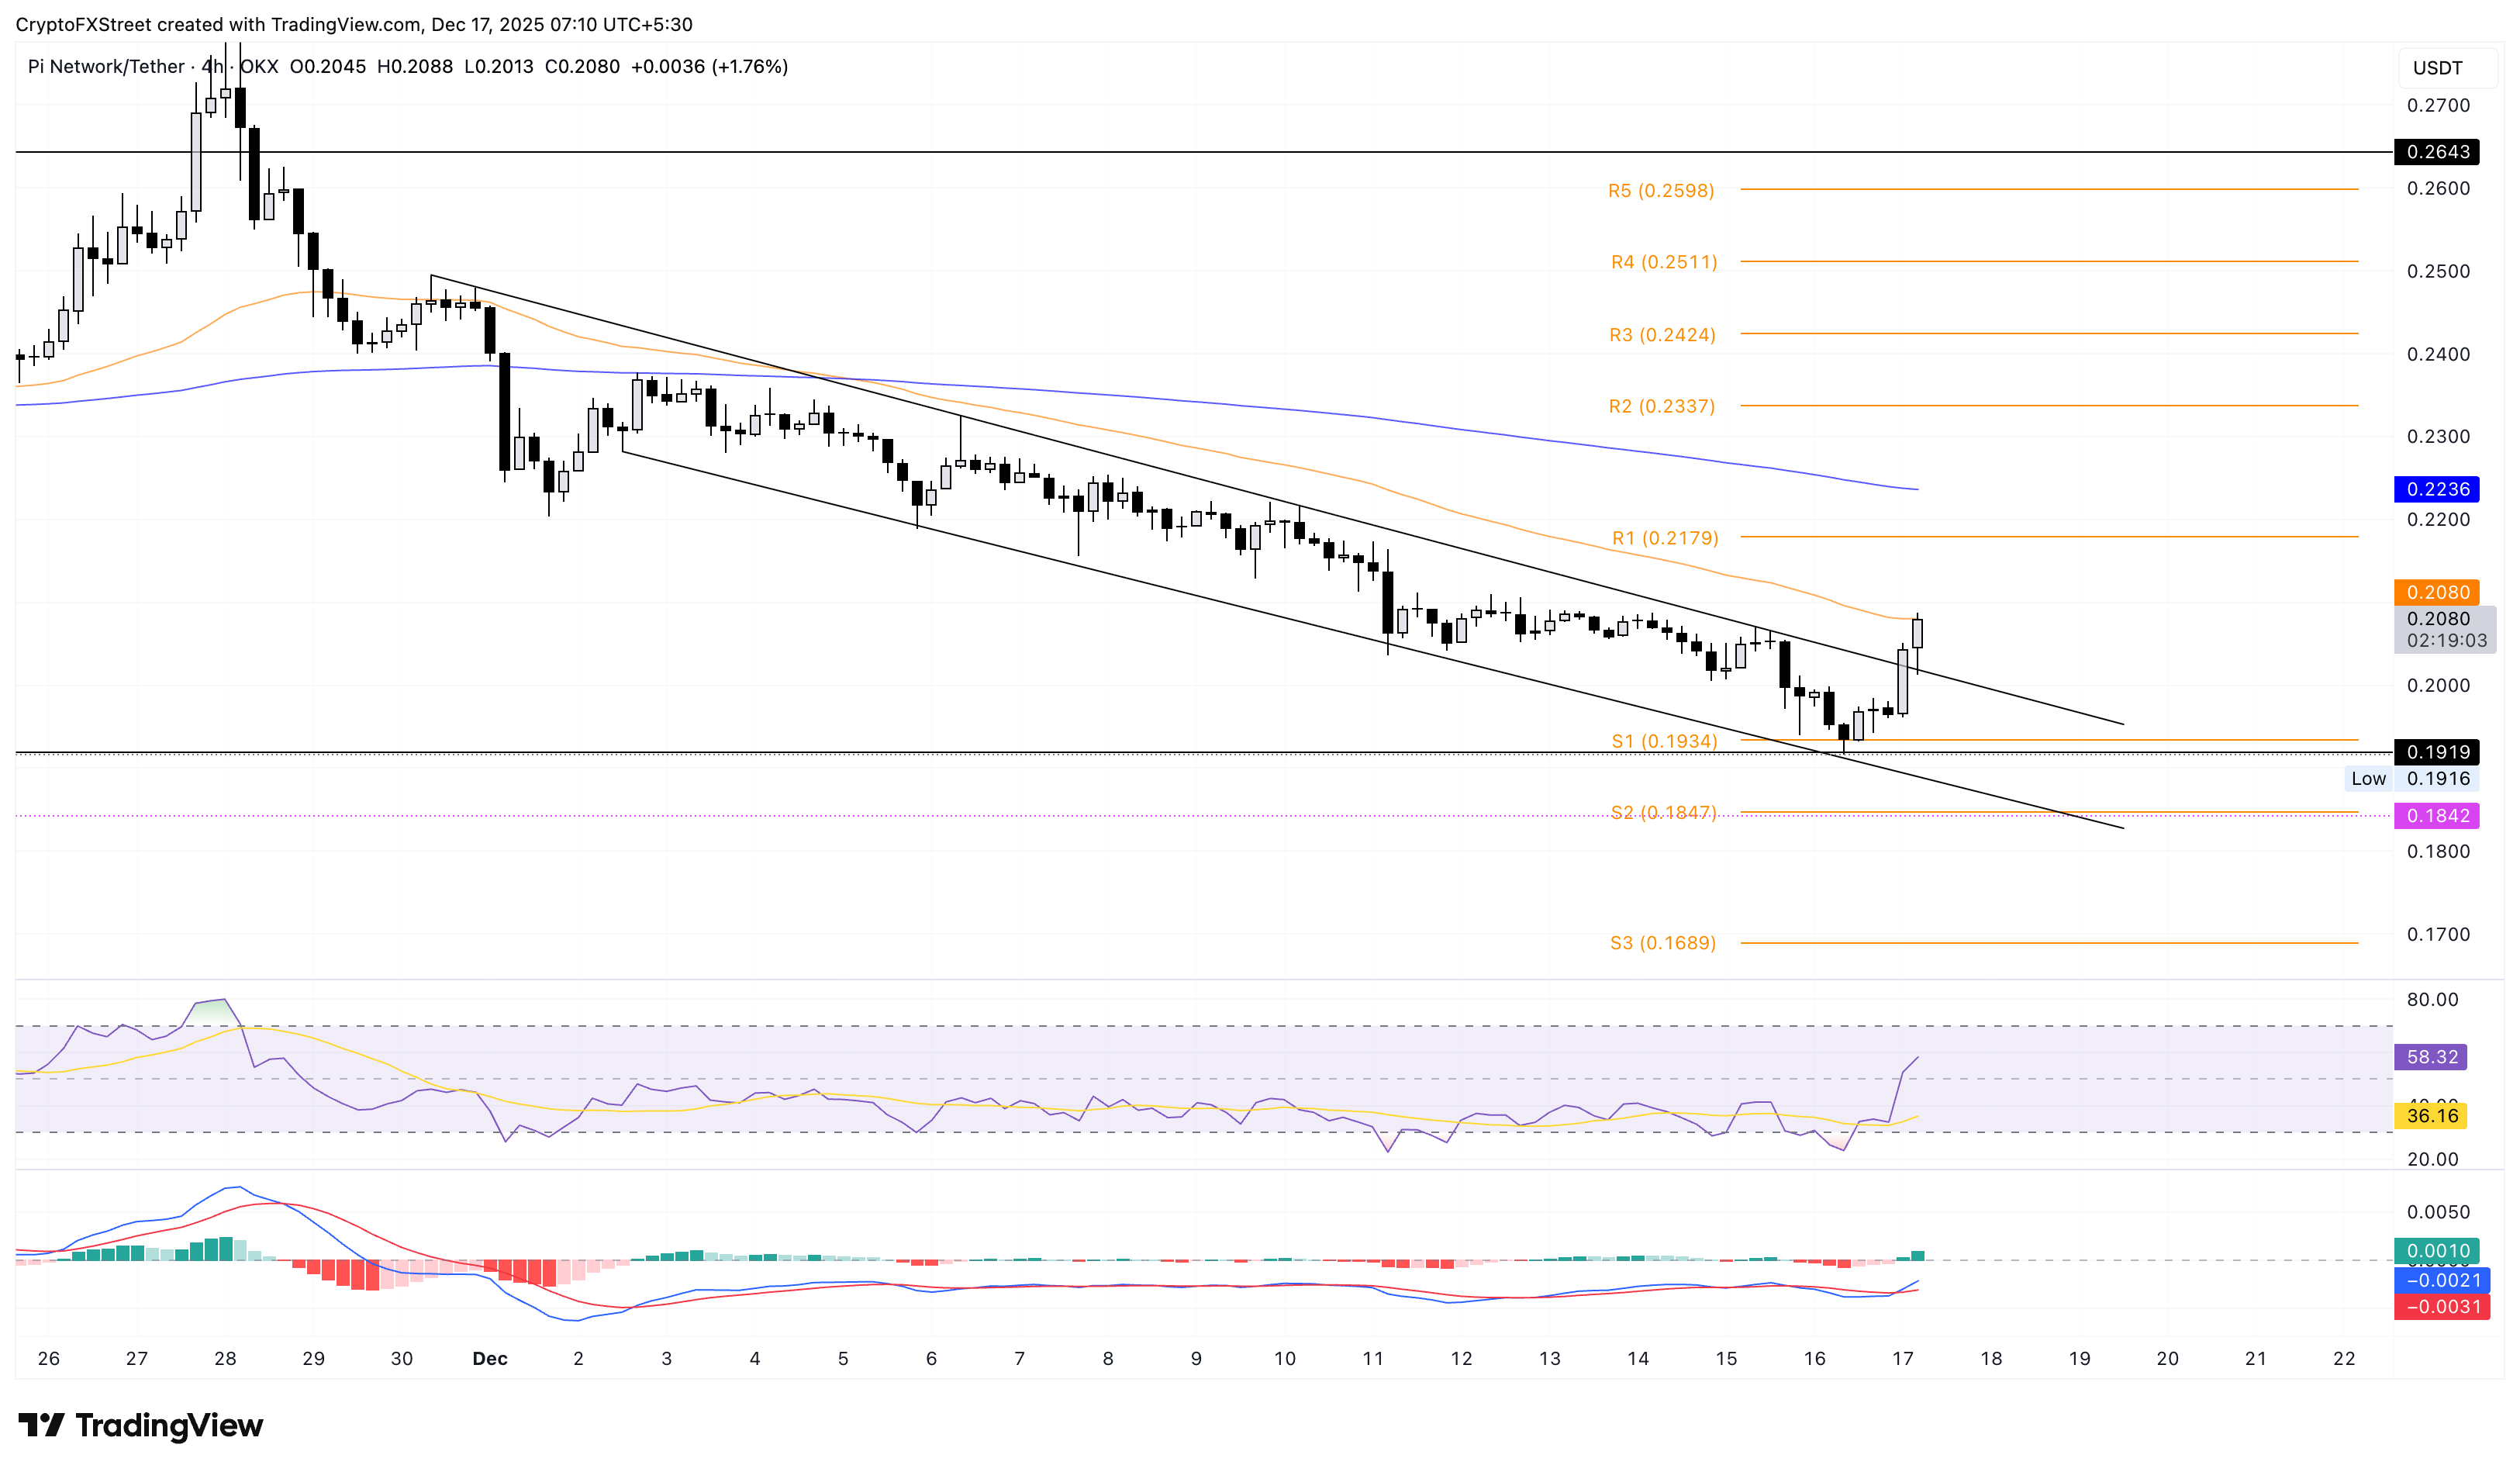
If PI reverses from $0.2080, it could retest the broken resistance trendline near $0.2000.
Filecoin aims for trend reversal as selling pressure wanes
Filecoin edges higher by 2% at the time of writing on Wednesday, extending the 2% gains from the previous day. The FIL token marks the breakout of a short-term resistance trendline on the 4-hour chart as bulls attempt to break the trend of lower highs formation.
A potential close above the $1.30 could extend the rebound toward the 50-period EMA at $1.36.
Similar to other top performers, the momentum indicators on the 4-hour chart suggest a sharp decline in selling pressure. The RSI at 47 approaches the halfway line from the oversold zone on Monday. At the same time, MACD extends the uptrend after crossing above its signal line, indicating a surge in bullish momentum.
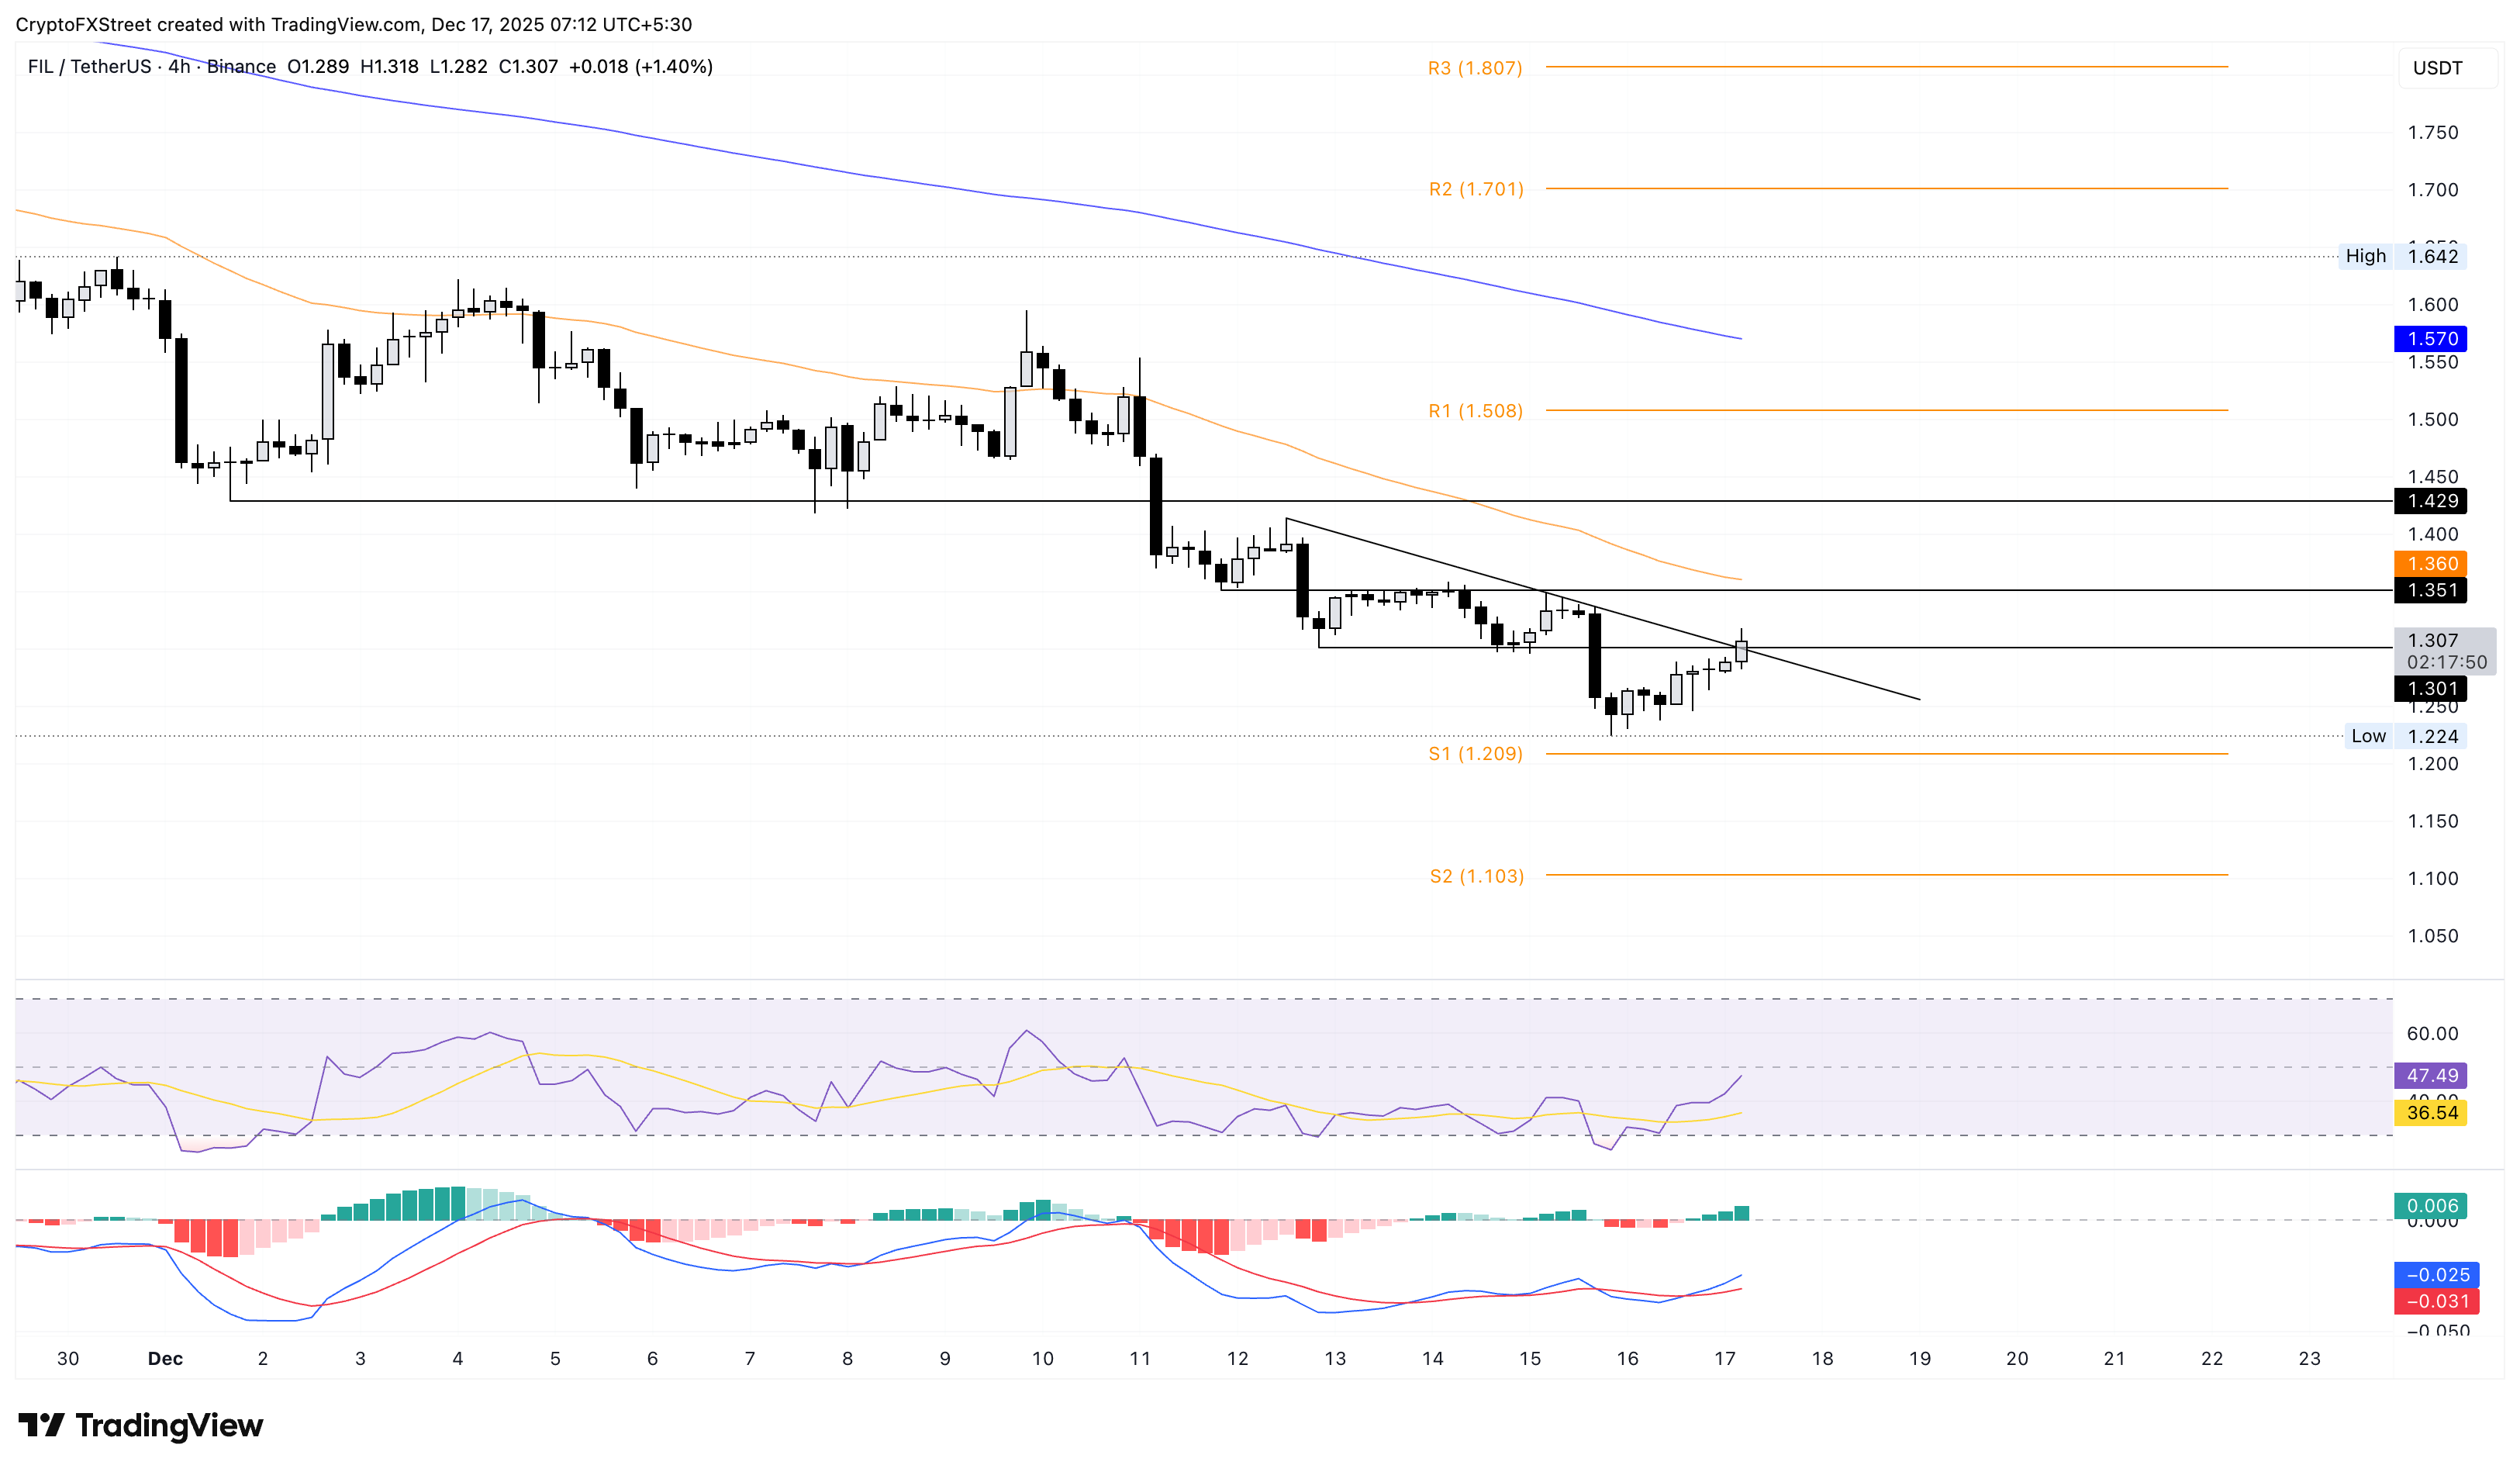
On the downside, if FIL reverses from $1.30, it could find support at $1.20, aligning with the S1 Pivot Point.
Recommended Articles


