Hyperliquid Price Forecast: HYPE stabilizes amid plans to burn assistance fund

Source Fxstreet
  • Hyperliquid tests the $26 mark after three consecutive days of losses.
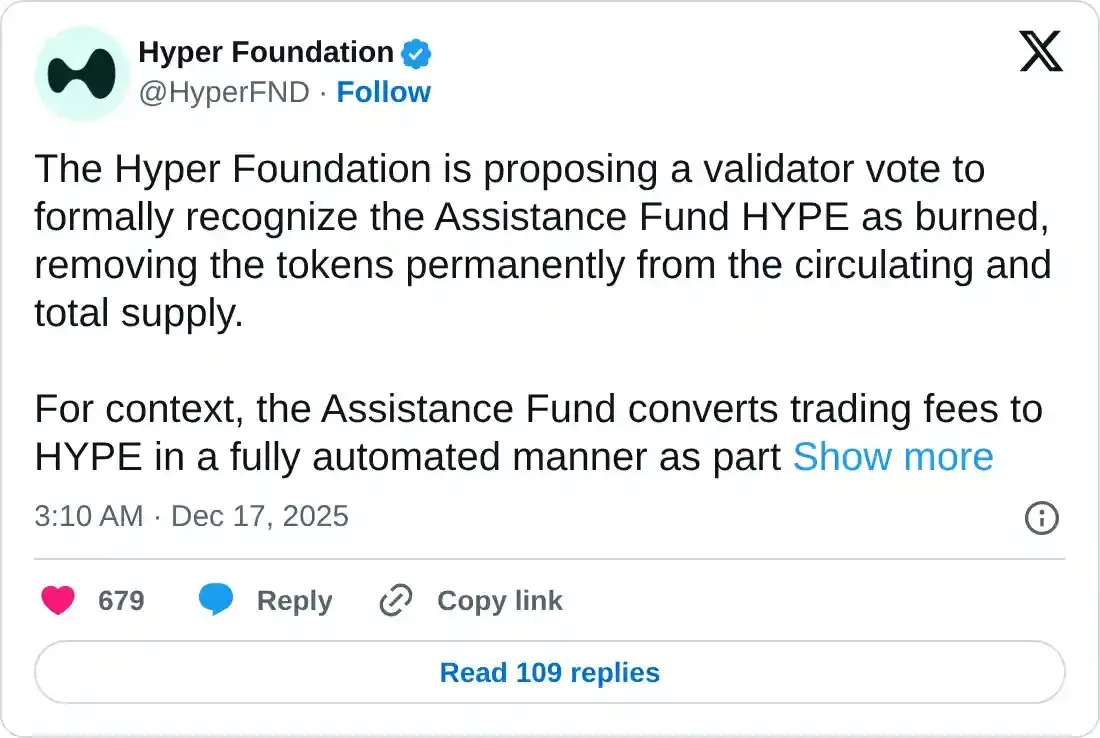
  • Hyperliquid Foundation has proposed a validator vote to permanently remove the assistance fund supply from circulation, ending on Sunday.
  • Derivatives data suggests a rise in bullish interest with a boost in Open Interest and funding rate.

Hyperliquid (HYPE) stabilizes above $26 at press time on Wednesday after three straight days of losses. Hyperliquid Foundation has started a validator vote to reduce supply by burning the assistance fund, which holds over 37 million HYPE tokens. The potential supply-reduction stimulus boosted bullish sentiment in the derivatives market, as evidenced by increased Open Interest and the funding rate.

Voting begins to burn assistance fund sparks bullish sentiment in HYPE Derivatives

Hyperliquid Foundation plans to permanently remove 37.11 million HYPE tokens from circulation, representing 3.71% of the total supply, stored in its assistance fund address. The assistance fund automatically converted the trading fees collected by the perpetual-focused exchange to purchase its native token. 

Hyperliquid assistance fund. Source: HypurrScan

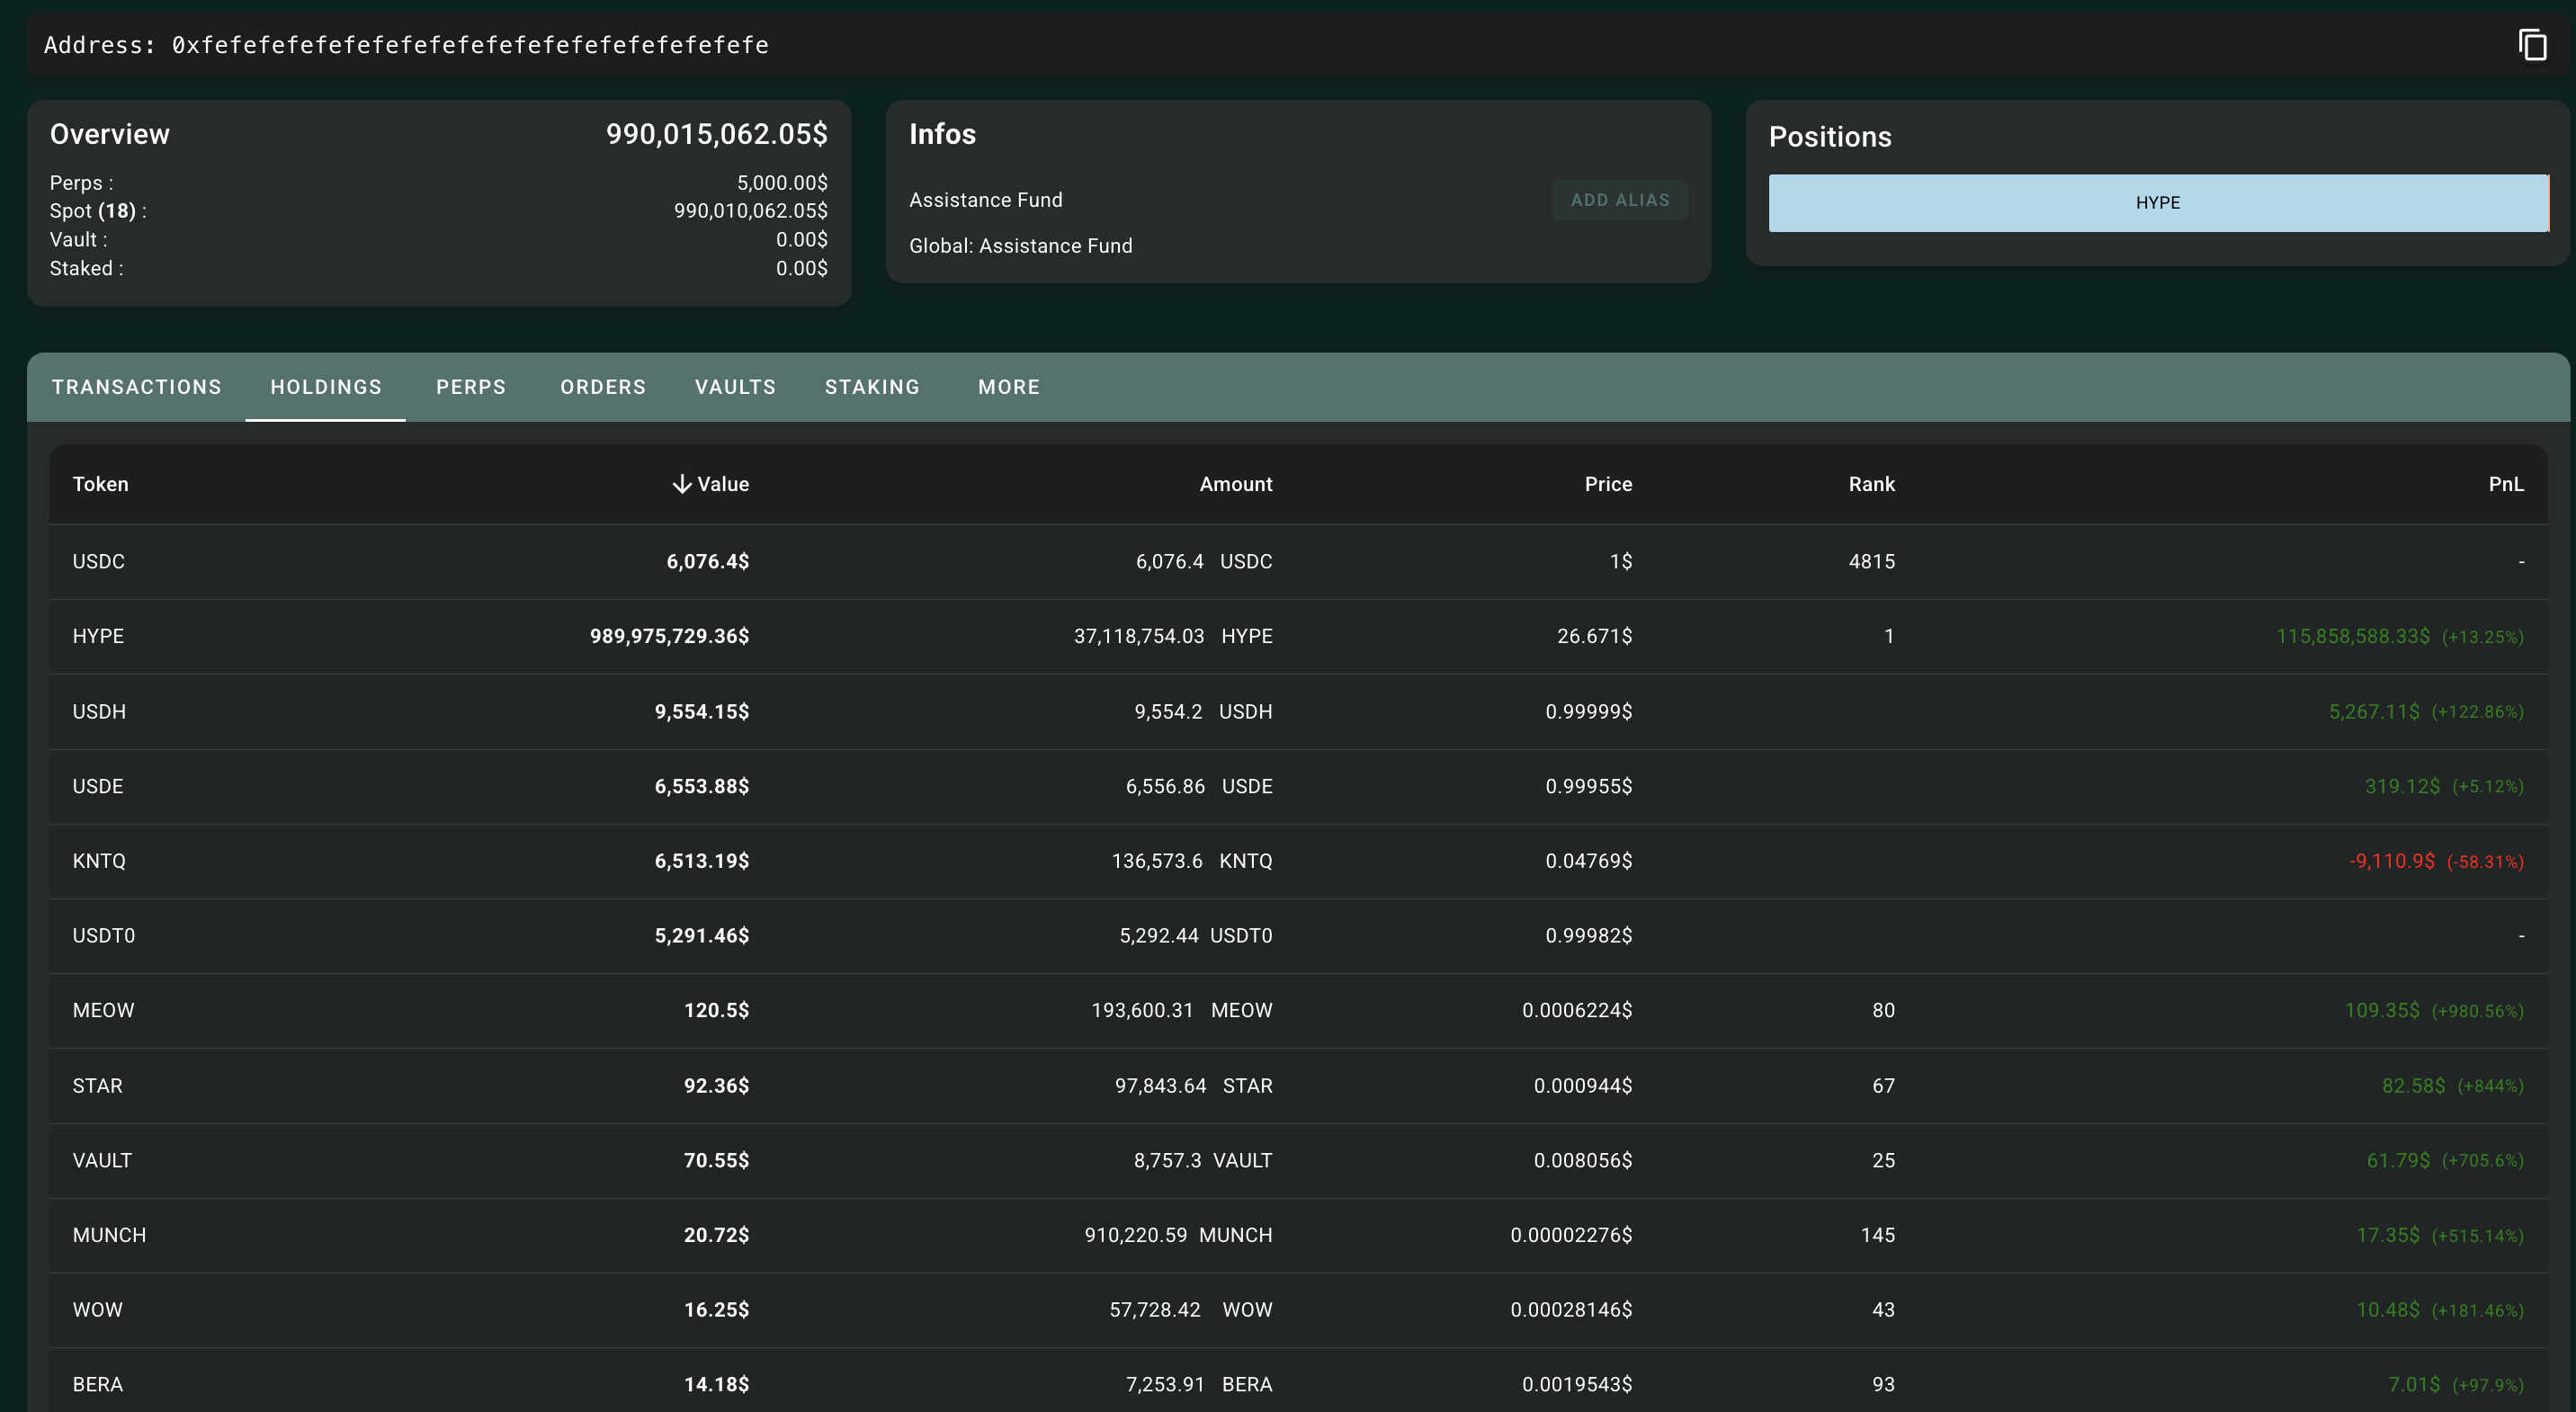
The lack of a private key ensured that the assistance fund address was never controlled, and a hard fork was necessary to access the funds. However, if the voting passes the burn, it will establish a social consensus that no protocol upgrades are to access this address. The results will be announced on December 24 based on the stake-weighted consensus. 

https://x.com/HyperFND/status/2001127850754367525

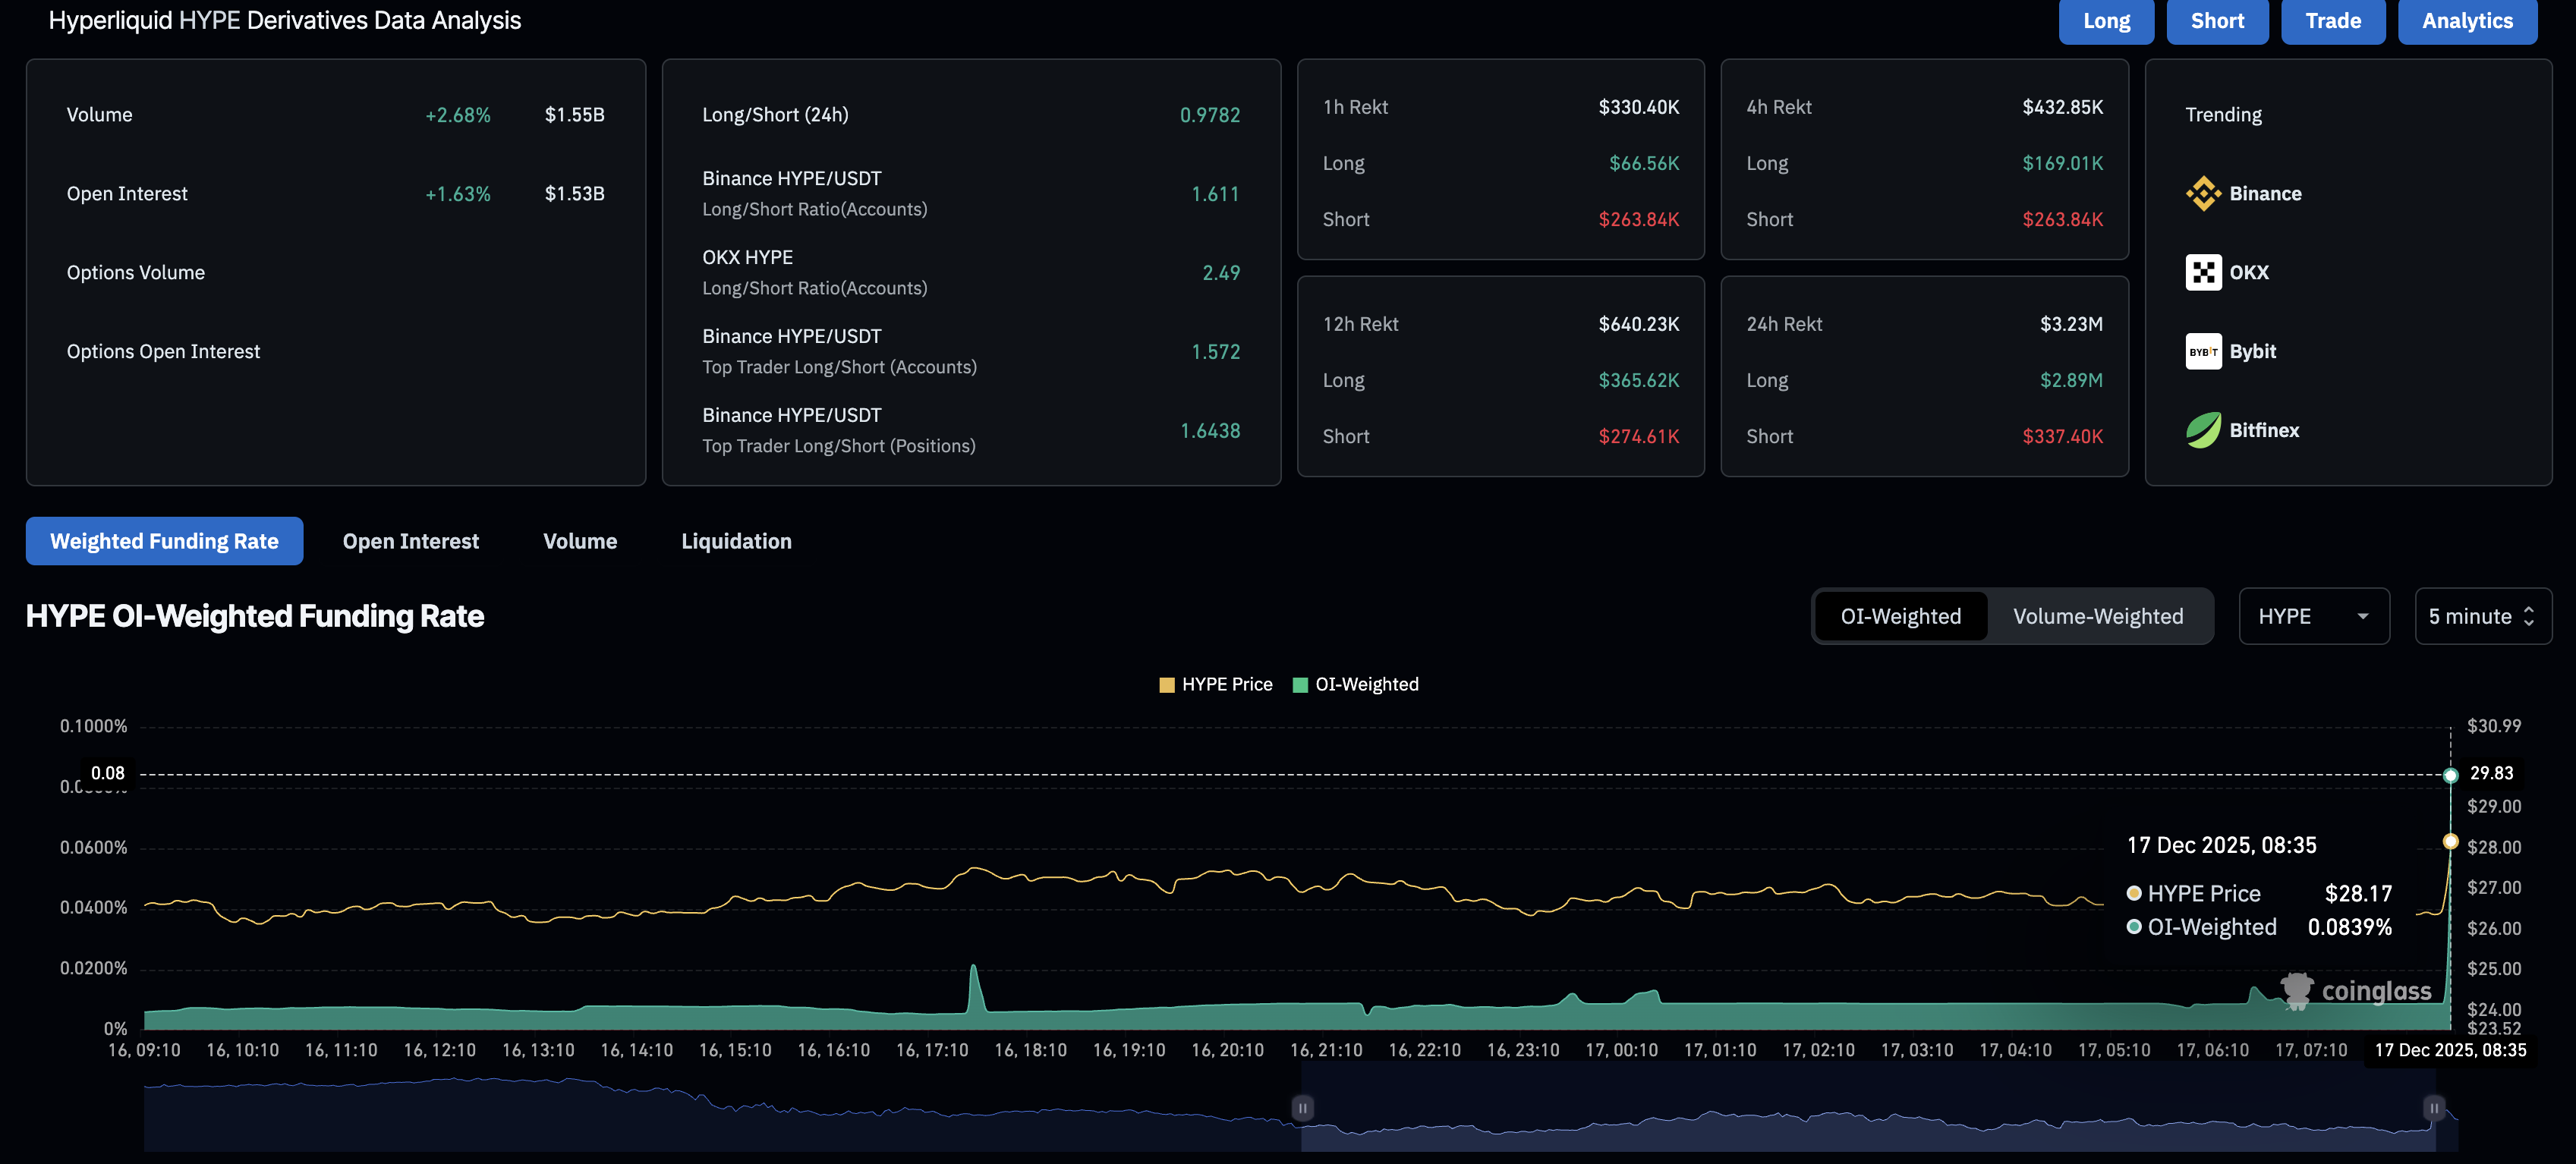
On the derivatives side, the sudden news of a potential supply drop boosts bullish sentiment. CoinGlass data shows that the Open Interest (OI) has increased by 1.63% in the last 24 hours to $1.53 billion, indicating a rise in the notional value of active positions. 

However, the OI-weighted funding rate at 0.0839% indicates a sharp surge in buying pressure reflecting a bullish positional buildup.

HYPE derivatives data. Source: CoinGlass

Hyperliquid risks the fallout of a crucial support level

Hyperliquid trades above the S1 Pivot Point at $26 on the daily chart, holding ground after the three-day decline. The news of potential burn has yet to be priced in, which could be seen on the result day.

However, if the exchange token secures a daily close below $26, it could extend the decline to the October 10 low near $20. 

The momentum indicators on the daily chart reflect a steady bearish pressure. The Relative Strength Index (RSI) at 33 remains below the halfway line since early November, hovering close to the oversold zone. 

Meanwhile, the Moving Average Convergence Divergence (MACD) and the signal line extend the declining trend after failing to cross on Sunday, indicating persistent bearish pressure.

HYPE/USDT daily logarithmic chart.

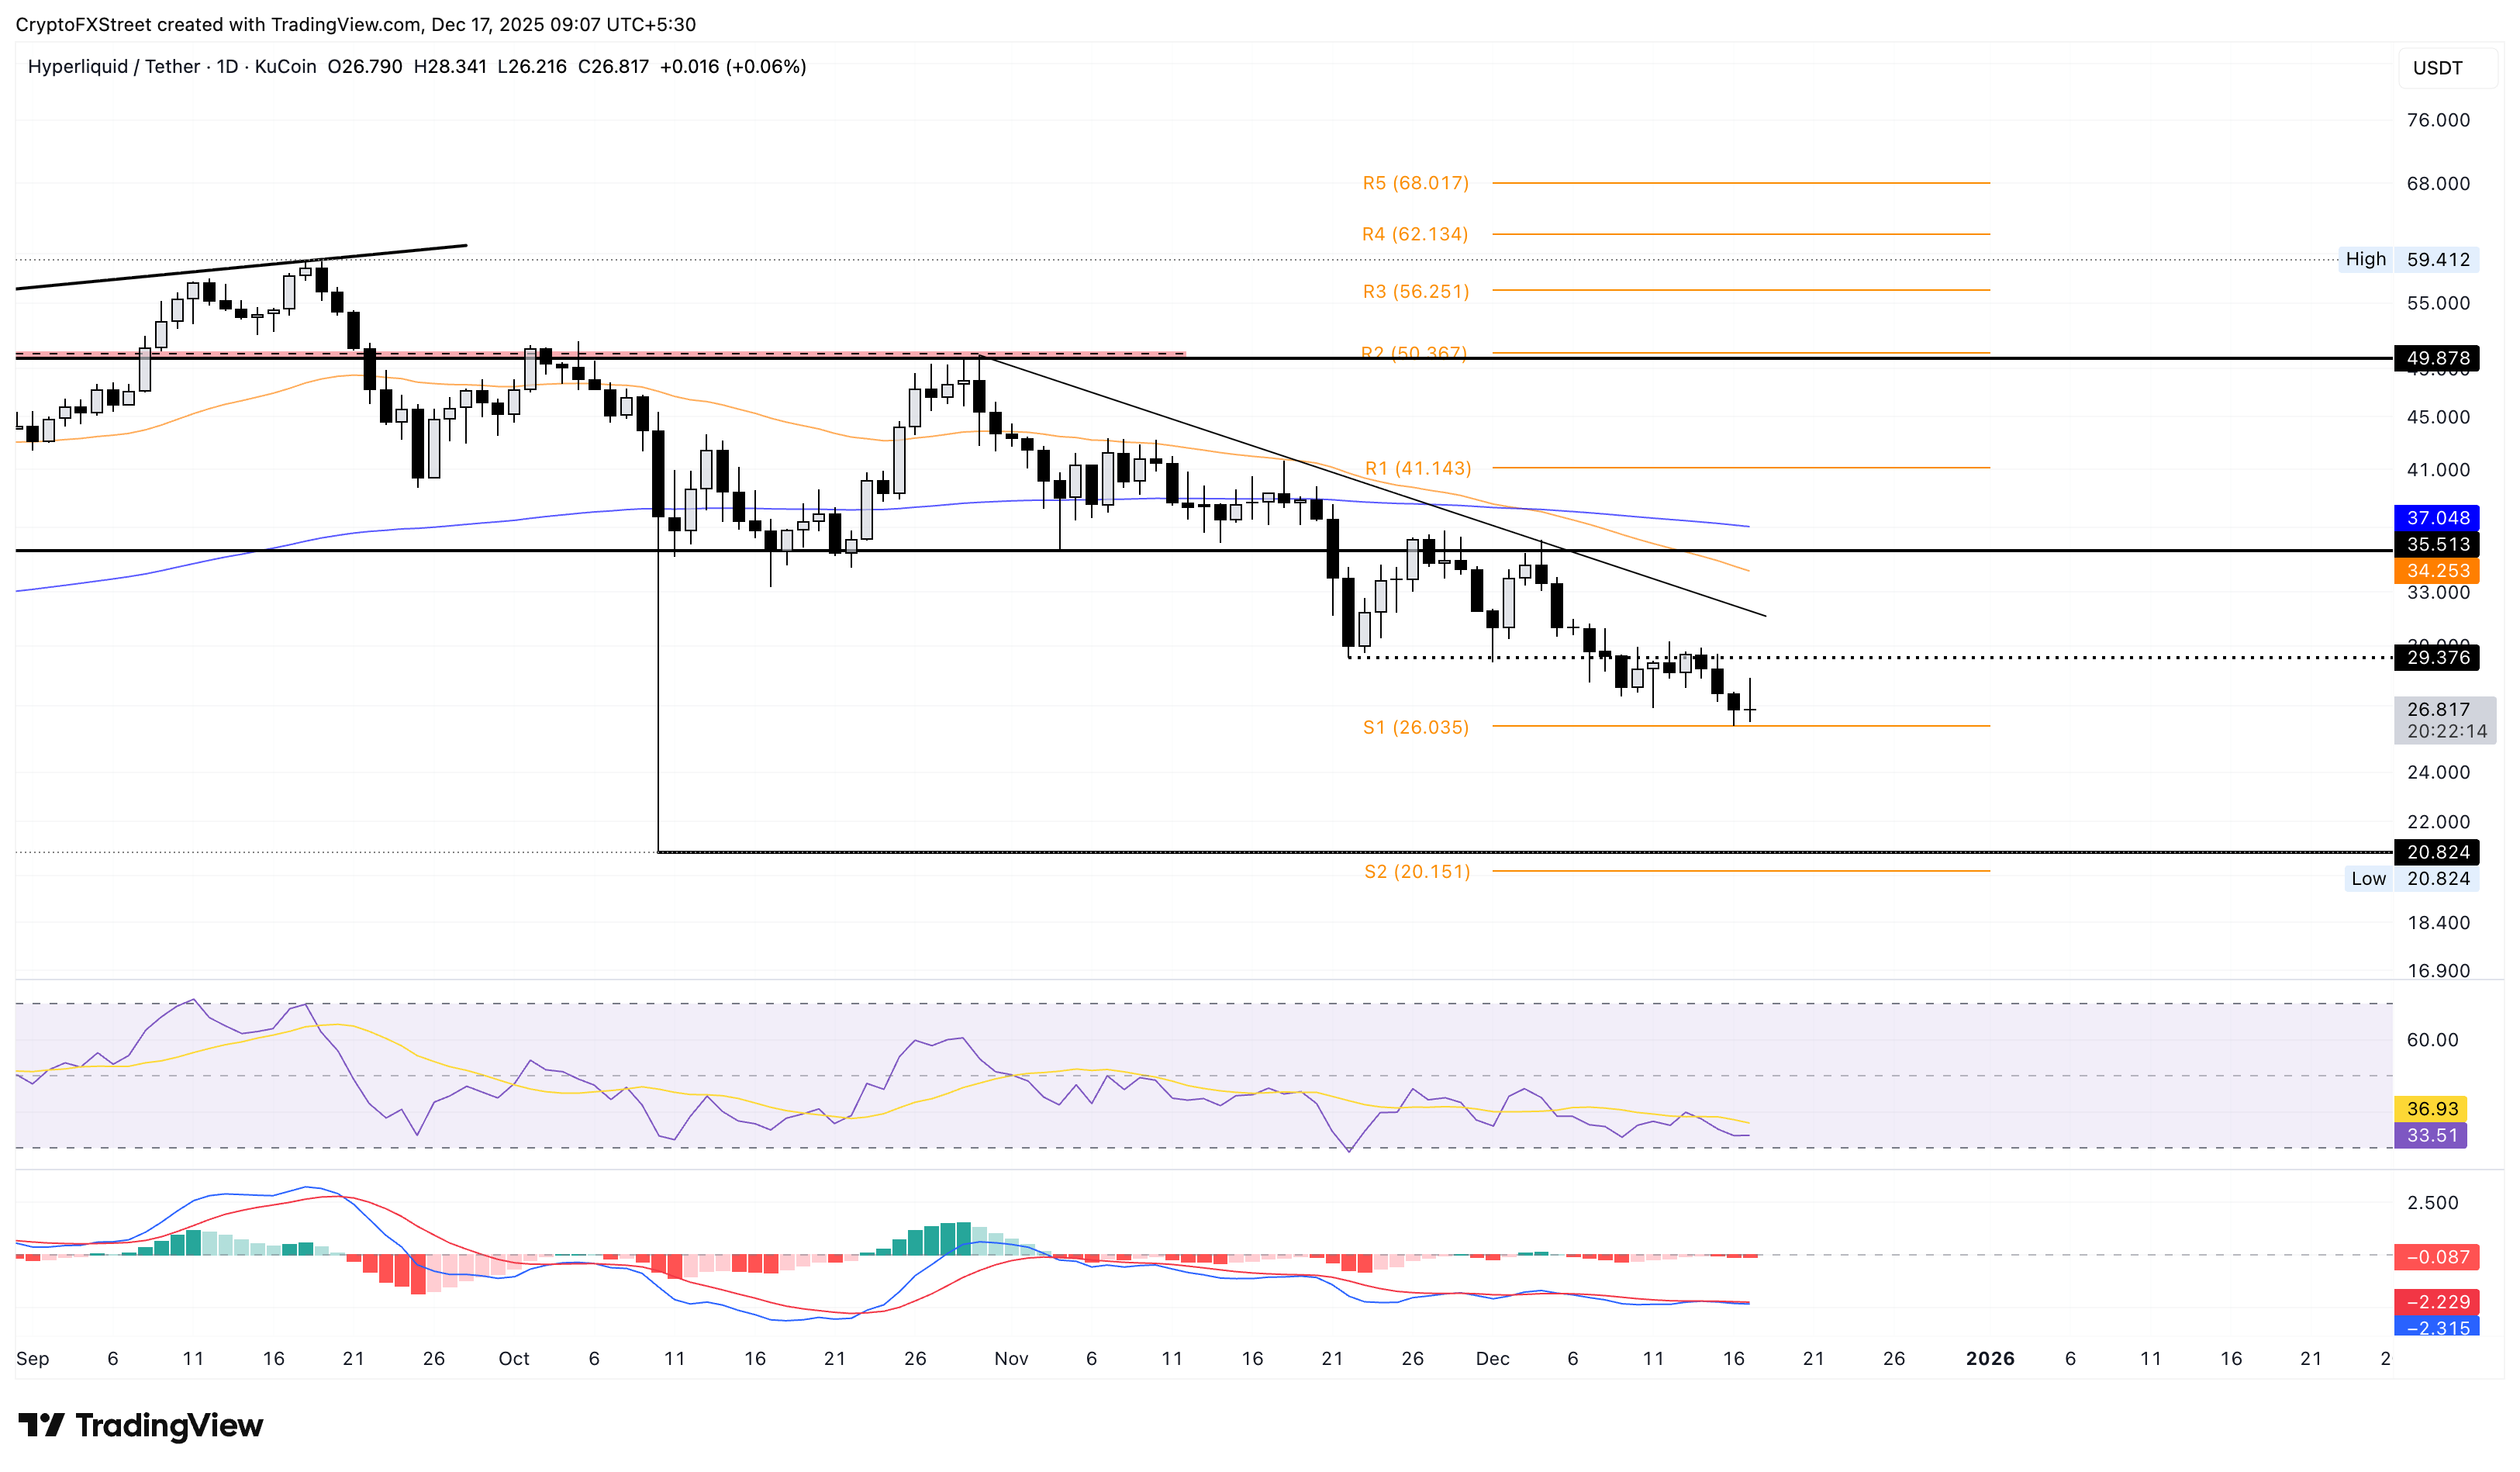
Looking up, if HYPE rebounds from $26, it could target the $30 mark, followed by the 50-day Exponential Moving Average (EMA) at $34. 

Disclaimer: For information purposes only. Past performance is not indicative of future results.
placeholder
Gold Price Forecast: XAU/USD drifts higher above $4,200 as Fed delivers expected cutGold price (XAU/USD) gains momentum to around $4,235 during the early Asian session on Thursday. The precious metal extends its upside after the US Federal Reserve (Fed) delivered an expected third consecutive interest rate cut and maintained its outlook for just one cut in 2026.
Author  FXStreet
Dec 11, Thu
Gold price (XAU/USD) gains momentum to around $4,235 during the early Asian session on Thursday. The precious metal extends its upside after the US Federal Reserve (Fed) delivered an expected third consecutive interest rate cut and maintained its outlook for just one cut in 2026.
placeholder
Ethereum Price Slips Lower — $3,000 Looms as the Key BattlegroundEthereum is attempting to recover from a $3,026 low but remains below $3,200 and the 100-hour SMA, with a bearish trend line near $3,175 capping rebounds as bulls need a clean break above $3,200 to target $3,250–$3,400, while a drop below $3,050 risks a retest of $3,000 and $2,940.
Author  Mitrade
Dec 15, Mon
Ethereum is attempting to recover from a $3,026 low but remains below $3,200 and the 100-hour SMA, with a bearish trend line near $3,175 capping rebounds as bulls need a clean break above $3,200 to target $3,250–$3,400, while a drop below $3,050 risks a retest of $3,000 and $2,940.
placeholder
Macro Analysts: Hawkish Japan Could Push Bitcoin Below $70KAnalysts predict Bitcoin may face further declines towards the $70,000 mark if the Bank of Japan raises interest rates as expected.
Author  Mitrade
Dec 15, Mon
Analysts predict Bitcoin may face further declines towards the $70,000 mark if the Bank of Japan raises interest rates as expected.
placeholder
Bitcoin Slides 5% as Sellers Lean In — Can BTC Reclaim $88,000?Bitcoin has dropped back below $88,000 after rolling over from $90,500, with price still trading under the 100-hour Simple Moving Average. The sell-off found a floor at $85,151, and BTC is now consolidating near that base, but rebounds are facing pressure from a bearish trend line around $89,000. Bulls need to retake $88,000–$89,000 to ease downside risk; failure to do so keeps $85,500–$85,000 and then $83,500 in play, with $80,000 as the deeper “line in the sand.” Bitcoin (BTC) is back in damage-control mode after a sharp pullback wiped out recent gains. The price failed to reclaim the $90,000–$90,500 band, rolled over, and slid through $88,500 before briefly dipping under $87,000. Buyers did show up around $85,000, but the rebound so far looks more like stabilization than a clear trend reversal. Bitcoin dips hard, finds a bid near $85,000(h3) BTC’s latest move lower began when it couldn’t build follow-through above $90,000 and $90,500. Once that upside stalled, sellers took control and pushed price down through $88,500. The slide accelerated enough to spike below $87,000, but the market didn’t free-fall. Bulls defended the $85,000 zone, printing a low at $85,151. Since then, Bitcoin has been consolidating below the 23.6% Fibonacci retracement of the drop from the $93,560 swing high to the $85,151 low — a clue that the bounce is still shallow and that sellers haven’t fully backed off yet. Structurally, BTC is still on the back foot: It’s trading below $88,000, and It remains below the 100-hour Simple Moving Average, keeping short-term trend pressure pointed downward. Resistance is layered, and $89,000 is the problem area(h3) If bulls try to turn this into a recovery, they’ll have to climb through multiple ceilings in quick succession. First, BTC faces resistance around $87,150, followed by a more meaningful barrier near $87,500. From there, the market’s attention snaps back to $88,000 — the level BTC just lost and now needs to reclaim. A close back above $88,000 would improve the tone, but it doesn’t solve the bigger issue: there’s a bearish trend line on the hourly BTC/USD chart (Kraken feed) with resistance near $89,000, which also lines up with the next technical hurdle. If BTC can push through $89,000 and hold, the rebound could extend toward $90,000, with follow-through targets at $91,000 and $91,500. But until price clears that $88,000–$89,000 zone, rallies are at risk of being sold rather than chased. If BTC fails to reclaim resistance, the downside path is clear(h3) The near-term bear case is simple: if Bitcoin can’t climb back above the $87,000 area and keep traction, sellers may attempt another leg lower. Support levels line up like this: Immediate support: $85,500 First major support: $85,000 Next support: $83,500 Then $82,500 in the near term Below that, the major “don’t break this” level is still $80,000. If BTC slips under $80,000, the risk of acceleration to the downside increases significantly — not because it’s magic, but because it’s the kind of psychological and structural level that tends to trigger forced de-risking. Indicators: momentum still leans bearish(h3) The intraday indicators aren’t offering much comfort yet: Hourly MACD is losing pace in the bearish zone. Hourly RSI remains below 50, suggesting sellers still have the upper hand on short timeframes. So while the $85,000 defense held for now, the market hasn’t flipped bullish — it’s just stopped bleeding.
Author  Mitrade
Yesterday 02: 56
Bitcoin has dropped back below $88,000 after rolling over from $90,500, with price still trading under the 100-hour Simple Moving Average. The sell-off found a floor at $85,151, and BTC is now consolidating near that base, but rebounds are facing pressure from a bearish trend line around $89,000. Bulls need to retake $88,000–$89,000 to ease downside risk; failure to do so keeps $85,500–$85,000 and then $83,500 in play, with $80,000 as the deeper “line in the sand.” Bitcoin (BTC) is back in damage-control mode after a sharp pullback wiped out recent gains. The price failed to reclaim the $90,000–$90,500 band, rolled over, and slid through $88,500 before briefly dipping under $87,000. Buyers did show up around $85,000, but the rebound so far looks more like stabilization than a clear trend reversal. Bitcoin dips hard, finds a bid near $85,000(h3) BTC’s latest move lower began when it couldn’t build follow-through above $90,000 and $90,500. Once that upside stalled, sellers took control and pushed price down through $88,500. The slide accelerated enough to spike below $87,000, but the market didn’t free-fall. Bulls defended the $85,000 zone, printing a low at $85,151. Since then, Bitcoin has been consolidating below the 23.6% Fibonacci retracement of the drop from the $93,560 swing high to the $85,151 low — a clue that the bounce is still shallow and that sellers haven’t fully backed off yet. Structurally, BTC is still on the back foot: It’s trading below $88,000, and It remains below the 100-hour Simple Moving Average, keeping short-term trend pressure pointed downward. Resistance is layered, and $89,000 is the problem area(h3) If bulls try to turn this into a recovery, they’ll have to climb through multiple ceilings in quick succession. First, BTC faces resistance around $87,150, followed by a more meaningful barrier near $87,500. From there, the market’s attention snaps back to $88,000 — the level BTC just lost and now needs to reclaim. A close back above $88,000 would improve the tone, but it doesn’t solve the bigger issue: there’s a bearish trend line on the hourly BTC/USD chart (Kraken feed) with resistance near $89,000, which also lines up with the next technical hurdle. If BTC can push through $89,000 and hold, the rebound could extend toward $90,000, with follow-through targets at $91,000 and $91,500. But until price clears that $88,000–$89,000 zone, rallies are at risk of being sold rather than chased. If BTC fails to reclaim resistance, the downside path is clear(h3) The near-term bear case is simple: if Bitcoin can’t climb back above the $87,000 area and keep traction, sellers may attempt another leg lower. Support levels line up like this: Immediate support: $85,500 First major support: $85,000 Next support: $83,500 Then $82,500 in the near term Below that, the major “don’t break this” level is still $80,000. If BTC slips under $80,000, the risk of acceleration to the downside increases significantly — not because it’s magic, but because it’s the kind of psychological and structural level that tends to trigger forced de-risking. Indicators: momentum still leans bearish(h3) The intraday indicators aren’t offering much comfort yet: Hourly MACD is losing pace in the bearish zone. Hourly RSI remains below 50, suggesting sellers still have the upper hand on short timeframes. So while the $85,000 defense held for now, the market hasn’t flipped bullish — it’s just stopped bleeding.
placeholder
Senate Delays Crypto Market Structure Hearings to Early 2026The Senate Banking Committee has postponed cryptocurrency market structure hearings until 2026, citing ongoing bipartisan negotiations.
Author  Mitrade
Yesterday 05: 56
The Senate Banking Committee has postponed cryptocurrency market structure hearings until 2026, citing ongoing bipartisan negotiations.
goTop
quote