


Top 3 Price Prediction Bitcoin, Gold, Silver as Stocks Move Out of the Fear Zone
Bitcoin, gold, and silver prices continue to trade with bullish biases this week, as the pioneer crypto and the two commodity safe havens see the Fed’s interest rate decision through a rearview mirror.
After policymakers decided to cut interest rates by a quarter of a percentage point, data show that the stock market is no longer flashing fear, a major break last seen in early October.
Bitcoin, Gold, Silver: Updated Price Outlook as Stock Market Calm Returns
The US stock market hit an all-time high on Thursday, December 11, with analysts projecting further upside. It follows the Fed’s decision to cut interest rates, a move that usually lifts the stock market.
Lower borrowing costs boost corporate profits, encourage business investment, and increase the value of future earnings. Similarly, cheaper credit increases consumer spending, while investors shift from bonds to equities in search of higher returns.
Together, this improves liquidity and risk appetite, typically driving stock prices higher across most sectors. This explains why the stock market is no longer flashing fear.
Meanwhile, Bitcoin, gold, and silver are evoking similar optimism, with XAU and XAG prices surging as holding costs decline and inflation expectations rise.
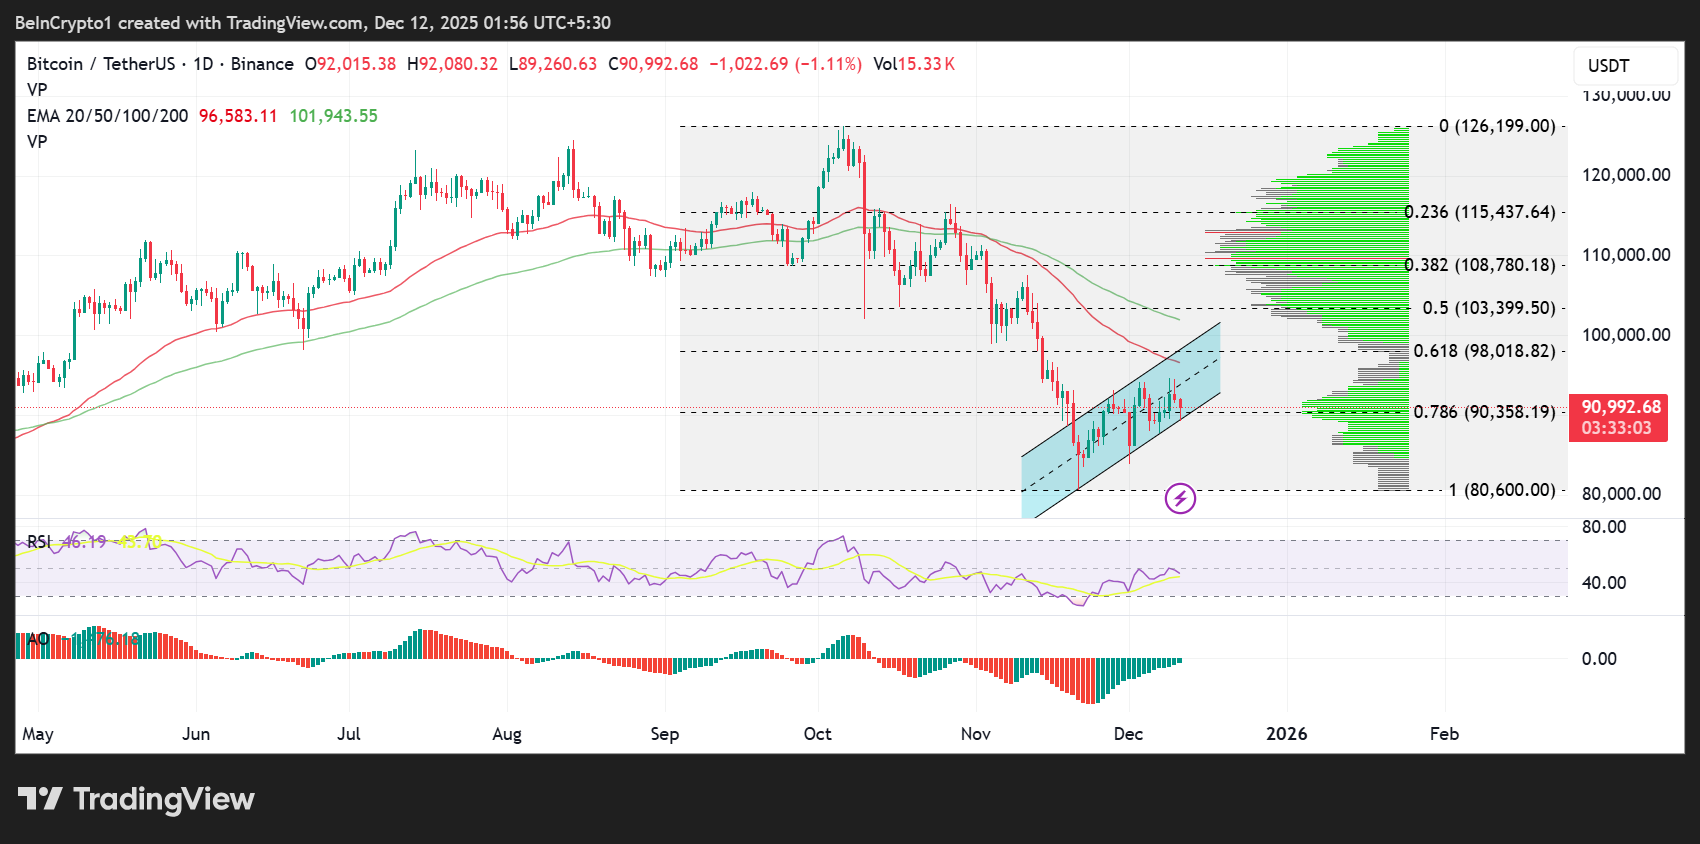
Bullish Reversal Builds for Bitcoin Price as Liquidity Flows Return
Bitcoin’s daily chart shows the price recovering within a well-defined ascending channel, which formed after the sharp correction from its early October highs.
Despite still trading below the major exponential moving averages (50 and 100 at $96,583 and $101,943, respectively), BTC is showing early signs of trend stabilization. This is seen with each recent low forming higher than the previous one, a classic early-stage recovery pattern.
The bullish Volume Profiles (green horizontal bars) reveal a significant high-volume node around the 78.6% Fibonacci retracement level, suggesting bulls could defend $90,358 as critical support.
This level may act as an anchoring point for price inflection, potentially serving as the jumping-off point for the next move north.
A decisive candlestick close above the $90,358 level could allow BTC to target the heavier liquidity cluster around $98,000–$103,000.
Meanwhile, the RSI (Relative Strength Index) indicator remains neutral, suggesting room for expansion in either direction.
The histograms of the AO indicators (Awesome Oscillator) are edging toward positive territory and flashing green, suggesting bullish momentum is growing.
 Bitcoin (BTC) Price Performance. Source: TradingView
Nonetheless, short-term bullish continuation depends on maintaining the upward channel structure. Breaking below the lower boundary of the channel, which confluences with the 78.6% Fibonacci retracement level at $90,358, would expose BTC to bearish pressure, with the ensuing seller momentum likely to send BTC to the range between $86,000 and $80,600.
The main challenge remains reclaiming the EMAs, particularly the 50-day and 100-day, which cluster around $96,583 and $101,943.
Historically, BTC tends to accelerate once it breaks above these moving averages during mid-cycle consolidations.
Overall, BTC exhibits a controlled recovery, rising volume, and a constructive channel, but major confirmation will only come if bulls reclaim the $100,000 psychological level.
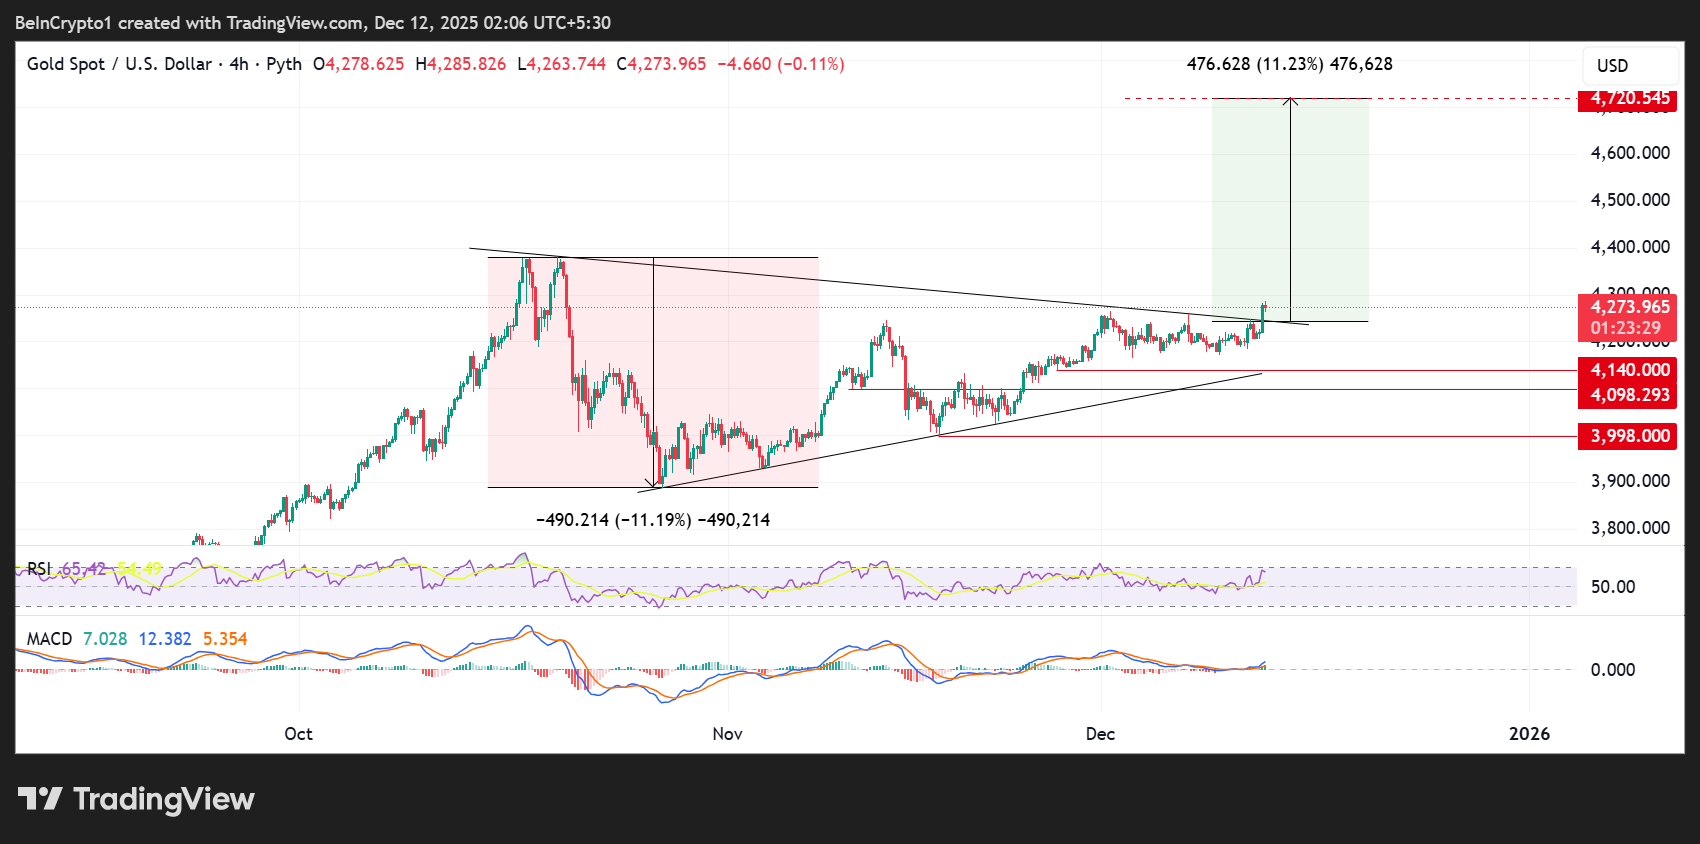
Gold Price’s Breakout Momentum Strengthens Above Key Resistance
The 4-hour chart for the XAU/USD trading pair shows the gold price teasing with a clean breakout from a long, compressing symmetrical triangle. This technical formation formed after the sharp $490 retracement (-11.19%) earlier in the quarter.
Symmetrical triangles at the top of an uptrend often behave as continuation patterns, where price consolidates before resuming its prior direction. Gold’s breakout aligns with this playbook, pushing above the downtrend line with strong momentum.
The measured move of the triangle projects an upside target of roughly $4,720, up by just over 11% above the breakout point.
Meanwhile, the gold price is currently stabilizing around $4,273, where the breakout candle closed. As long as Gold holds above the triangle’s upper boundary, the bullish structure remains intact.
Traders waiting to take long positions on XAU/USD should consider waiting for a successful retest of the upper trendline.
The RSI is mid-range but leaning bullish at 65, suggesting gold is still not overbought. Its trajectory shows rising momentum, typically a healthy setup for continuation.
The MACD (Moving Average Convergence Divergence) lines have crossed bullishly and are widening, a sign of increasing upward force.
Support levels to monitor sit at $4,180, $4,140, $4,098, and the deeper pivot at $3,998, which marks the base of the prior correction. As long as the gold price stays above these levels, bulls maintain control.
 Gold (XAU) Price Performance. Source: TradingView
It is also worth noting that Gold’s breakout aligns with its broader macro trend: rising geopolitical uncertainty, persistent inflation expectations, and strong demand from central banks.
Technically, the structure supports the possibility of revisiting, and potentially surpassing, recent highs.
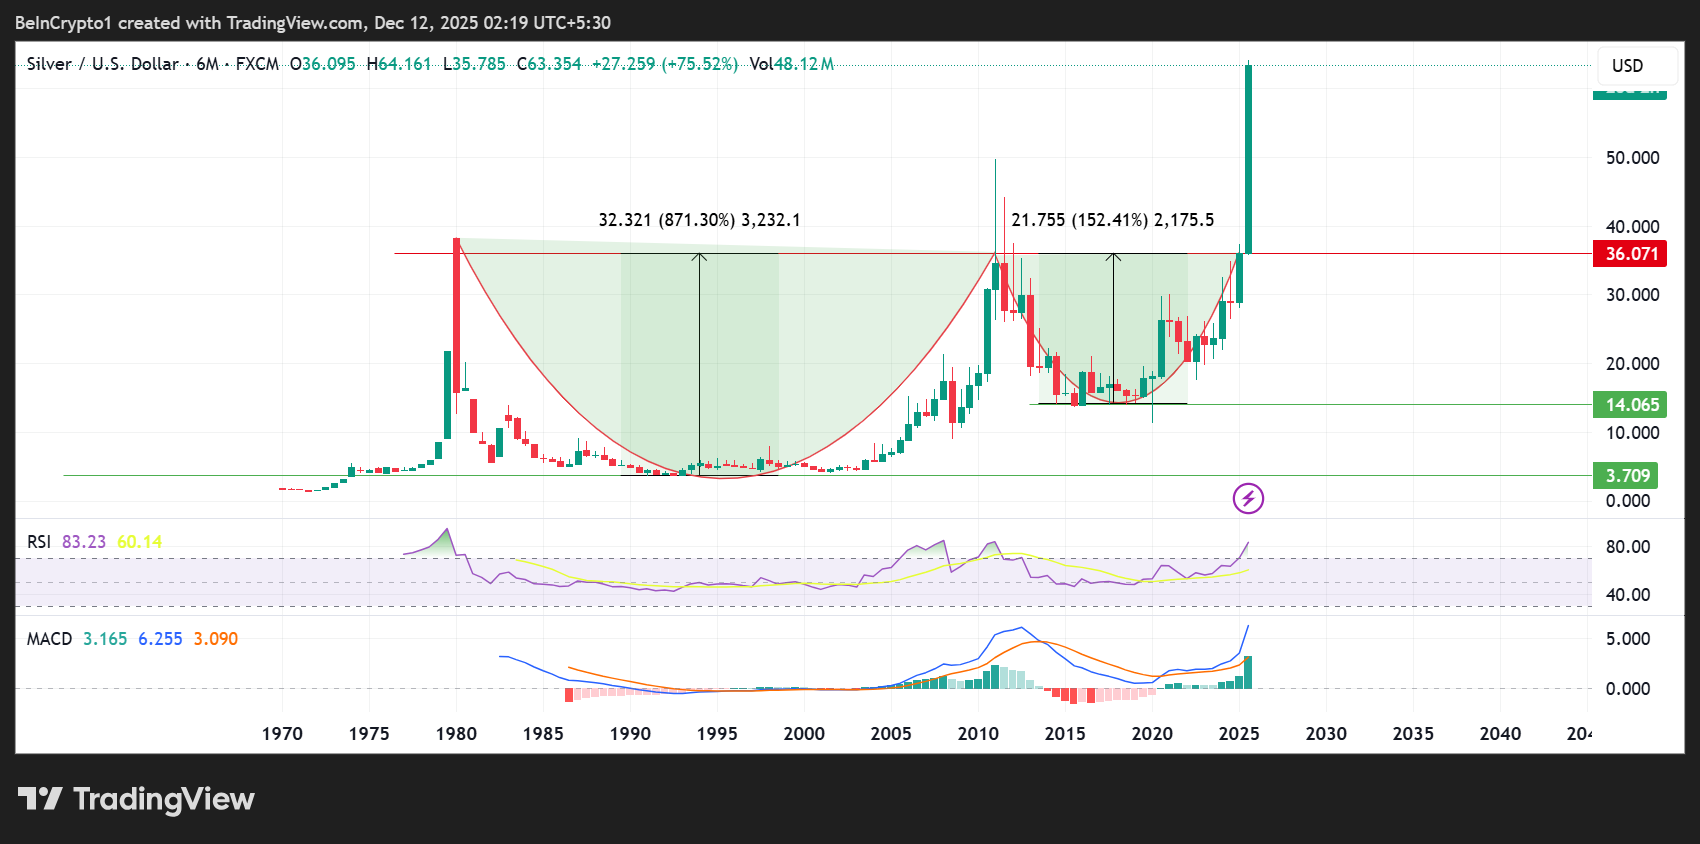
Silver Price’s Long-Term Cup-and-Handle Signal Targets Major Upside
The Silver price’s multi-decade chart is displaying one of the strongest long-term bullish structures in commodities, a giant multi-cycle Cup & Handle breakout.
The cup spans from the 1980 peak to the 2011 rejection, an 871% measured move. The handle, smaller but still powerful, forms a pattern between 2011 and 2024, showing a 152% measured move. Both formations converge at the same breakout line near $36, a level Silver has struggled to clear for over 40 years.
The latest candle shows a decisive, high-volume breakout far above this resistance, suggesting a structural shift rather than a temporary spike.
When a commodity breaks a multi-decade ceiling, price discovery can accelerate quickly due to lack of historical resistance.
 Silver (XAG) Price Performance. Source: TradingView
However, the RSI is in overbought territory (above 80), but in long-term breakouts, this often reflects momentum rather than exhaustion. The MACD has crossed strongly into bullish territory, confirming the upward trend.
If the breakout sustains, the next key psychological level is $70, with the 1980/2011 all-time high zone, now near $50, flipped into support.
Given the prolonged consolidation and tight multi-year supply constraints in the silver market, a move beyond historical highs cannot be ruled out.
However, Silver has historically remained volatile, so a retest of the $36 zone would be normal before a sustained continuation.
Recommended Articles


