

Top 3 Price Prediction: Bitcoin, Ethereum, Ripple – Crypto bulls return as BTC eyes breakout, ETH surges, XRP strengthens
- Bitcoin price nears key resistance at $94,253, a break above suggests further rally ahead.
- Ethereum breaks above the descending trendline, signaling renewed bullish momentum and potential for further upside.
- XRP hovers around $2.08 after its recent rally, finding support at the $1.96 daily level.
Bitcoin (BTC), Ethereum (ETH) and Ripple (XRP) are showing renewed strength at the time of writing on Wednesday as bullish momentum returns to the broader crypto market. BTC is edging toward a key resistance level that could trigger a breakout, ETH has surged above its descending trendline, while XRP is holding steady above key support — all signaling potential for further upside in the upcoming days.
Bitcoin could extend its rally toward the $100,000 mark
Bitcoin price recovered slightly over the weekend and rose 2.34% so far this week, retesting the 61.80% Fibonacci retracement level at $94,253 (from the April low of $74,508 to the all-time high of $126,199 set in October) on Tuesday. At the time of writing on Wednesday, BTC hovers around $92,000.
If BTC closes above the $94,253 resistance level, it could extend its rally toward the next key resistance at $100,000.
The Relative Strength Index (RSI) on the daily chart is 49, near the neutral 50 level, suggesting fading bearish momentum. For the bullish momentum to be sustained, the RSI must move above the neutral level. However, the Moving Average Convergence Divergence (MACD) showed a bullish crossover last week, which remains intact, supporting the bullish thesis.
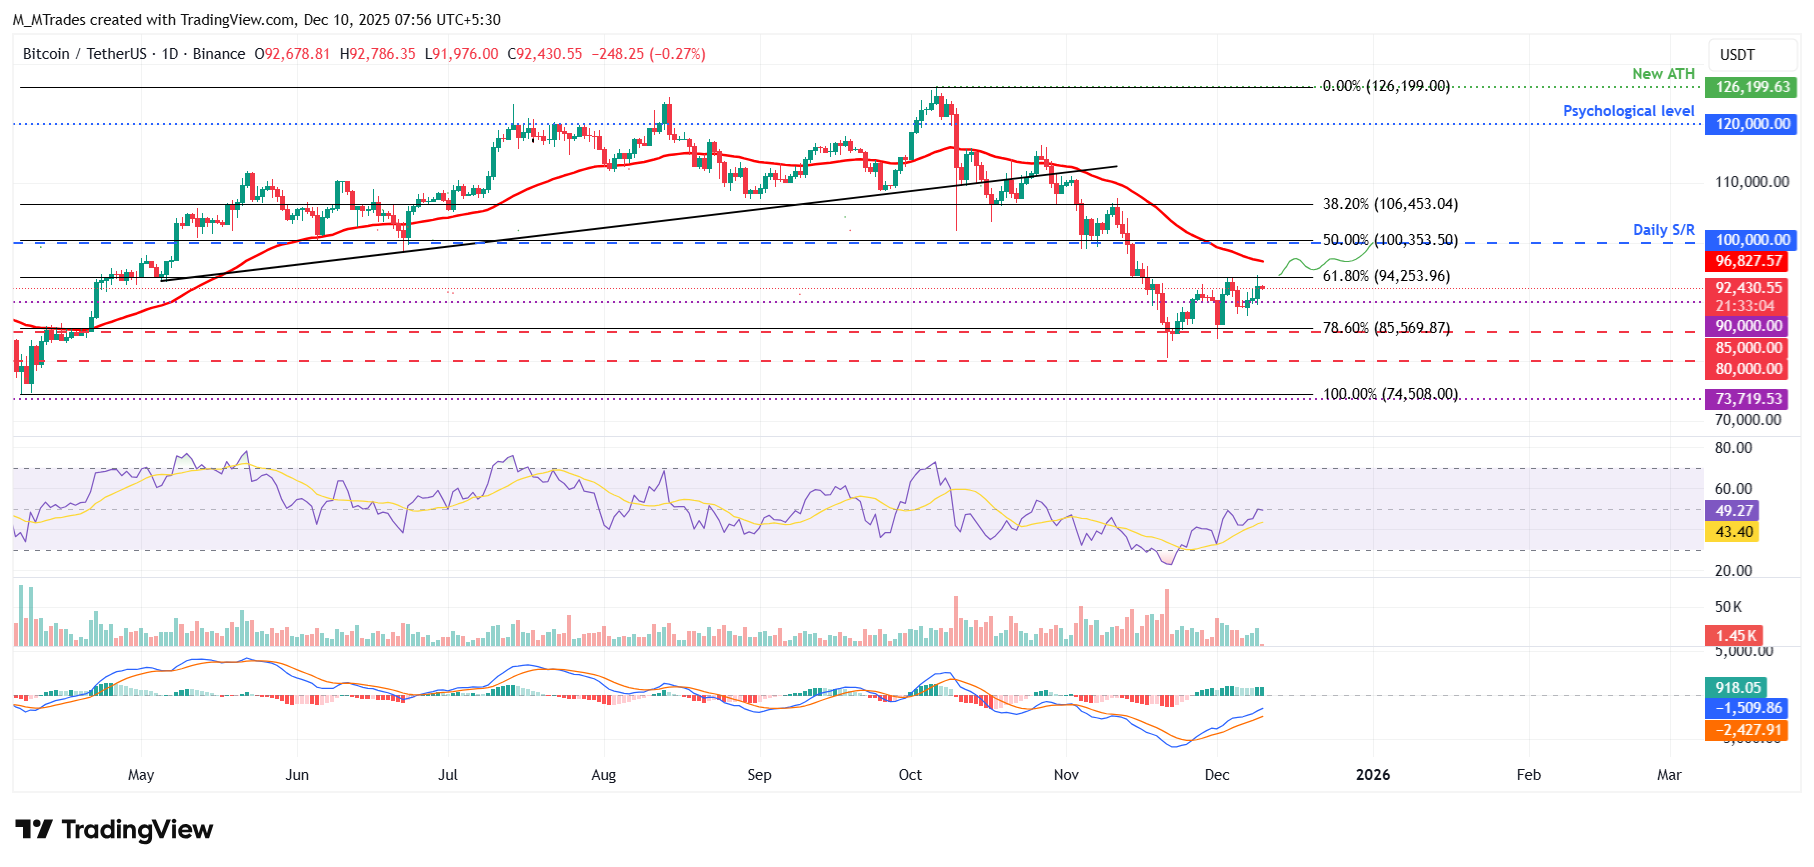
However, if BTC faces a correction, it could extend the decline toward the next key support at $85,569, its 78.60% Fibonacci retracement level.
Ethereum rallies as it closes above the descending trendline
Ethereum price broke above the descending trendline (drawn by joining multiple highs since October 7) on Tuesday and rose 6.21%. At the time of writing on Wednesday, it hovers around the 50-day Exponential Moving Average (EMA) at $3,315.
If ETH closes above the 50-day EMA at $3,315, it could extend the rally toward the next key resistance at $3,592.
The RSI on the daily chart is at 57, above its neutral level of 50, indicating bullish momentum is gaining traction. The Moving Average Convergence Divergence (MACD) showed a bullish crossover last week, which remains intact, supporting the bullish thesis.
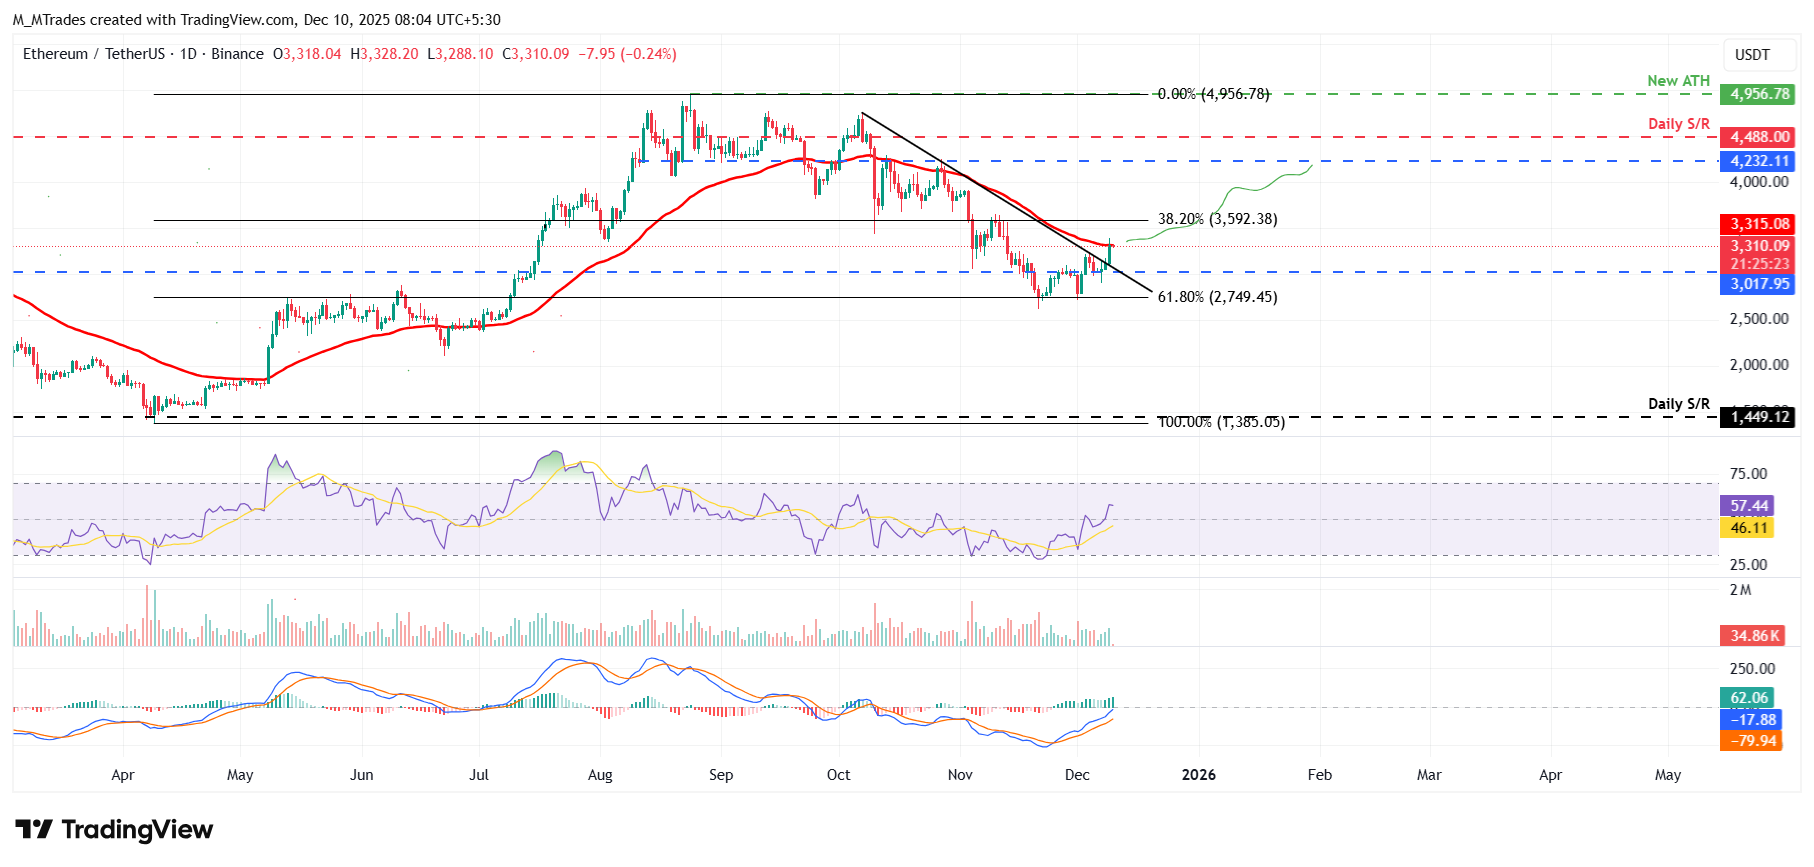
On the other hand, if ETH faces a correction, it could extend the decline toward the daily support at $3,017.
XRP finds support around key level
XRP price found support at $1.96 on Sunday and rose 3.66% over the next two days. At the time of writing on Wednesday, XRP hovers at around $2.08.
If XRP continues its upward trend, it could extend the rally toward the next daily resistance at $2.35.
The RSI on the daily chart reads 45, near the neutral 50 level, suggesting fading bearish momentum. For the bullish momentum to be sustained, the RSI must move above the neutral level. However, the Moving Average Convergence Divergence (MACD) showed a bullish crossover last week, which remains intact, supporting the bullish thesis.
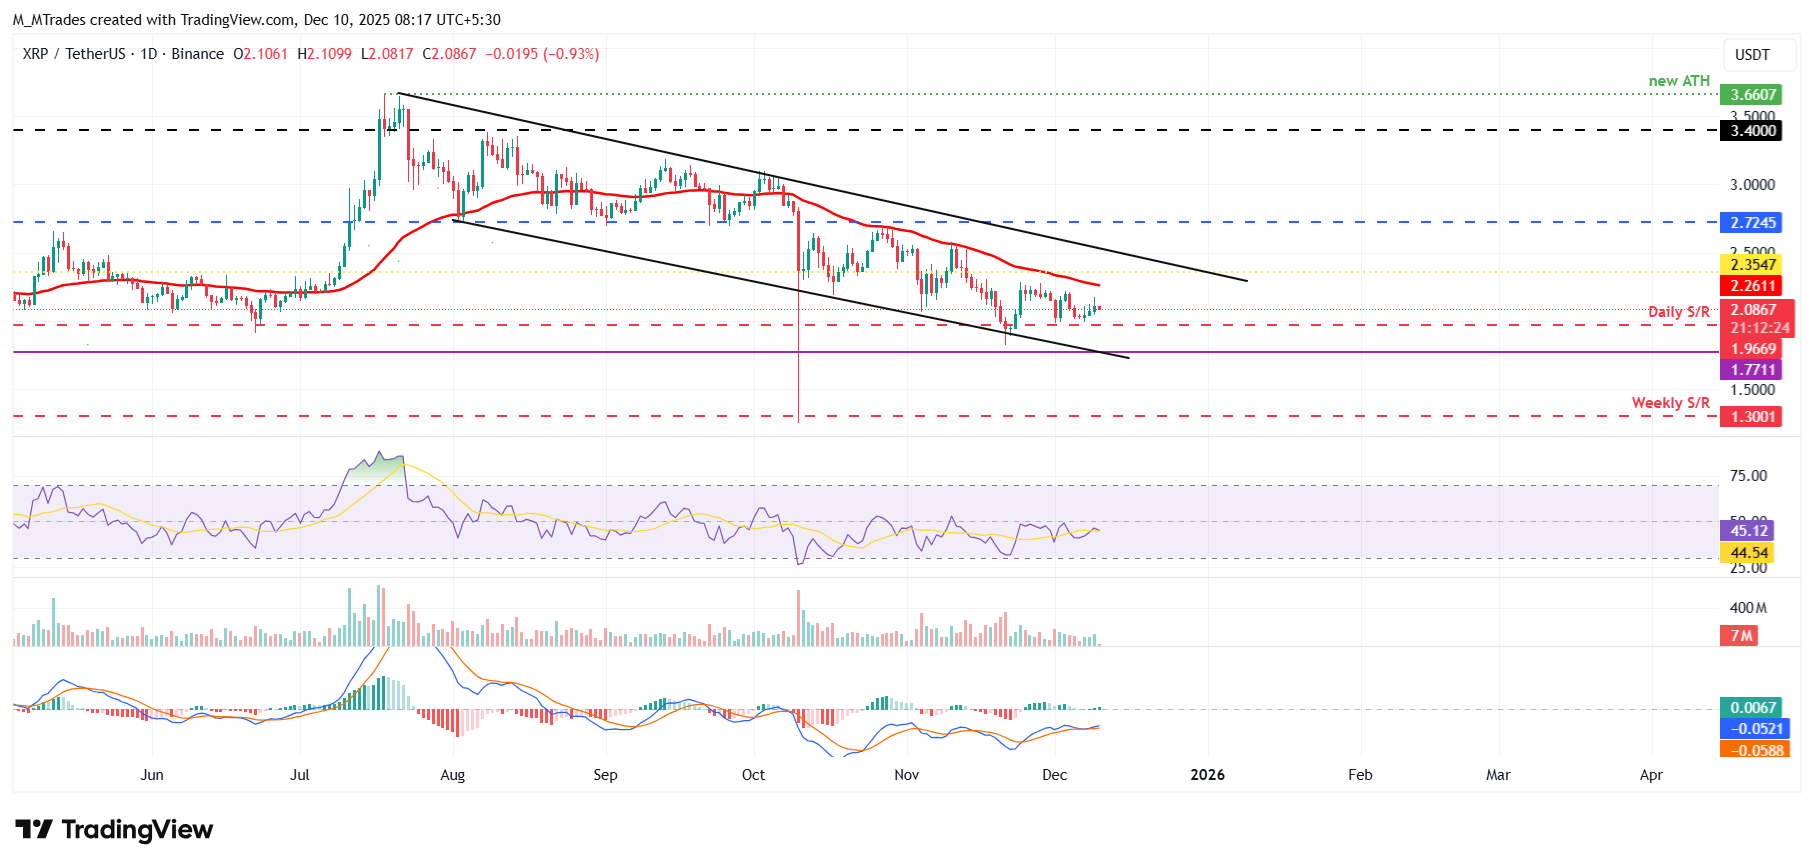
On the other hand, if XRP faces a correction, it could extend the decline toward the daily support at $1.96.
Bitcoin, altcoins, stablecoins FAQs
Bitcoin is the largest cryptocurrency by market capitalization, a virtual currency designed to serve as money. This form of payment cannot be controlled by any one person, group, or entity, which eliminates the need for third-party participation during financial transactions.
Altcoins are any cryptocurrency apart from Bitcoin, but some also regard Ethereum as a non-altcoin because it is from these two cryptocurrencies that forking happens. If this is true, then Litecoin is the first altcoin, forked from the Bitcoin protocol and, therefore, an “improved” version of it.
Stablecoins are cryptocurrencies designed to have a stable price, with their value backed by a reserve of the asset it represents. To achieve this, the value of any one stablecoin is pegged to a commodity or financial instrument, such as the US Dollar (USD), with its supply regulated by an algorithm or demand. The main goal of stablecoins is to provide an on/off-ramp for investors willing to trade and invest in cryptocurrencies. Stablecoins also allow investors to store value since cryptocurrencies, in general, are subject to volatility.
Bitcoin dominance is the ratio of Bitcoin's market capitalization to the total market capitalization of all cryptocurrencies combined. It provides a clear picture of Bitcoin’s interest among investors. A high BTC dominance typically happens before and during a bull run, in which investors resort to investing in relatively stable and high market capitalization cryptocurrency like Bitcoin. A drop in BTC dominance usually means that investors are moving their capital and/or profits to altcoins in a quest for higher returns, which usually triggers an explosion of altcoin rallies.
Recommended Articles


