

Bitcoin Attempts a Pattern Break, but One Group Could Still Block the 15% Rally
Bitcoin is up 1.9% over the past week and continues to climb steadily since December 1. It trades near $93,300 after a flat 24 hours, but the chart is hinting at a breakout, followed by a possible 15+% move.
Buyers have stepped back in, but not the ones that the Bitcoin price would want to sustain the rally.
Buyers Step In as Bitcoin Presses Toward a Break
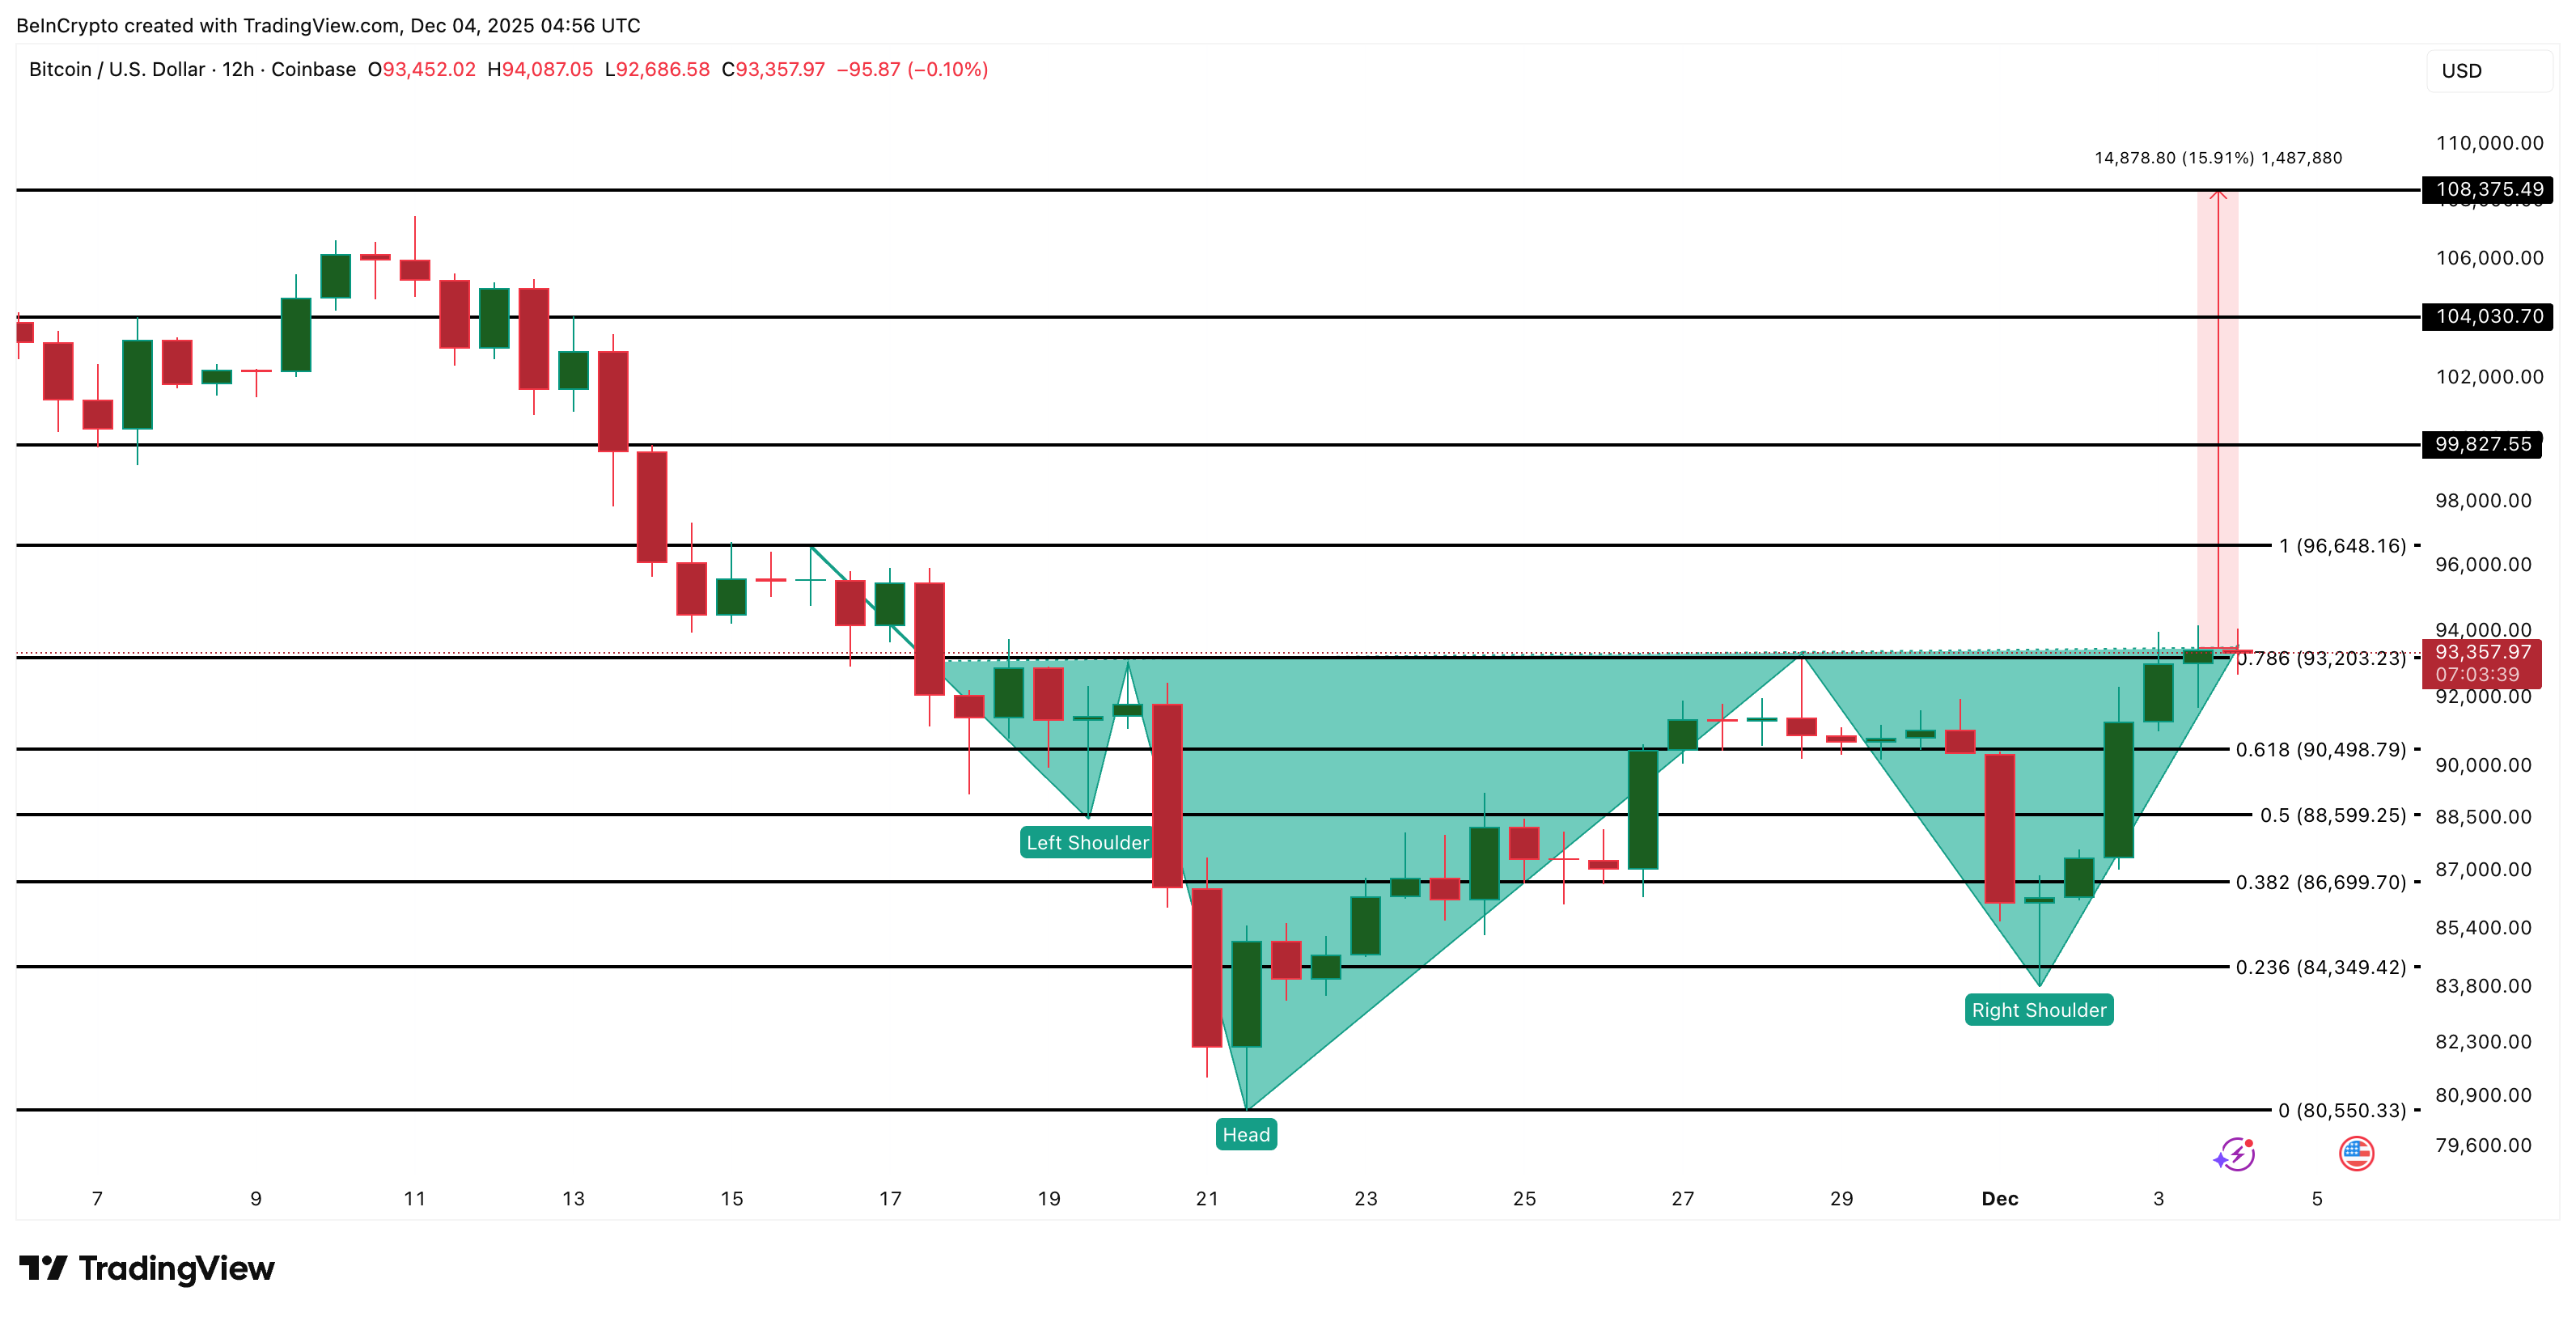
Bitcoin has traded down since mid-November, building pressure to the downside. Yet, the price has been rising since December 1 and is now pushing into a potential breakout structure. The same is confirmed by a developing inverse head-and-shoulders pattern on the 12-hour chart. That pattern usually appears near market bottoms and supports the idea of a recovery.
However, a clean 12-hour close above the neckline would be necessary for the breakout hopes to rise.
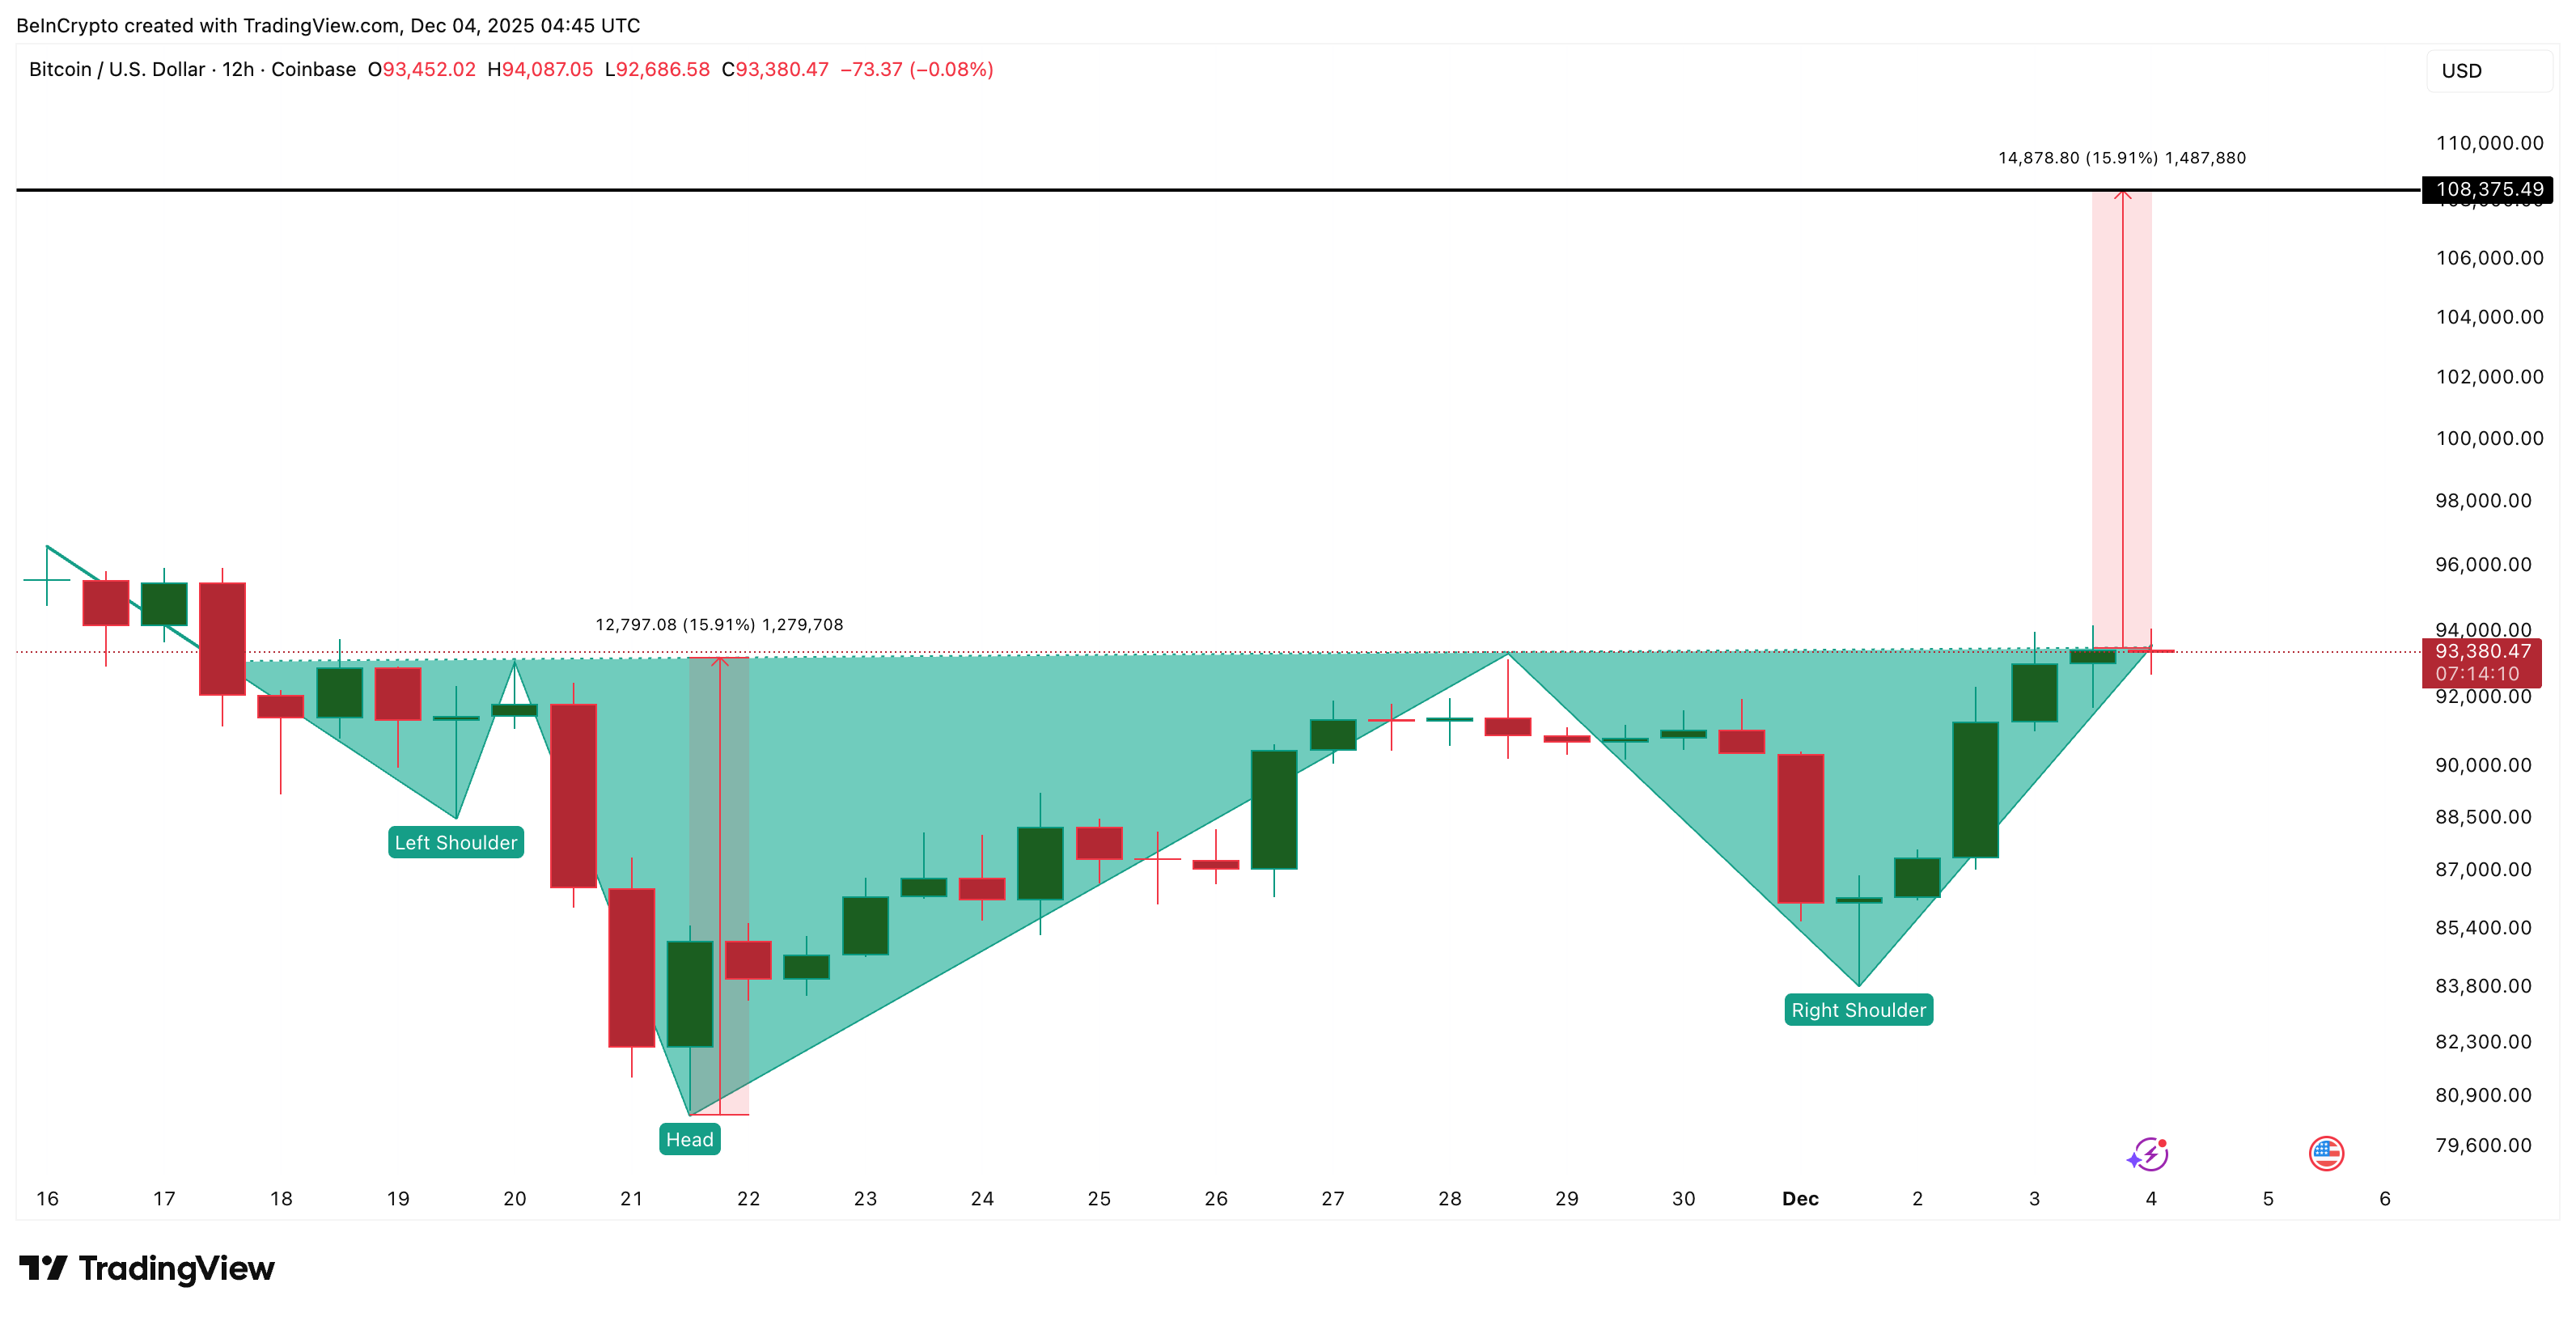 BTC Attempting Pattern Break: TradingView
Want more token insights like this? Sign up for Editor Harsh Notariya’s Daily Crypto Newsletter here
The strongest confirmation comes from spot flows. Exchange net position change tracks whether coins move into exchanges to sell or out of exchanges to hold. On November 27, exchanges saw net inflows of 3,947 BTC, showing selling pressure. By December 3, the metric flipped to –18,721 BTC, meaning heavy outflows.
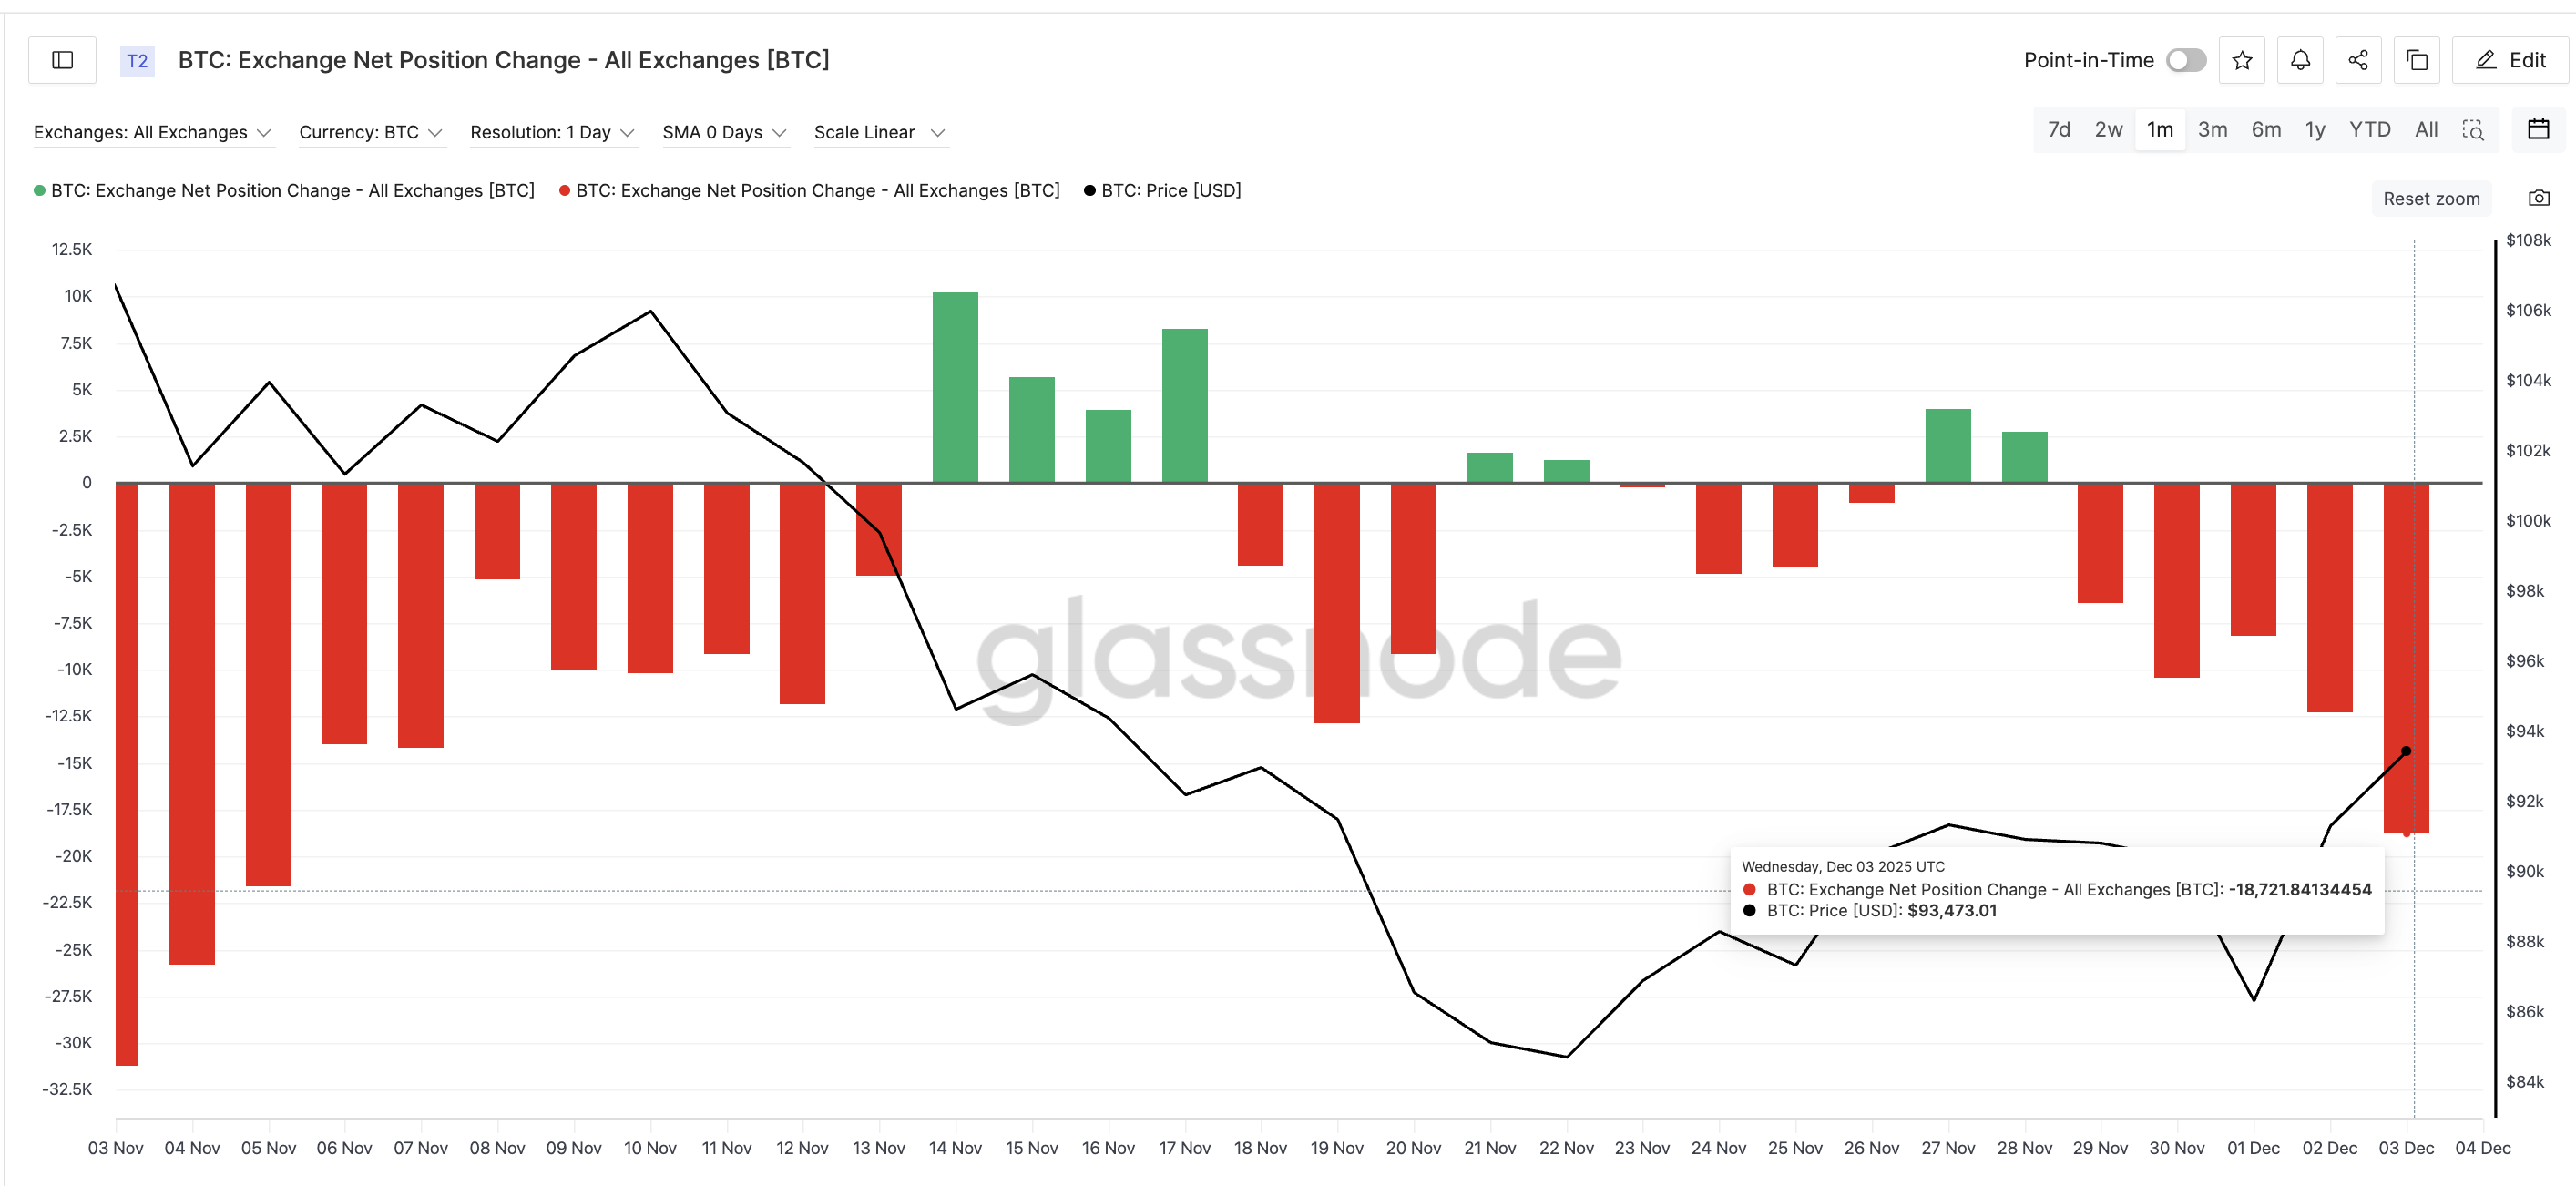 Buying Has Resumed: TradingView
A shift of more than 22,000 BTC in favor of buyers shows that demand returned sharply during this climb.
This improvement sets the opening chapter, but the next part of the story explains why the rally still feels unstable.
The Buyer Mix Shows a Hidden Weakness
Short-term holder supply has risen from 2,622,228 BTC on November 30 to 2,663,533 BTC as of December 3. Short-term holders are wallets that keep coins for only a few weeks. They buy quickly, but they also sell quickly.
Their rising supply, an increase of almost 1.6%, often looks bullish on the surface, but it means the rally hopes are being carried by the most reactive group in the market. If the Bitcoin price stalls, they are usually the first to take profits.
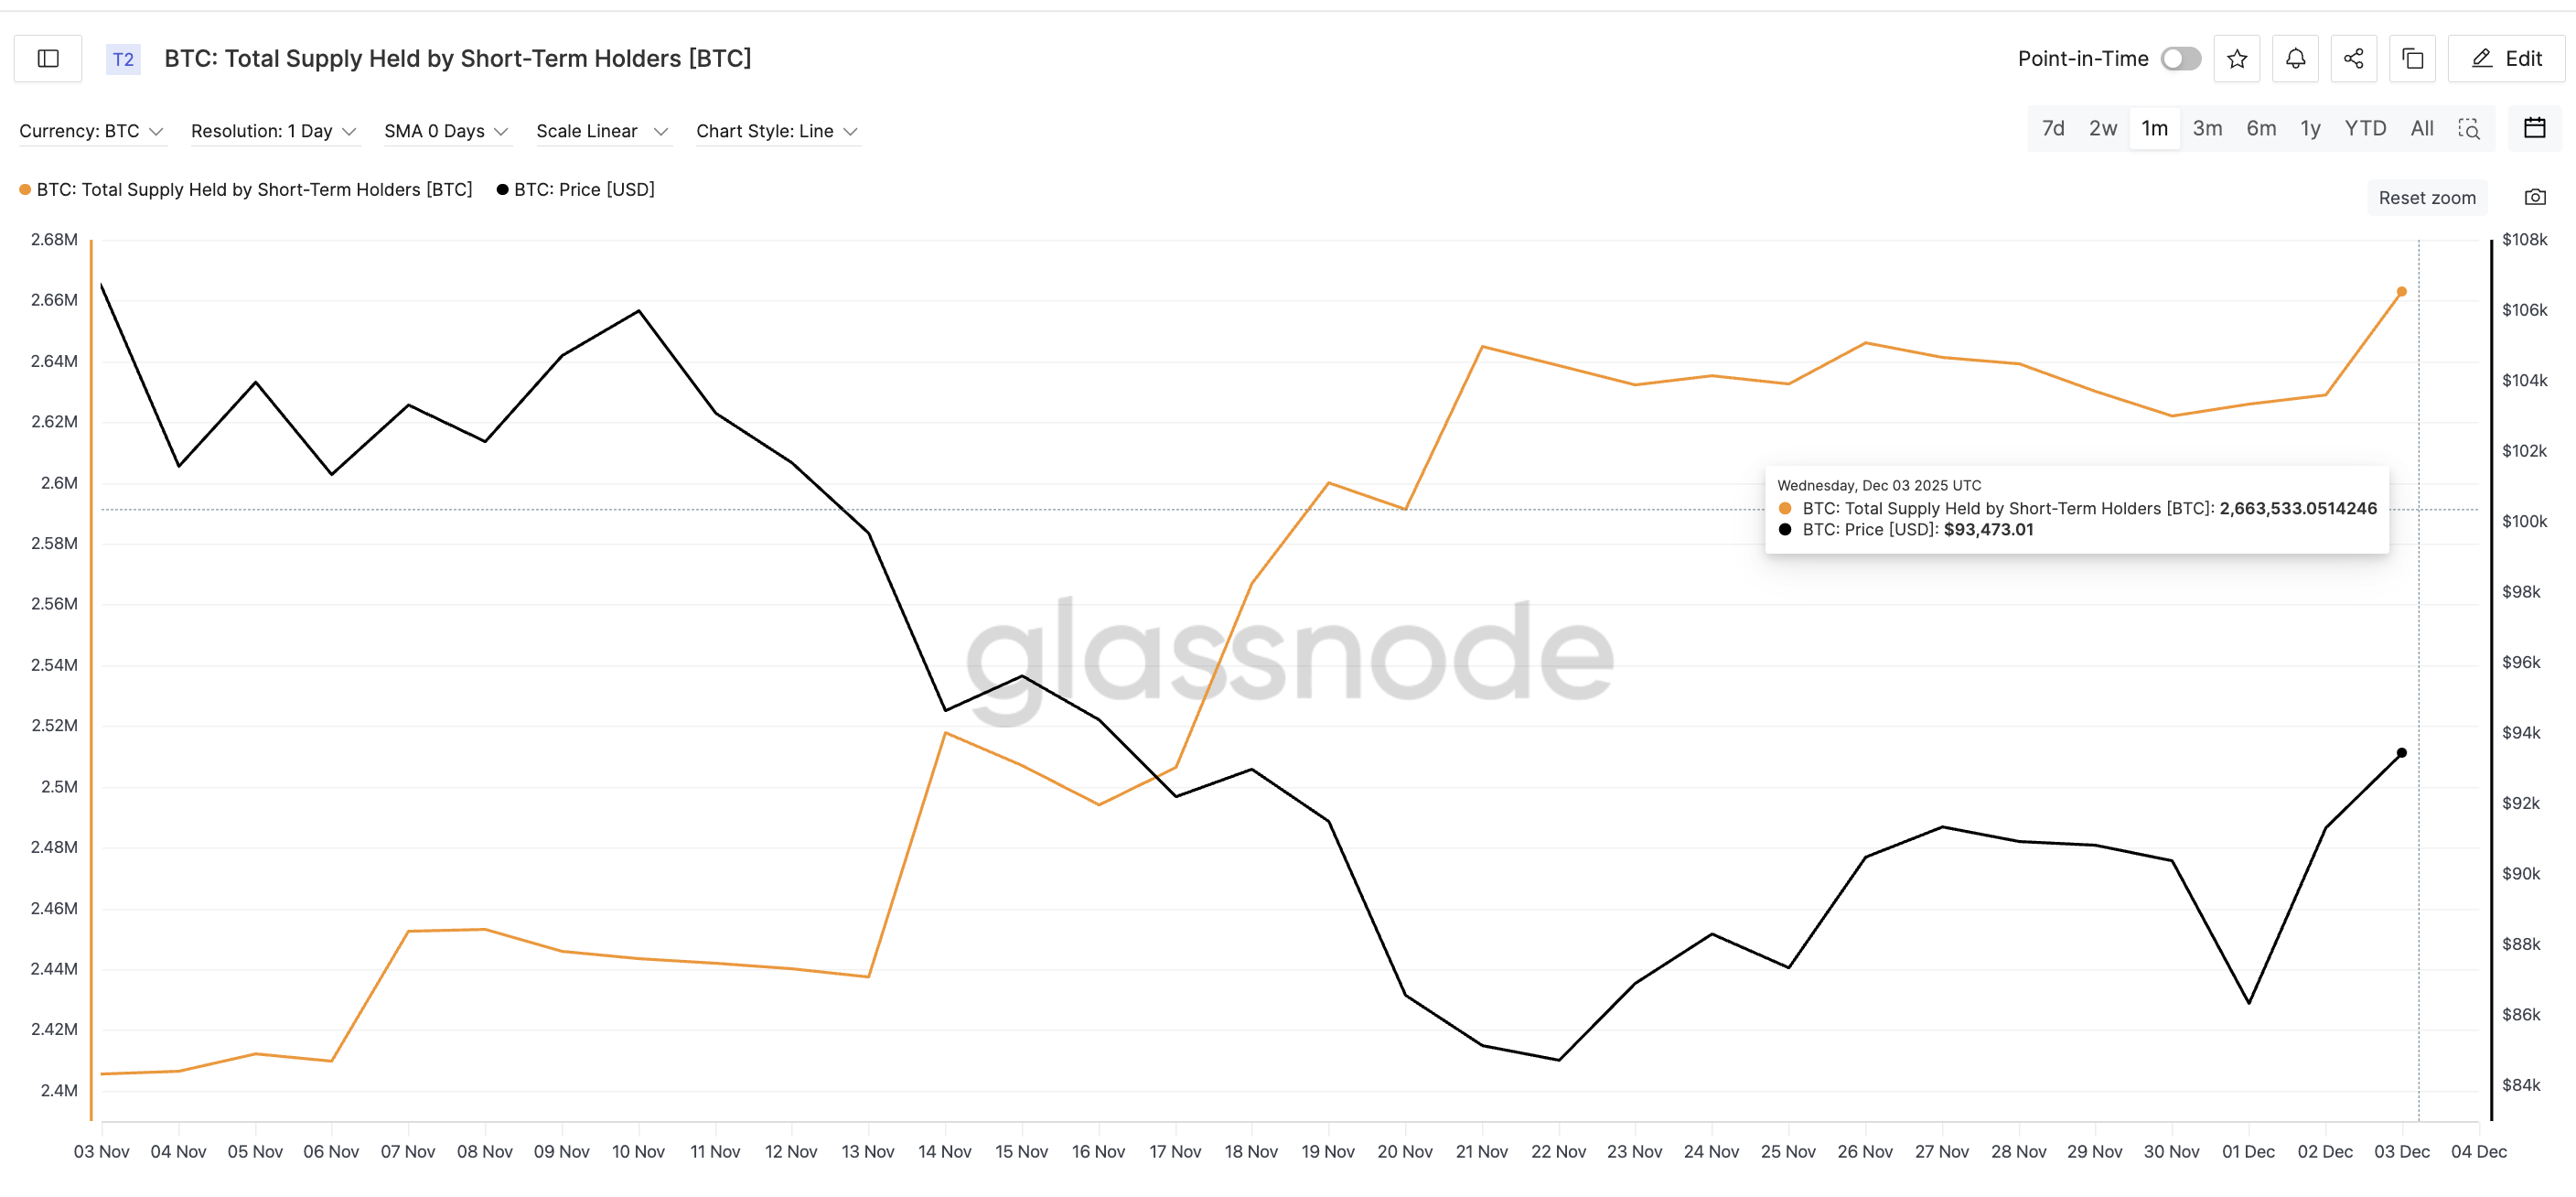 Speculative Traders Enter: TradingView
Long-term holders, the group that anchors strong breakouts, have not joined in. Their net position change, shown via the HODLer net position change metric, has been negative for the fourteenth straight day. The latest reading sits at –168,611 BTC.
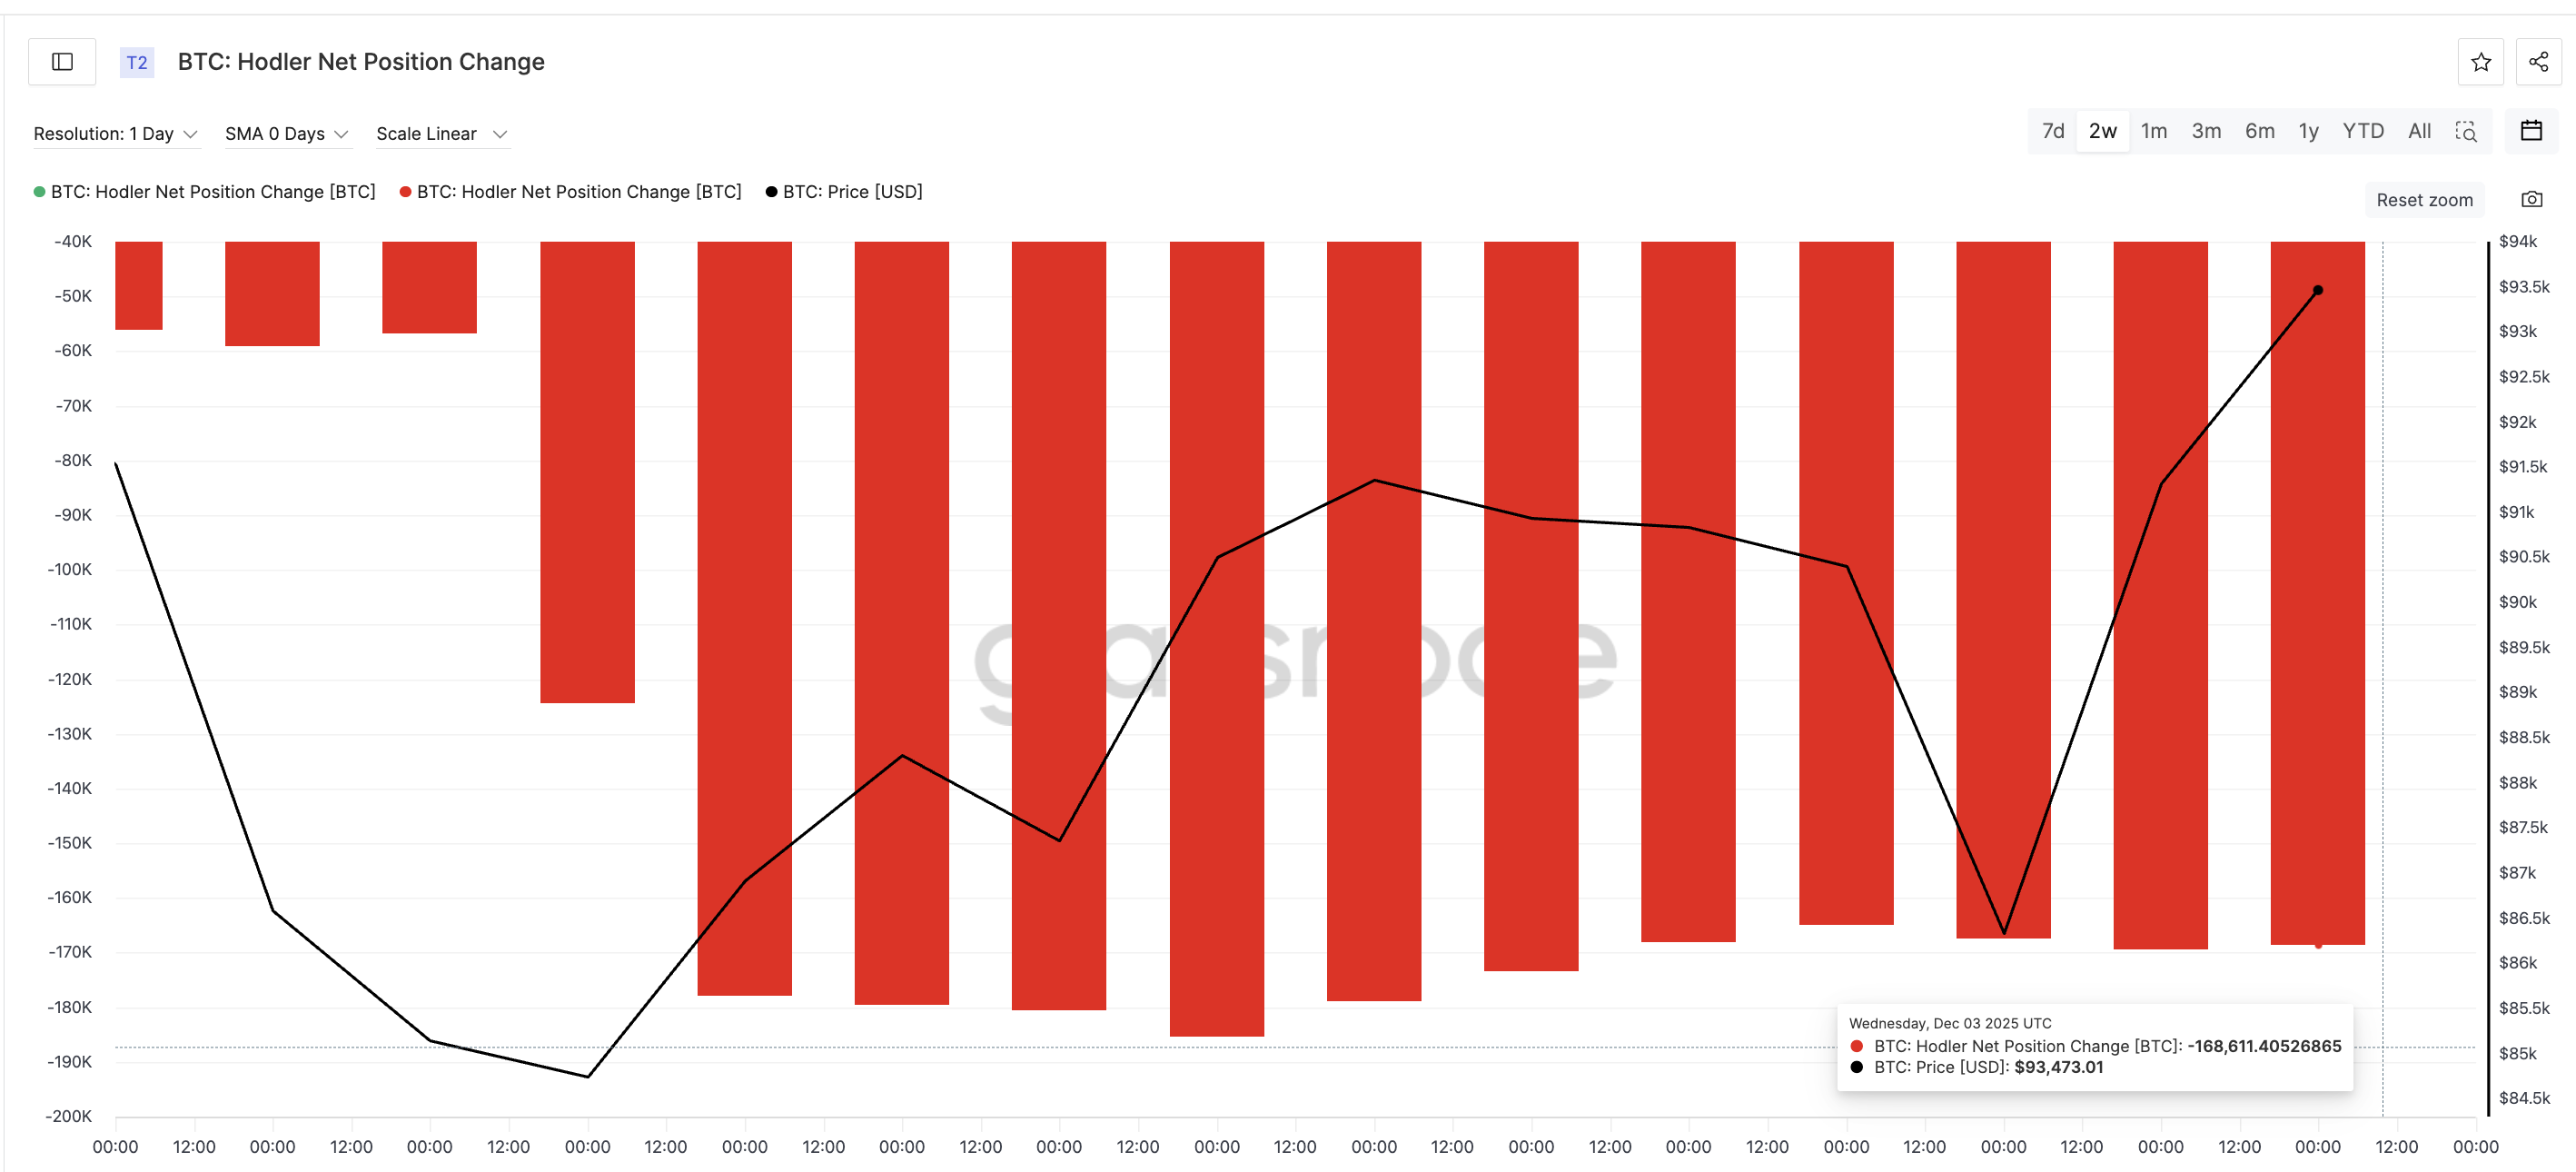 Long-Term BTC Holders: TradingView
Until long-term holders turn into net buyers, any breakout remains vulnerable to quick reversals triggered by speculative money.
This imbalance explains why the Bitcoin price is pressing toward a pattern break but still lacks the depth needed for a secure rally.
Bitcoin Price Levels That Confirm or Spoil the Move
The Bitcoin price sits just under the neckline at $93,200. A 12-hour close above this level confirms the inverse head-and-shoulders pattern and unlocks the next checkpoints at $96,600, $99,800, and $104,000.
If buyers push through these levels with real strength, the full extension of the pattern lands near $108,300, which marks the potential 15% move referenced earlier.
Weakness shows if Bitcoin slips below $90,400, a level where buyers stepped in during recent dips. Losing that zone invites a deeper test near $84,300, and a fall under $80,500 invalidates the entire structure.
 Bitcoin Price Analysis: TradingView
For now, Bitcoin is attempting a pattern break with improving spot flows, rising speculative demand, and cautious long-term holders. The chart has room for a 15+% extension, but clearing $93,200 with real conviction decides whether that move actually begins.
Recommended Articles


