

Pi Coin Cannot Afford To Hit The Brakes — A 34% Breakdown Gets Triggered If It Slows
Pi Coin has been one of the month’s strongest movers. It is up almost 11%, while Bitcoin and Ethereum are down about 20% and 26%, respectively. Even in the past 24 hours, the Pi Coin price added roughly 2.24%.
But this strength also comes with a warning. The chart shows a structure where any slowdown could trigger a 34% downside break if one key level fails. That sets the stage for a simple question: Is Pi Coin still safe as long as it keeps running, or are the signs pointing the other way?
Rising Price, Hidden Trap In The Pattern
Pi Coin is forming a clear head-and-shoulders pattern, a structure that often appears before breakdowns. The neckline of this pattern sits near $0.21. If the PI price closes below that area, the distance from the “head” to the neckline projects a possible 34% decline.
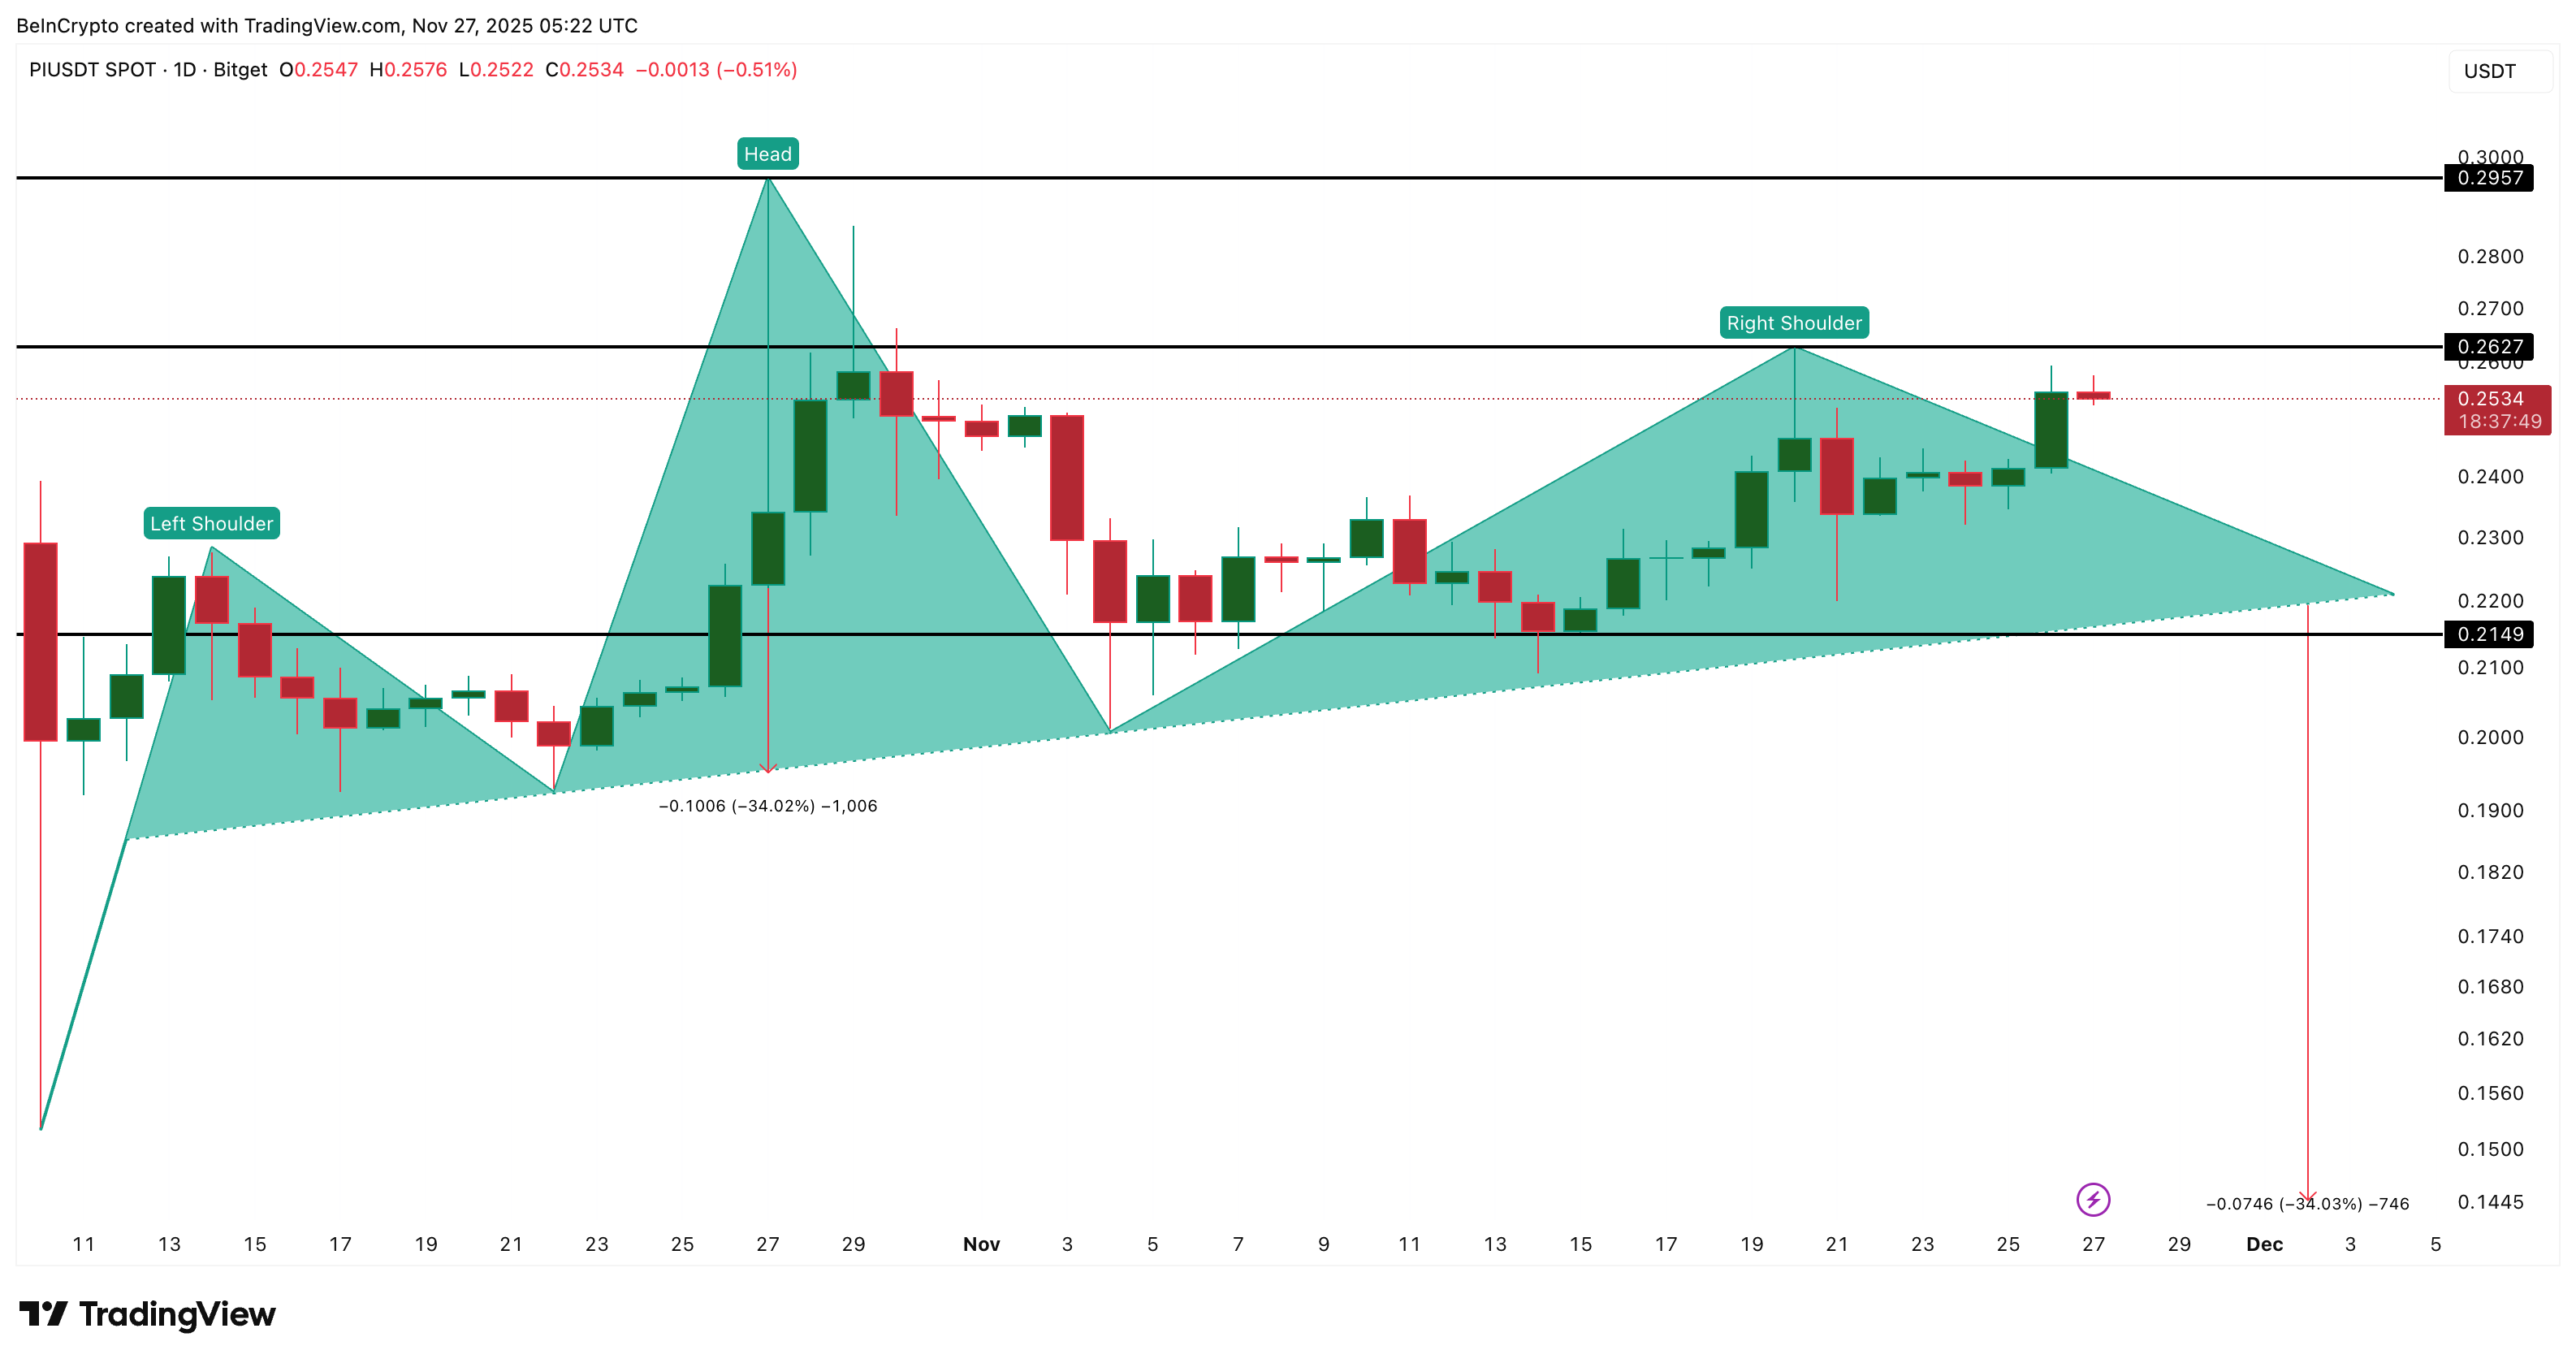 PI Forms A Bearish Pattern: TradingView
Want more token insights like this? Sign up for Editor Harsh Notariya’s Daily Crypto Newsletter here.
To save itself from the risk, PI needs to beat the head formation by going above $0.29. That would mean a steeper price rise.
Momentum adds weight to that risk.
The Relative Strength Index (RSI), which tracks buying and selling strength, has shown hidden bearish divergence. Between November 20 and November 26, Pi Coin made a lower high, while the RSI made a higher high. Hidden bearish divergence usually continues the prevailing trend — and Pi Coin’s broader 30-day trend has been weak, despite the monthly gains.
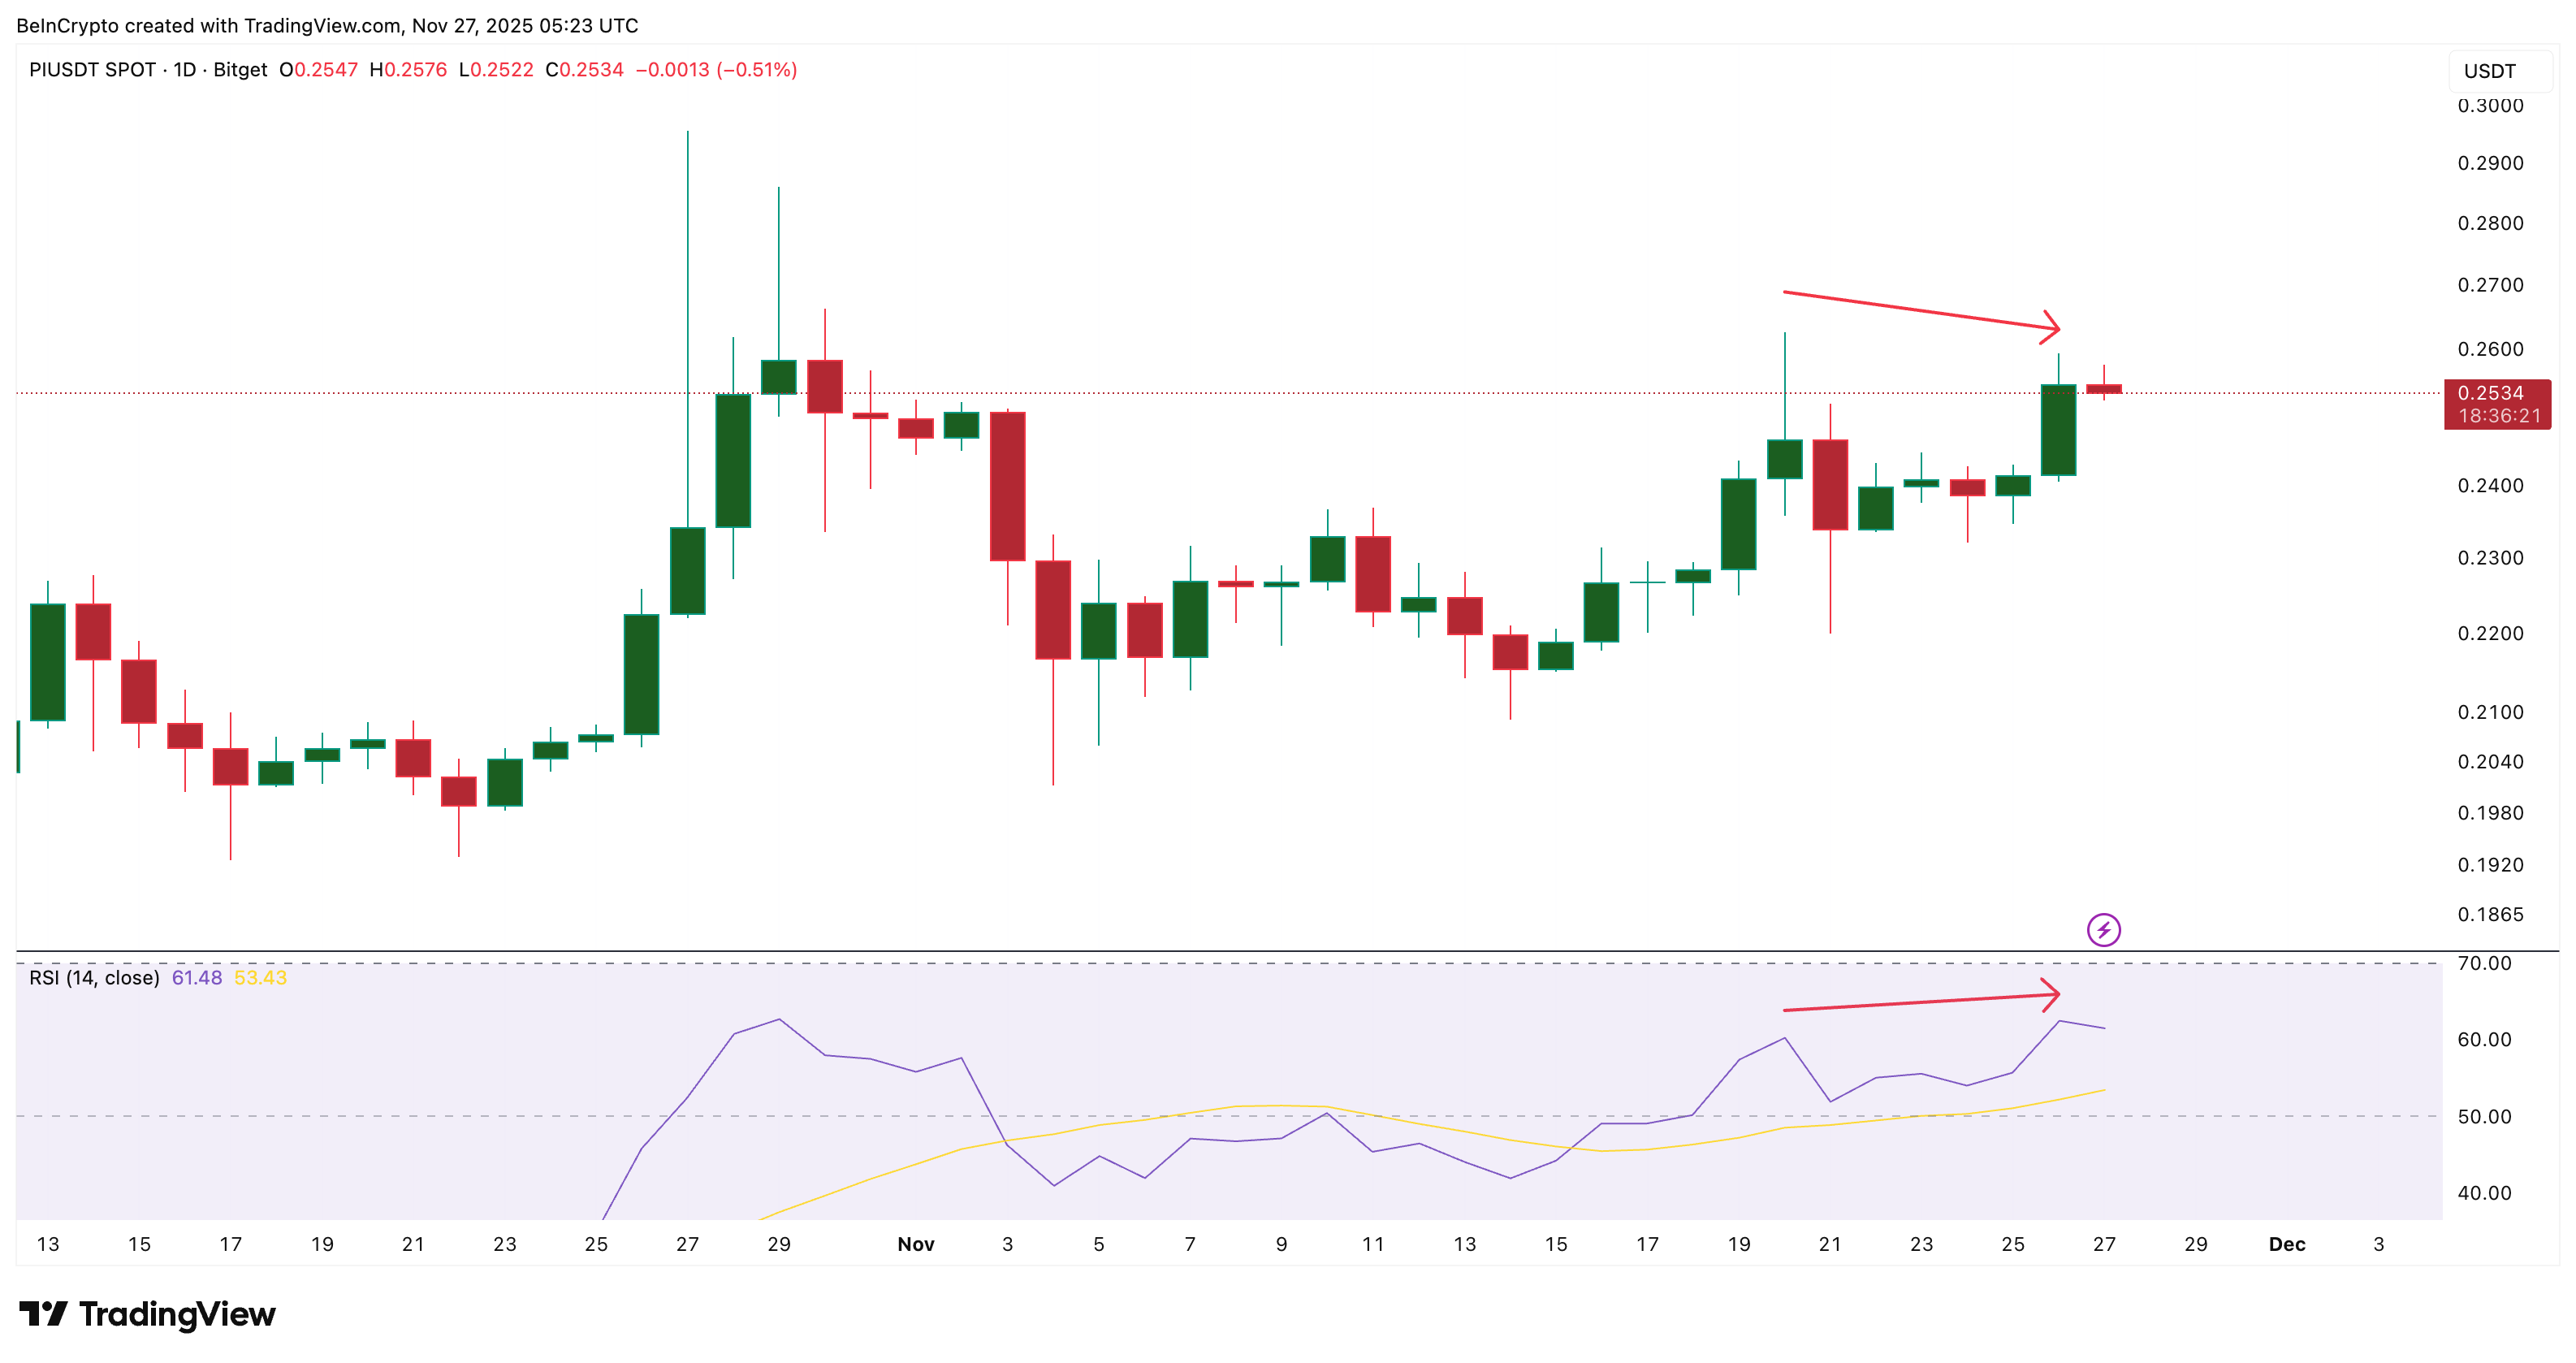 Weak Price Action: TradingView
That means the up-move is real, but the underlying structure warns that a pause could flip momentum back to the downside quickly. And that might not be healthy for the Pi Coin price
Key Levels Decide Whether Pi Coin Price Can Keep Climbing
Pi Coin trades near $0.26, but this level doesn’t settle the debate. The key level that breaks the entire bearish pattern is $0.29.
A daily close above $0.29 would invalidate the head-and-shoulders setup and allow Pi Coin to aim higher. That would show the rally still has control. Until that happens, every dip needs attention.
The first support sits near $0.23. Losing that turns focus to $0.20–$0.22, zone. The neckline level discussed earlier falls in this zone.
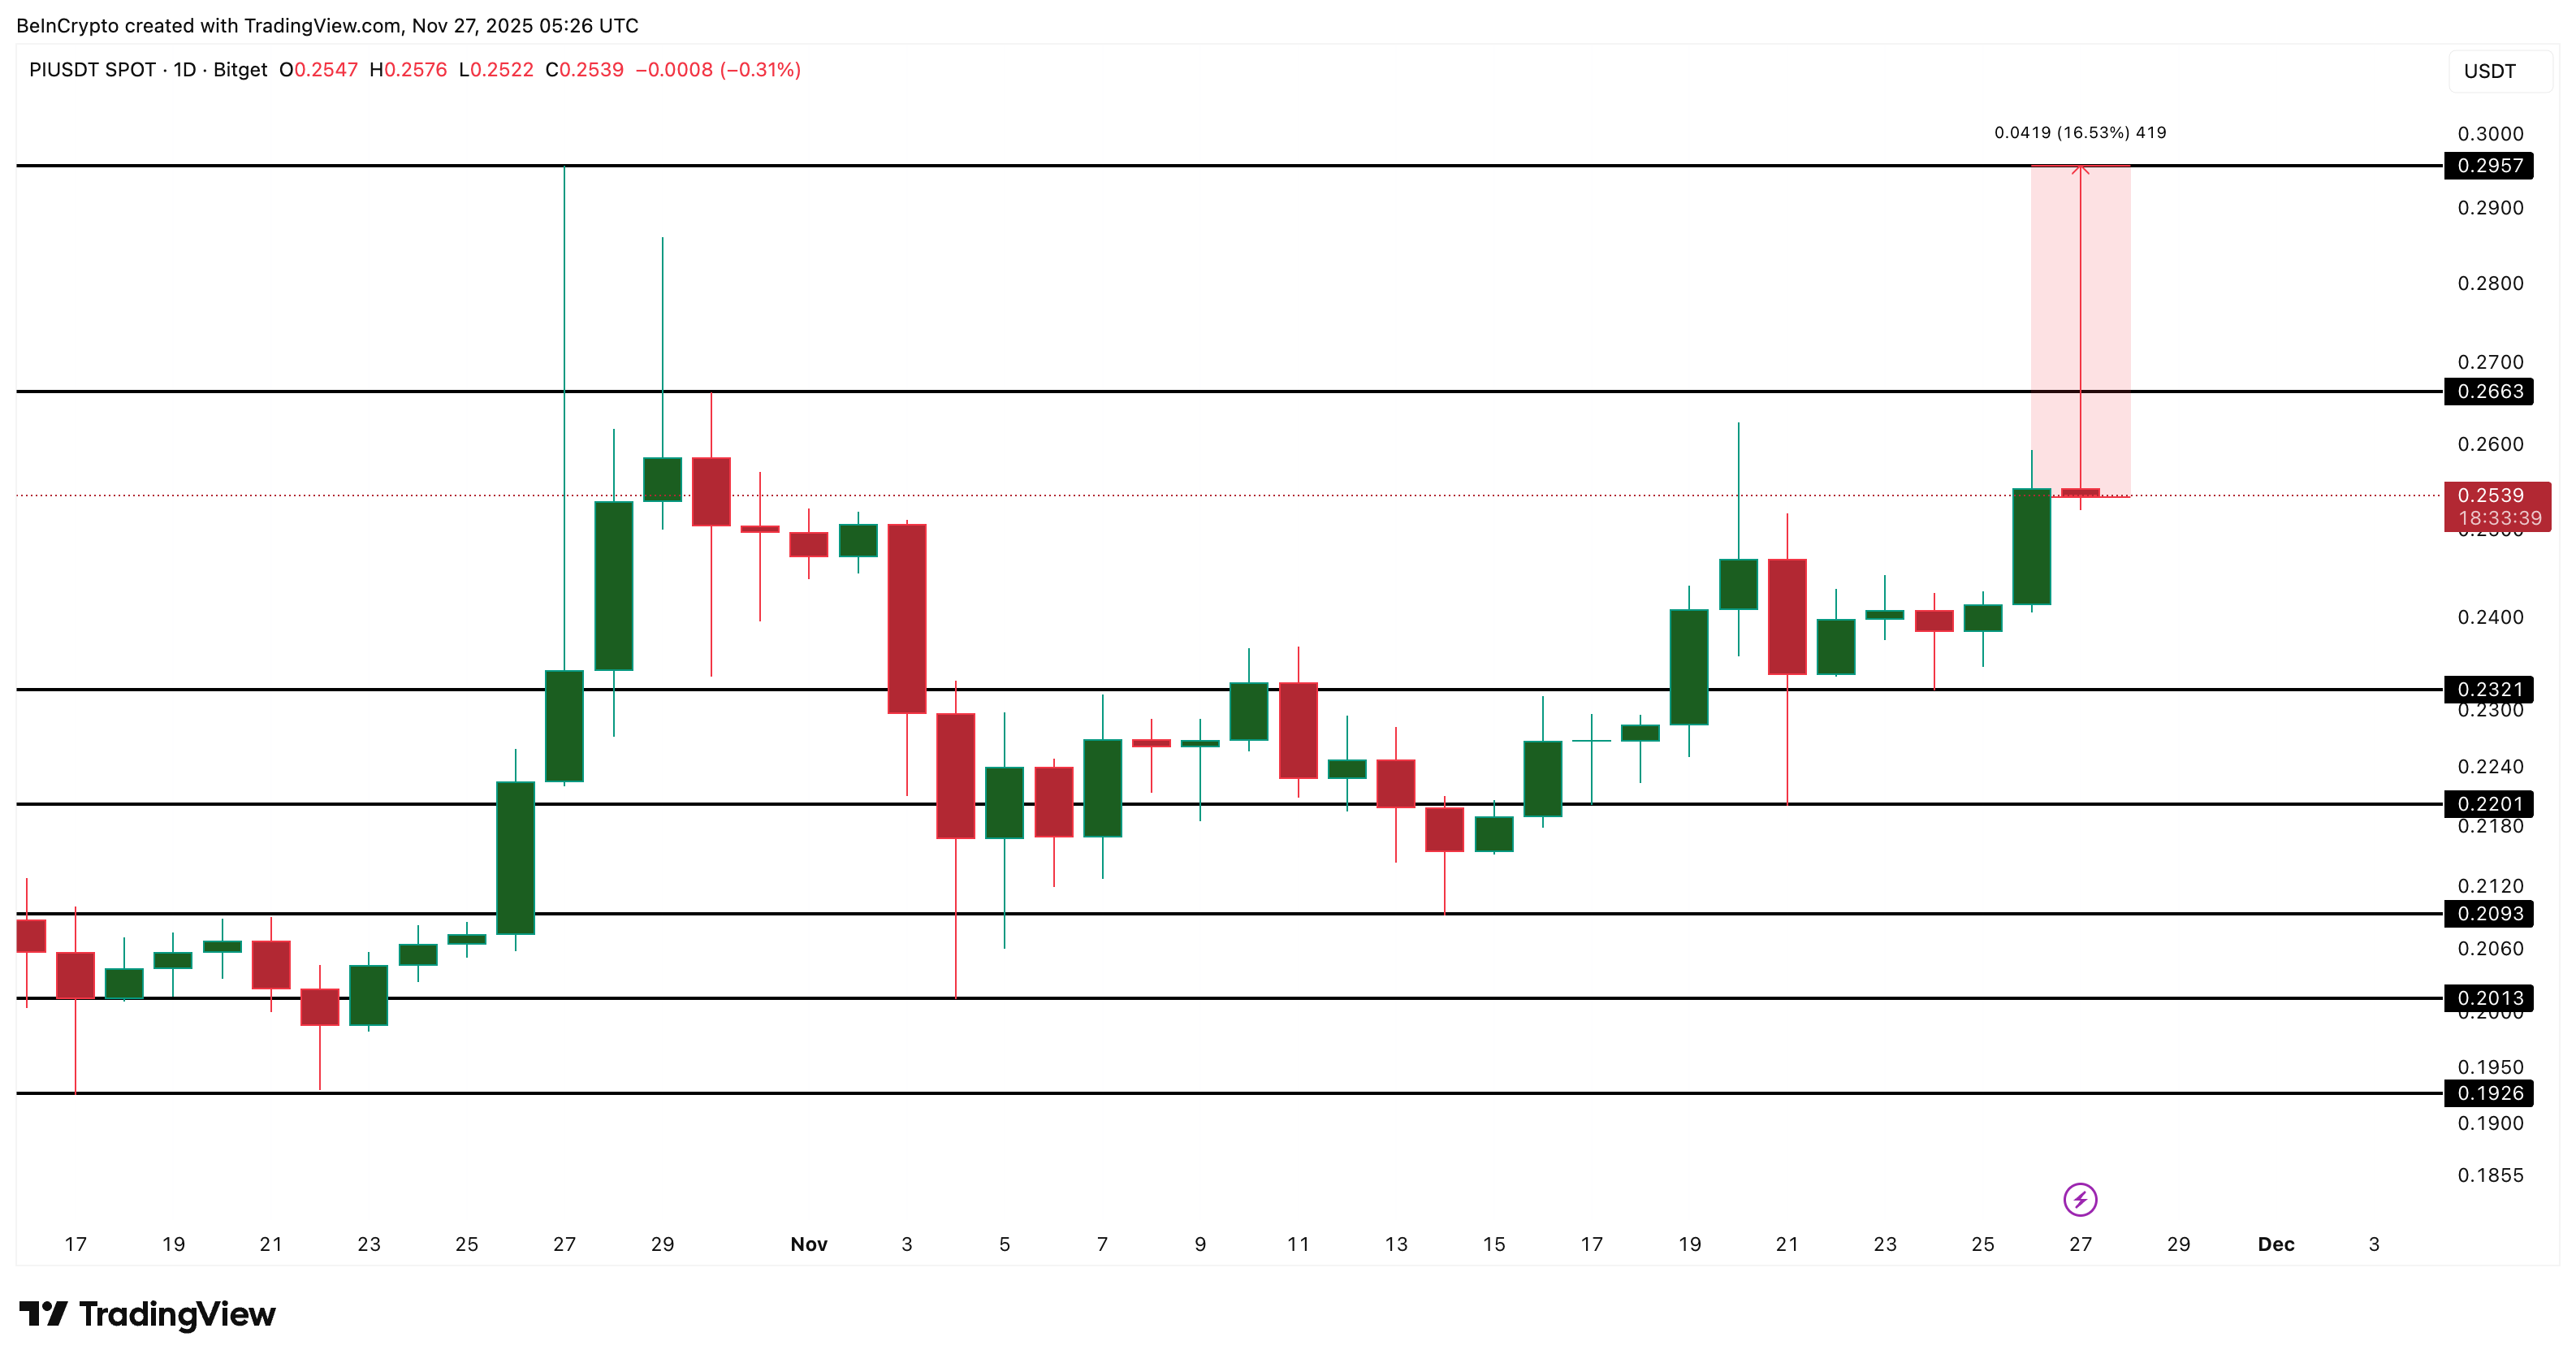 Pi Coin Price Analysis: TradingView
A daily close below this zone is what triggers the full 34% downside target, pulling Pi Coin toward $0.19 or even lower if market conditions weaken.
So the message is simple:
- If Pi Coin keeps climbing and clears $0.29, the uptrend holds.
- If it slows down and slips under $0.20-$0.22, the breakdown gets triggered.
Right now, Pi Coin cannot afford to “hit the brakes.” Its trend survives only as long as the climb continues.
Recommended Articles


