Top Crypto Losers: Starknet, Telcoin and MYX Finance extend losses as Bitcoin dips below $86,000

Source Fxstreet
  • Starknet price trades in red on Friday after falling more the 10% in the previous day.
  • Telcoin price slips below $0.005, extending losses.
  • MYX Finance trades below $2.47 after being rejected by the 50-day EMA earlier this week.

Starknet (STRK), Telcoin (TEL) and MYX Finance (MYX) continued to face selling pressure on Friday as Bitcoin (BTC) slipped below $86,000, dragging smaller cryptocurrencies down. According to the CoinGecko data, STRK, TEL, and MYX have corrected by more than 18% over the last 24 hours. The technical outlook for these altcoins suggests further losses as the broader bearish sentiment dominates the crypto market.

Starknet faces rejection from the key resistance zone

Starknet price retested the 61.8% Fibonacci retracement level at $0.26 (drawn from January 21 high of $0.40 to the October low at $0.03) on Wednesday and declined 10.36% the next day. At the time of writing on Friday, STRK continues to trade down at $0.22.

If STRK continues its correction, it could extend the decline toward the daily support at $0.15.

The Relative Strength Index (RSI) on the daily chart stands at 63, having pulled back from the overbought zone earlier this week and signaling a fading bullish momentum. If the RSI drops below the neutral 50 level, STRK could be at risk of a deeper correction.

STRK/USDT daily chart 

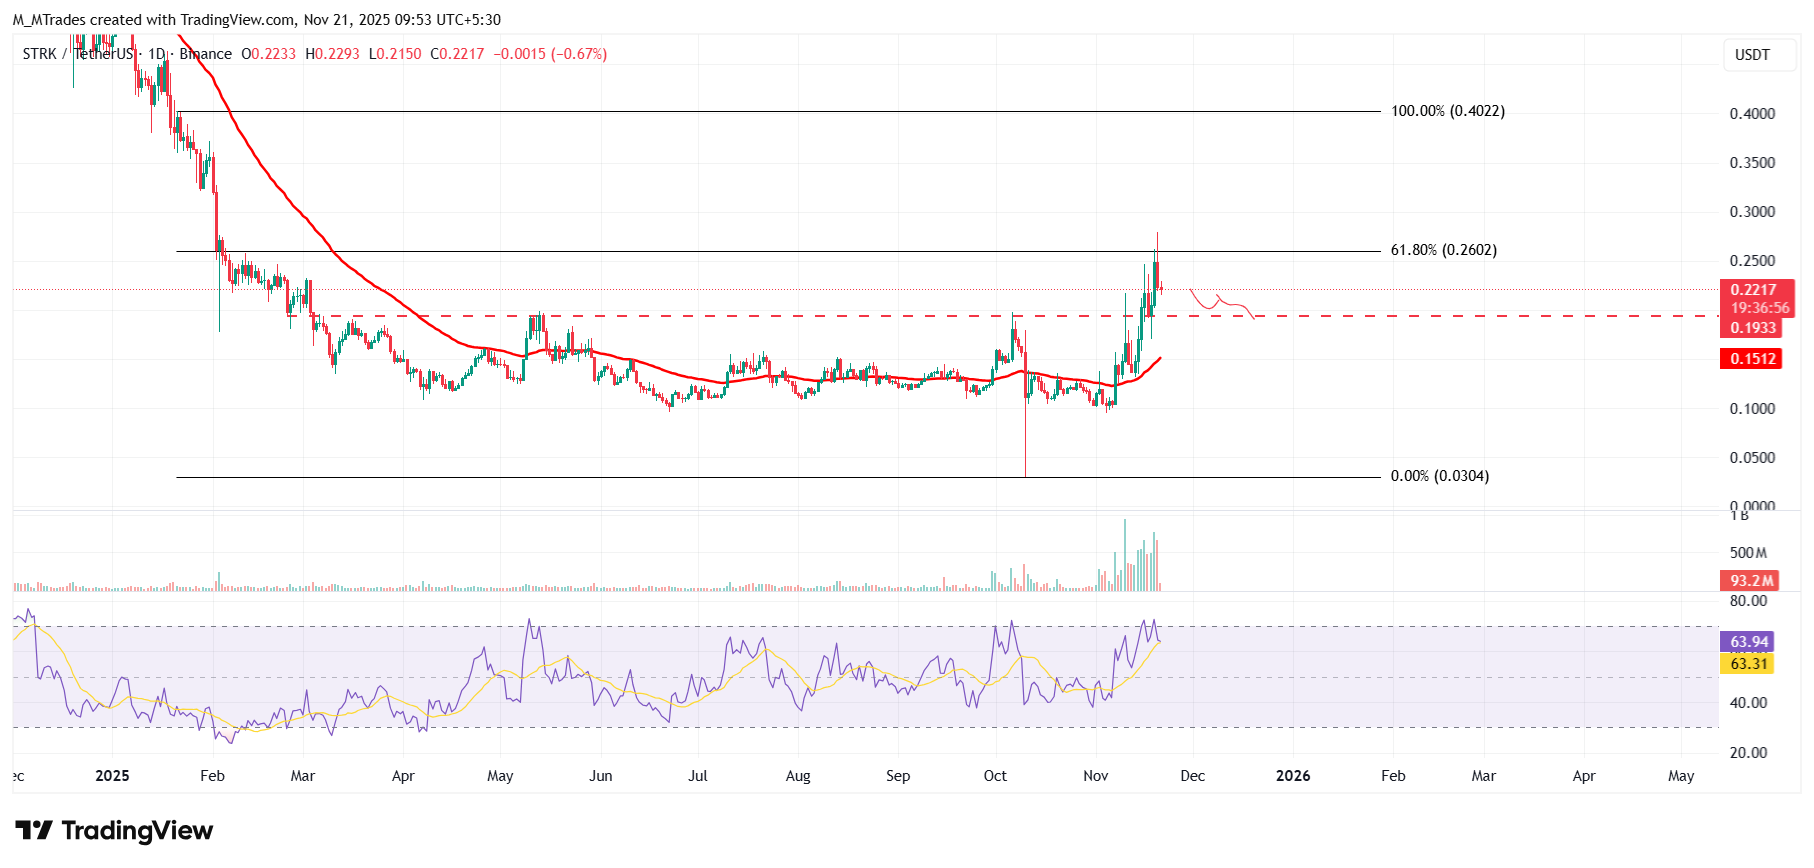
On the other hand, if STRK recovers, it could extend the recovery toward the 61.8% Fibonacci level at $0.26.

Telcoin slips below $0.005, as bears tighten control

Telcoin's price faced rejection at the daily resistance of $0.007 on Tuesday and declined by more than 21% over the next two days. At the time of writing on Friday, TEL continues to trade down at $0.005.

If TEL continues its pullback, it could extend the decline toward the 50-day Exponential Moving Average (EMA) at $0.004.

The RSI on the daily chart stands at 54, having pulled back from the overbought zone earlier this week and signaling a fading bullish momentum. If the RSI drops below the neutral 50 level, Telcoin could be at risk of a deeper correction.

TEL/USDT daily chart 

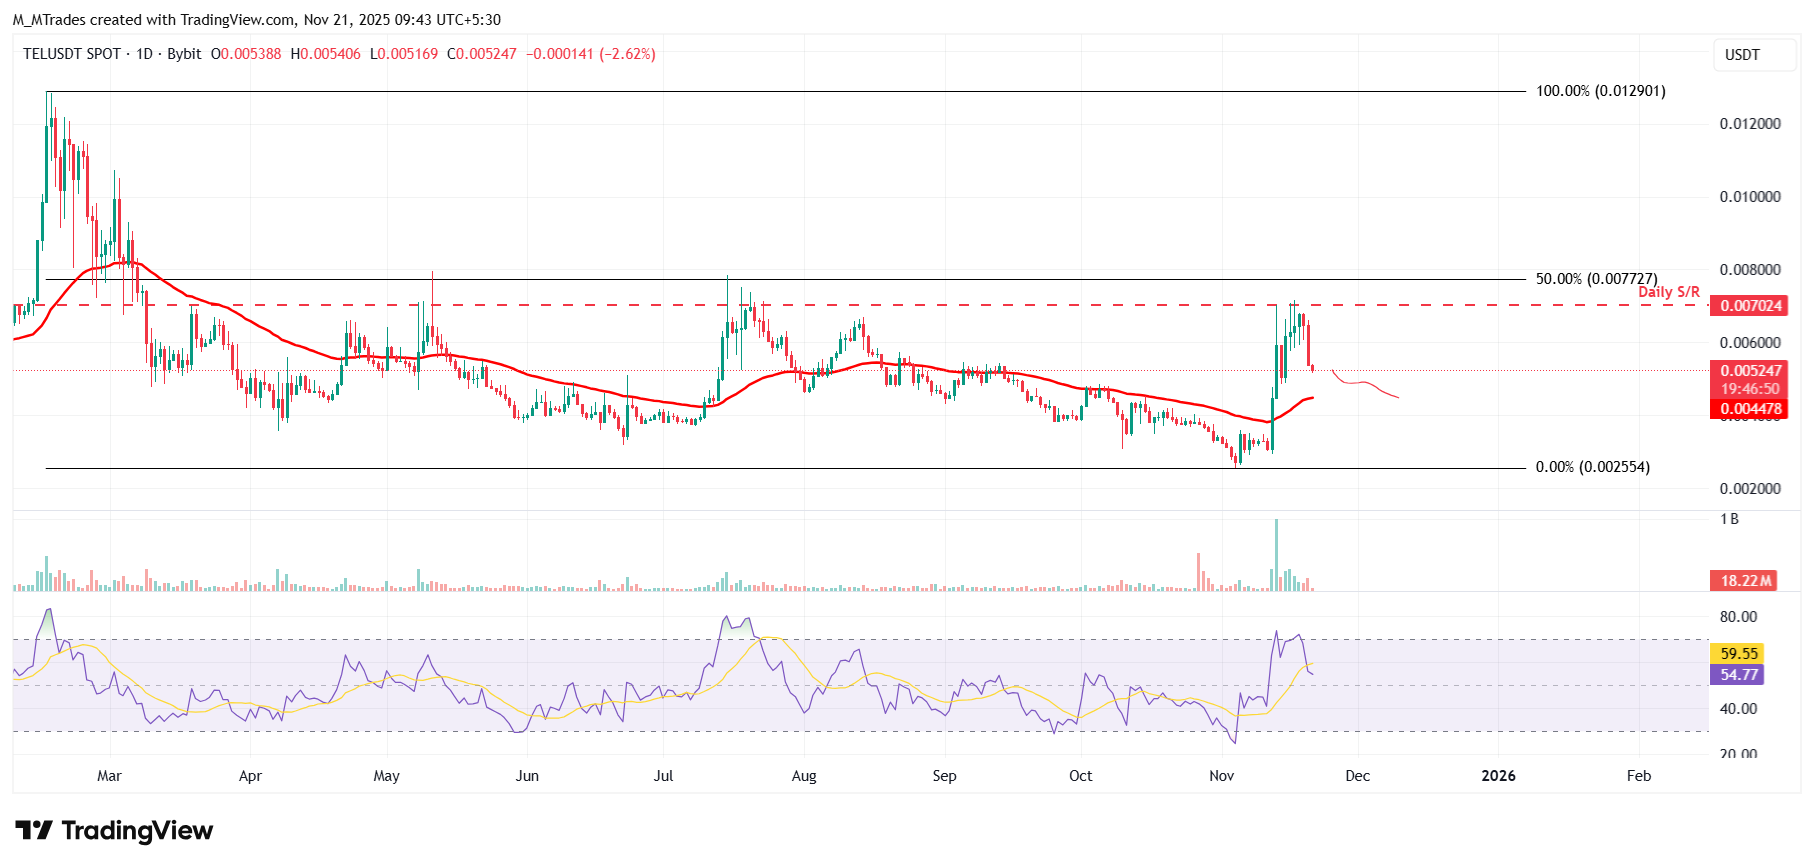
However, if TEL recovers, it could extend the rally toward the daily resistance at $0.007.

MYX Finance shows bearish signs in the momentum indicator

MYX Finance price faced rejection from the 50-day EMA at $3.49 on Wednesday and declined 17% the next day. This 50-day EMA roughly coincides with the daily resistance at $3.36, making this a key resistance zone. At the time of writing on Friday, MYX is trading red at around $2.49.

If MYX continues its correction, it could extend the decline toward the November 3 low of $1.69.

The RSI reads 45, below its neutral level of 50, indicating bearish momentum gaining traction.

MYX/USDT daily chart 

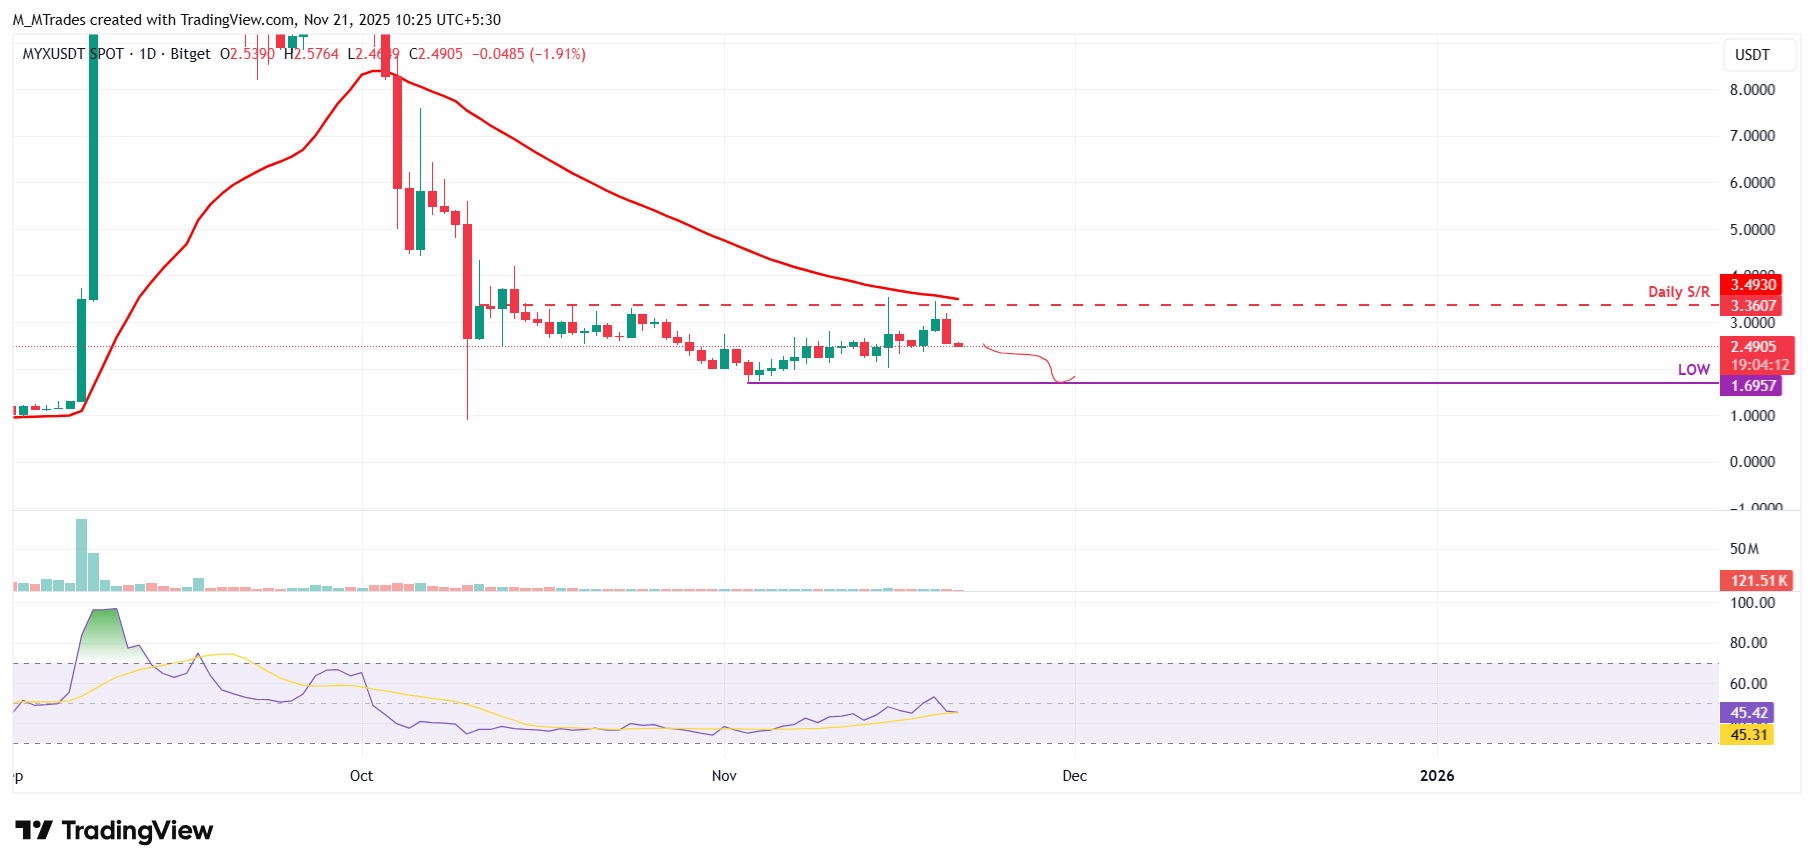
If MYX recovers, it could extend the recovery toward the 50-day EMA at $3.49.

Disclaimer: For information purposes only. Past performance is not indicative of future results.
placeholder
Bitcoin Price Annual Forecast: BTC readies for home run in 2024 with two bullish fundamentals on tapBitcoin prices could return to 2021 highs around $69,000 in 2024 on expectations of the next bull cycle.
Author  FXStreet
Dec 22, 2023
Bitcoin prices could return to 2021 highs around $69,000 in 2024 on expectations of the next bull cycle.
placeholder
Natural Gas sinks to pivotal level as China’s demand slumpsNatural Gas price (XNG/USD) edges lower and sinks to $2.56 on Monday, extending its losing streak for the fifth day in a row. The move comes on the back of China cutting its Liquified Natural Gas (LNG) imports after prices rose above $3.0 in June. It
Author  FXStreet
Jul 01, 2024
Natural Gas price (XNG/USD) edges lower and sinks to $2.56 on Monday, extending its losing streak for the fifth day in a row. The move comes on the back of China cutting its Liquified Natural Gas (LNG) imports after prices rose above $3.0 in June. It
placeholder
The dollar weakened, equities dipped, and gold hit record highsThe dollar weakened, equities fell, and gold set new records on Wednesday as investors waited for a Fed rate cut later in the day.
Author  Cryptopolitan
Sep 17, 2025
The dollar weakened, equities fell, and gold set new records on Wednesday as investors waited for a Fed rate cut later in the day.
placeholder
ECB Policy Outlook for 2026: What It Could Mean for the Euro’s Next MoveWith the ECB likely holding rates steady at 2.15% and the Fed potentially extending cuts into 2026, EUR/USD may test 1.20 if Eurozone growth proves resilient, but weaker growth and an ECB pivot could pull the pair back toward 1.13 and potentially 1.10.
Author  Mitrade
Dec 26, 2025
With the ECB likely holding rates steady at 2.15% and the Fed potentially extending cuts into 2026, EUR/USD may test 1.20 if Eurozone growth proves resilient, but weaker growth and an ECB pivot could pull the pair back toward 1.13 and potentially 1.10.
placeholder
Gold Price Forecast: XAU/USD opens lower around $4,450 on fears of widening Iran conflictsGold price (XAU/USD) opens over 1% lower to near $4,445.00 on Monday, as oil prices have rallied further on fears of further widening of conflicts in the Middle East. WTI Oil price is up almost 3% above $102.50 in the opening trade, increasing fears of higher inflation expectations globally.
Author  FXStreet
Mar 30, Mon
Gold price (XAU/USD) opens over 1% lower to near $4,445.00 on Monday, as oil prices have rallied further on fears of further widening of conflicts in the Middle East. WTI Oil price is up almost 3% above $102.50 in the opening trade, increasing fears of higher inflation expectations globally.
Related Instrument
goTop
quote