Cosmos Price Forecast: ATOM regains strength on whale demand

Source Fxstreet
  • Cosmos records an over 10% rise on Thursday, testing a local resistance trendline after a reversal last week.
  • The derivatives market sees renewed demand for ATOM among large wallet investors. 
  • The technical outlook remains optimistic despite strong resistance, as bullish momentum continues to build. 

Cosmos (ATOM) rises above the $3.00 round figure at the time of writing on Thursday, preparing for a potential breakout from a local resistance trendline. The sudden surge in ATOM is on the back of increased derivatives market demand from large wallet investors, popularly known as whales, which is driving up futures Open Interest (OI). The technical outlook is giving early signals of a bullish shift, as the Relative Strength Index (RSI) indicates increased buying pressure, aligning with a potential breakout. 

Whales add positions in ATOM futures, boosting overall demand

Cosmos is racking up retail interest this week following the partnership between Everstake and Turkey’s Paribu Custody to provide institutional-grade staking for ATOM and other digital assets. 

As the market settles after a rough start to the week, the partnership becomes a sentimental catalyst for Cosmos, driving whale demand in derivatives markets. CryptoQuant data shows that large whale orders are increasing the average order size in ATOM futures, suggesting risk-on sentiment as traders anticipate a recovery. 

Cosmos derivatives indicators. Source: CryptoQuant.

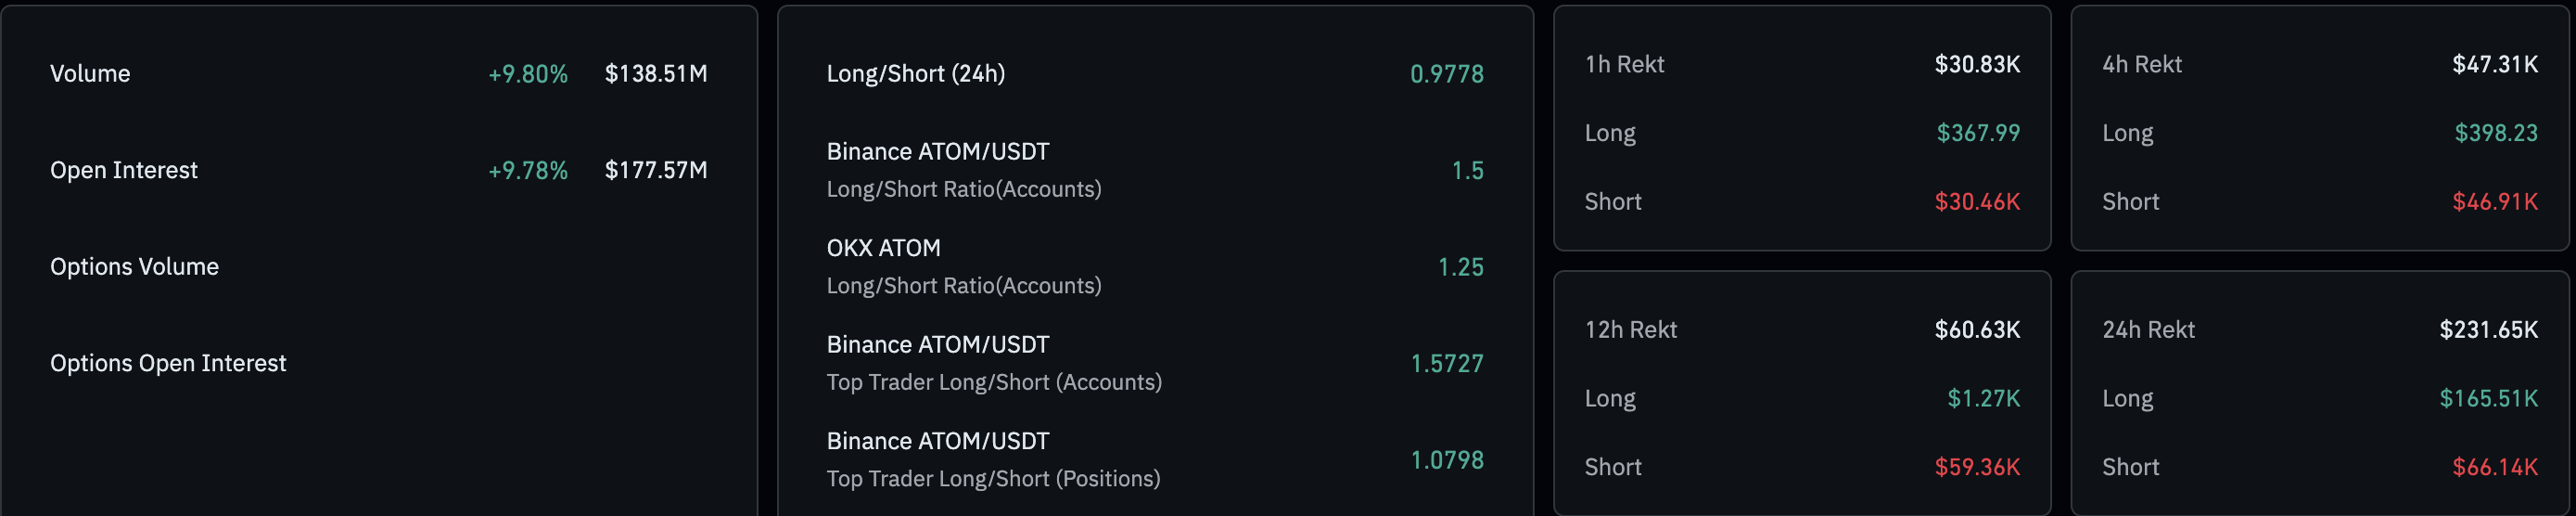
In line with rising order sizes, the ATOM futures Open Interest (OI) has increased by 9.78% over the last 24 hours, reaching $177.57 million. 

ATOM derivatives data. Source: CoinGlass.

Cosmos builds bullish momentum amid breakout possibility

Cosmos is forming a potential bullish Marubozu candle, with an 11% surge by press time on Thursday, after a hammer candlestick the previous day, overshadowing the last seven candles on the daily chart. The intraday surge exceeds a local resistance trendline formed by connecting the peaks of October 13 and November 11, near $3.00. 

If ATOM holds the daily close above the $3.00 round figure, it would confirm a breakout and mark a short-term bullish trend reversal. However, the proximity of overhead resistance, including the 50-day Exponential Moving Average (EMA) at $3.21 and the supply zone near $3.50, would act as a headwind. 

Although ATOM is opposed to multiple resistances, the short-term increase in buying pressure signals a shift in trend momentum. The RSI at 52 on the daily chart surpasses the midline for the first time since the mid-September pullback. At the same time, the Moving Average Convergence Divergence (MACD) flips upwards from near the signal line, avoiding a bearish crossover. An extension in the MACD uptrend aligns with an increase in the green histogram bar, suggesting strong bullish momentum. 

ATOM/USDT daily price chart.

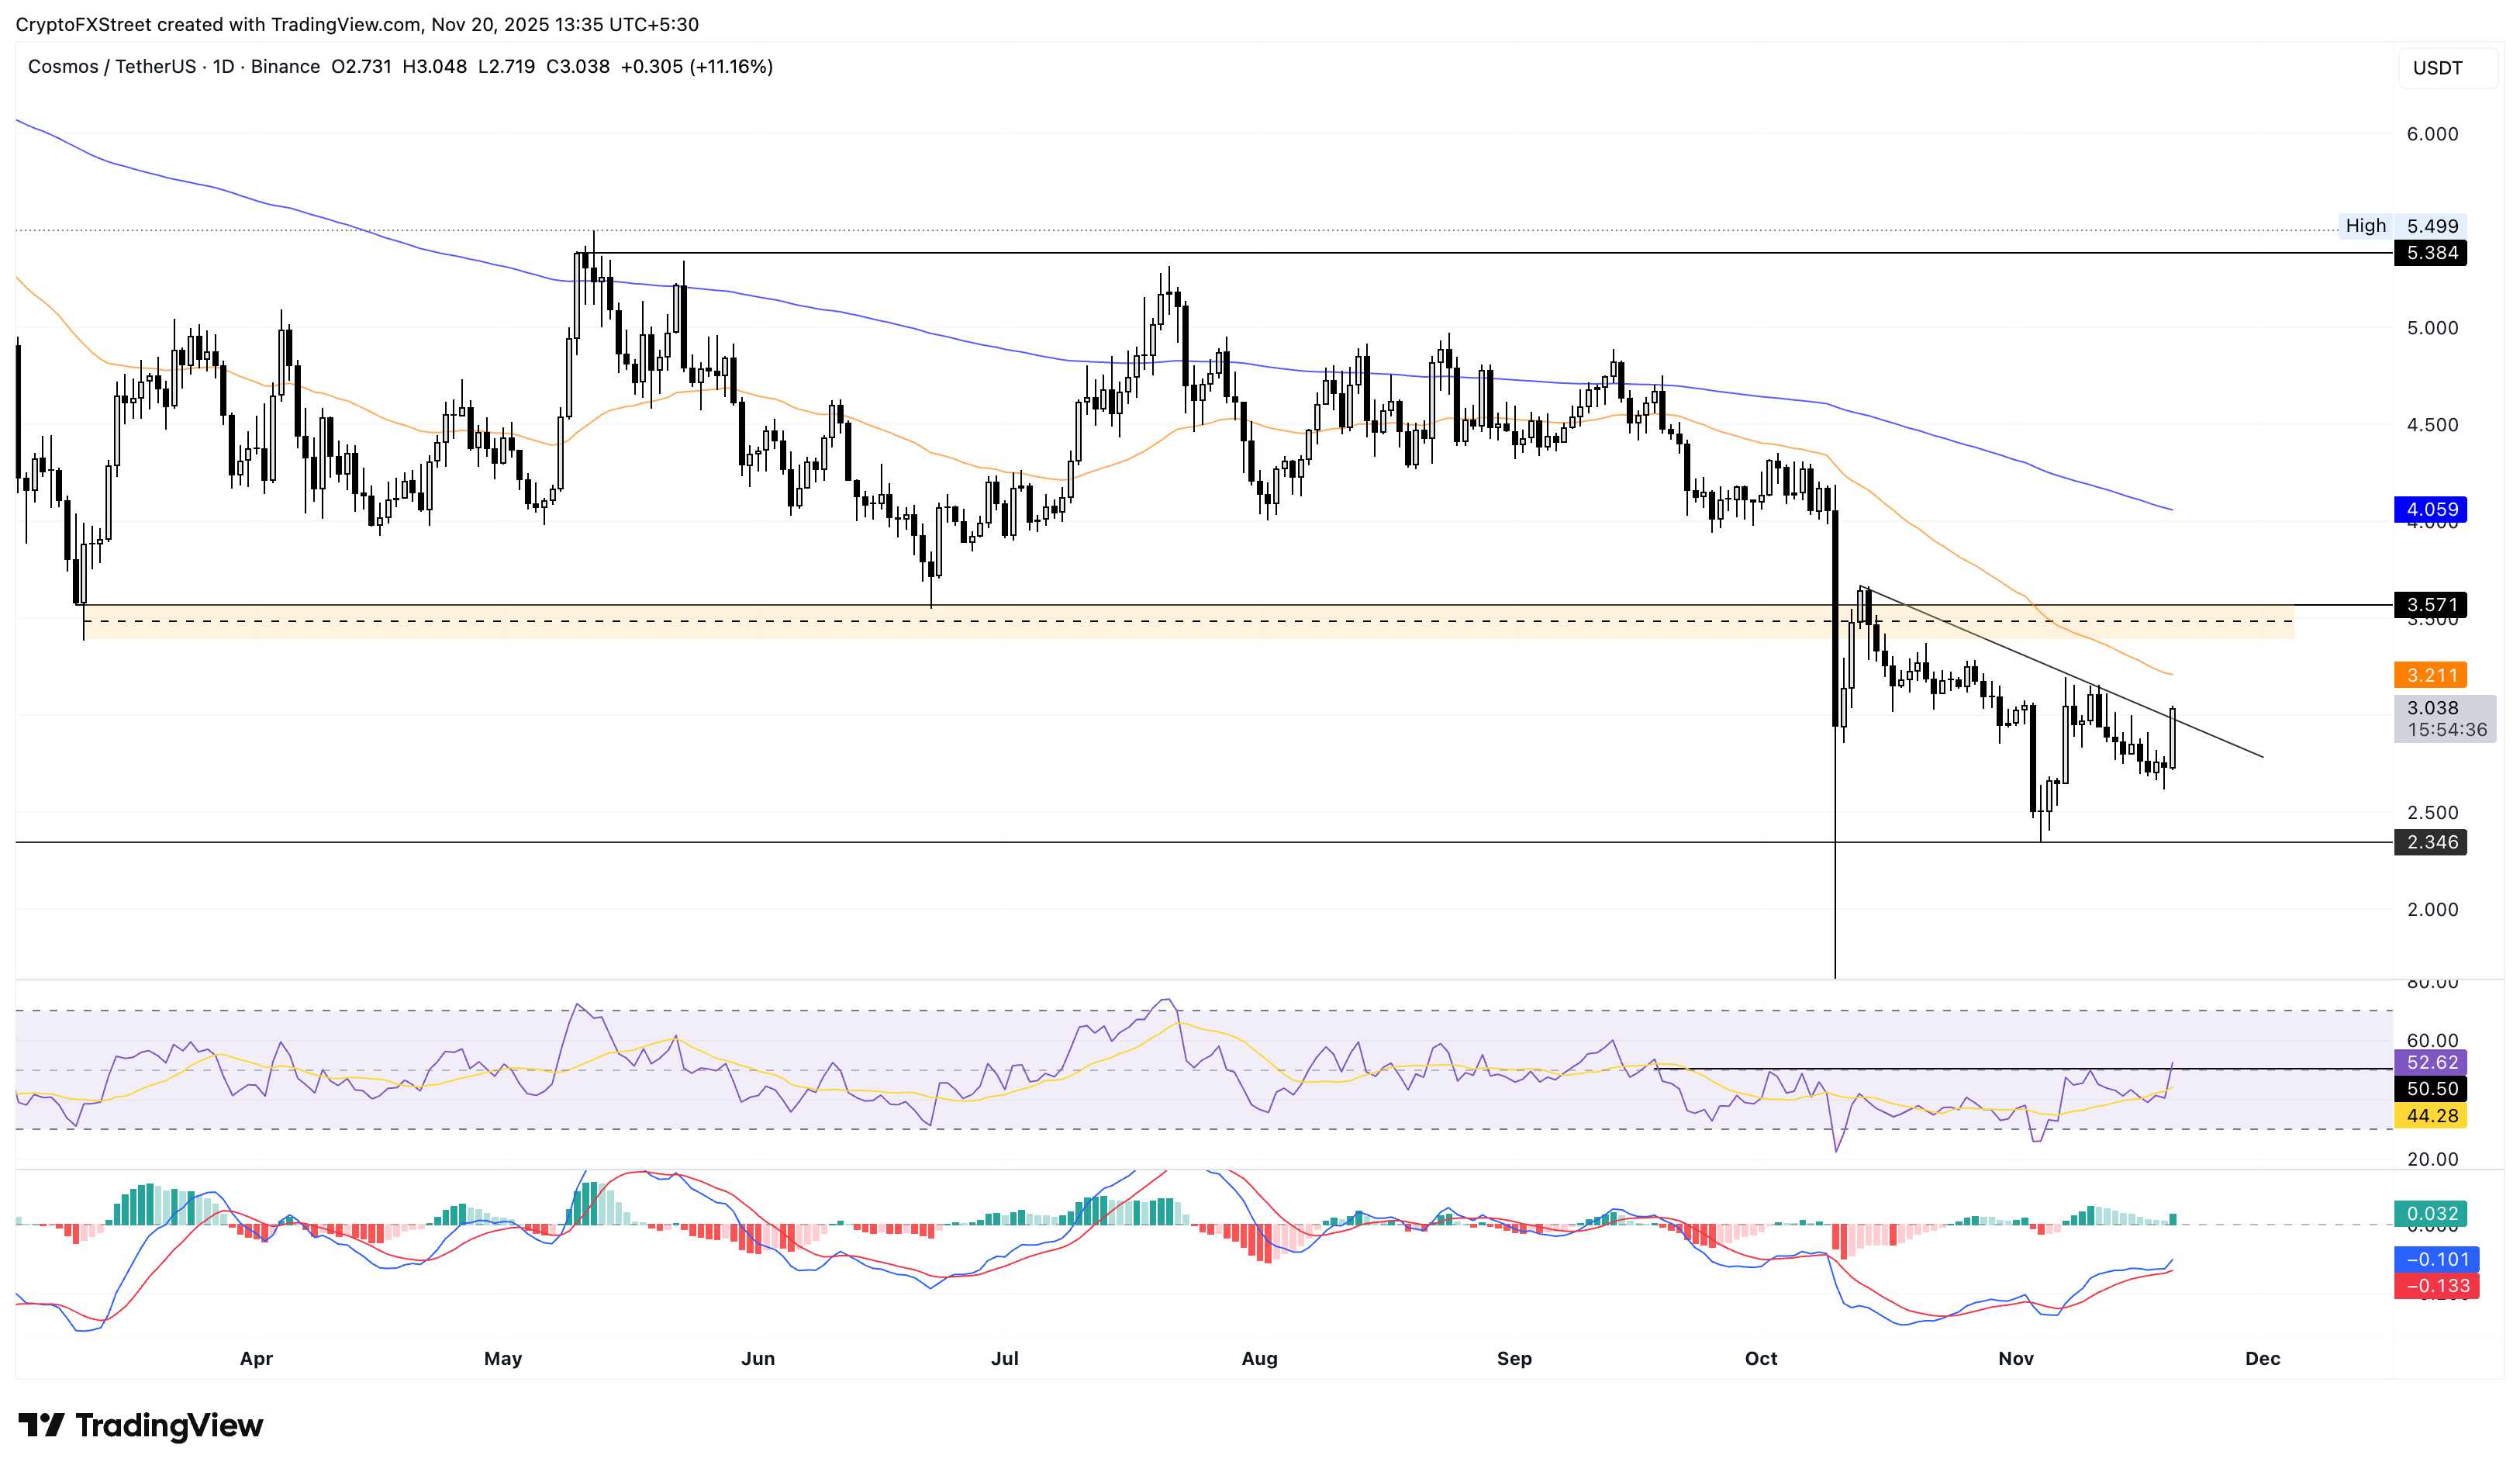
However, if Cosmos reverses from the $3.00 mark, it could retest the November 4 low at $2.34. 

Disclaimer: For information purposes only. Past performance is not indicative of future results.
placeholder
Bitcoin Price Annual Forecast: BTC readies for home run in 2024 with two bullish fundamentals on tapBitcoin prices could return to 2021 highs around $69,000 in 2024 on expectations of the next bull cycle.
Author  FXStreet
Dec 22, 2023
Bitcoin prices could return to 2021 highs around $69,000 in 2024 on expectations of the next bull cycle.
placeholder
Natural Gas sinks to pivotal level as China’s demand slumpsNatural Gas price (XNG/USD) edges lower and sinks to $2.56 on Monday, extending its losing streak for the fifth day in a row. The move comes on the back of China cutting its Liquified Natural Gas (LNG) imports after prices rose above $3.0 in June. It
Author  FXStreet
Jul 01, 2024
Natural Gas price (XNG/USD) edges lower and sinks to $2.56 on Monday, extending its losing streak for the fifth day in a row. The move comes on the back of China cutting its Liquified Natural Gas (LNG) imports after prices rose above $3.0 in June. It
placeholder
The dollar weakened, equities dipped, and gold hit record highsThe dollar weakened, equities fell, and gold set new records on Wednesday as investors waited for a Fed rate cut later in the day.
Author  Cryptopolitan
Sep 17, 2025
The dollar weakened, equities fell, and gold set new records on Wednesday as investors waited for a Fed rate cut later in the day.
placeholder
ECB Policy Outlook for 2026: What It Could Mean for the Euro’s Next MoveWith the ECB likely holding rates steady at 2.15% and the Fed potentially extending cuts into 2026, EUR/USD may test 1.20 if Eurozone growth proves resilient, but weaker growth and an ECB pivot could pull the pair back toward 1.13 and potentially 1.10.
Author  Mitrade
Dec 26, 2025
With the ECB likely holding rates steady at 2.15% and the Fed potentially extending cuts into 2026, EUR/USD may test 1.20 if Eurozone growth proves resilient, but weaker growth and an ECB pivot could pull the pair back toward 1.13 and potentially 1.10.
placeholder
Gold Price Forecast: XAU/USD opens lower around $4,450 on fears of widening Iran conflictsGold price (XAU/USD) opens over 1% lower to near $4,445.00 on Monday, as oil prices have rallied further on fears of further widening of conflicts in the Middle East. WTI Oil price is up almost 3% above $102.50 in the opening trade, increasing fears of higher inflation expectations globally.
Author  FXStreet
Mar 30, Mon
Gold price (XAU/USD) opens over 1% lower to near $4,445.00 on Monday, as oil prices have rallied further on fears of further widening of conflicts in the Middle East. WTI Oil price is up almost 3% above $102.50 in the opening trade, increasing fears of higher inflation expectations globally.
Related Instrument
goTop
quote