

Pi Network Price Forecast: PI rallies with the MiCA-compliant whitepaper release
- Pi Network exceeds the 50-day EMA with a 4% rise on Thursday, marking its sixth day of uptrend.
- The release of the MiCA whitepaper for the European markets boosts demand and sentiment around Pi Network.
- The technical outlook indicates a bullish incline as recovery gains momentum.
Pi Network (PI) is up 11% so far this week, underpinned by its whitepaper on the Market in Crypto-Assets (MiCA) regulations for the European Union (EU) markets. The technical outlook remains bullish as PI exceeds the long-standing dynamic resistance, the 50-day Exponential Moving Average, preparing for a breakout rally.
Pi Network’s MiCA whitepaper could open the gate to the European market
Pi Network is heating up with the release of its MiCA regulations compliance whitepaper, a legal and technical filing submitted to request permission to start trading in the EU and the European Economic Area (EEA). Although the whitepaper is linked to the official Pi Network website, there is no clear announcement from the Pi core team or its founders.
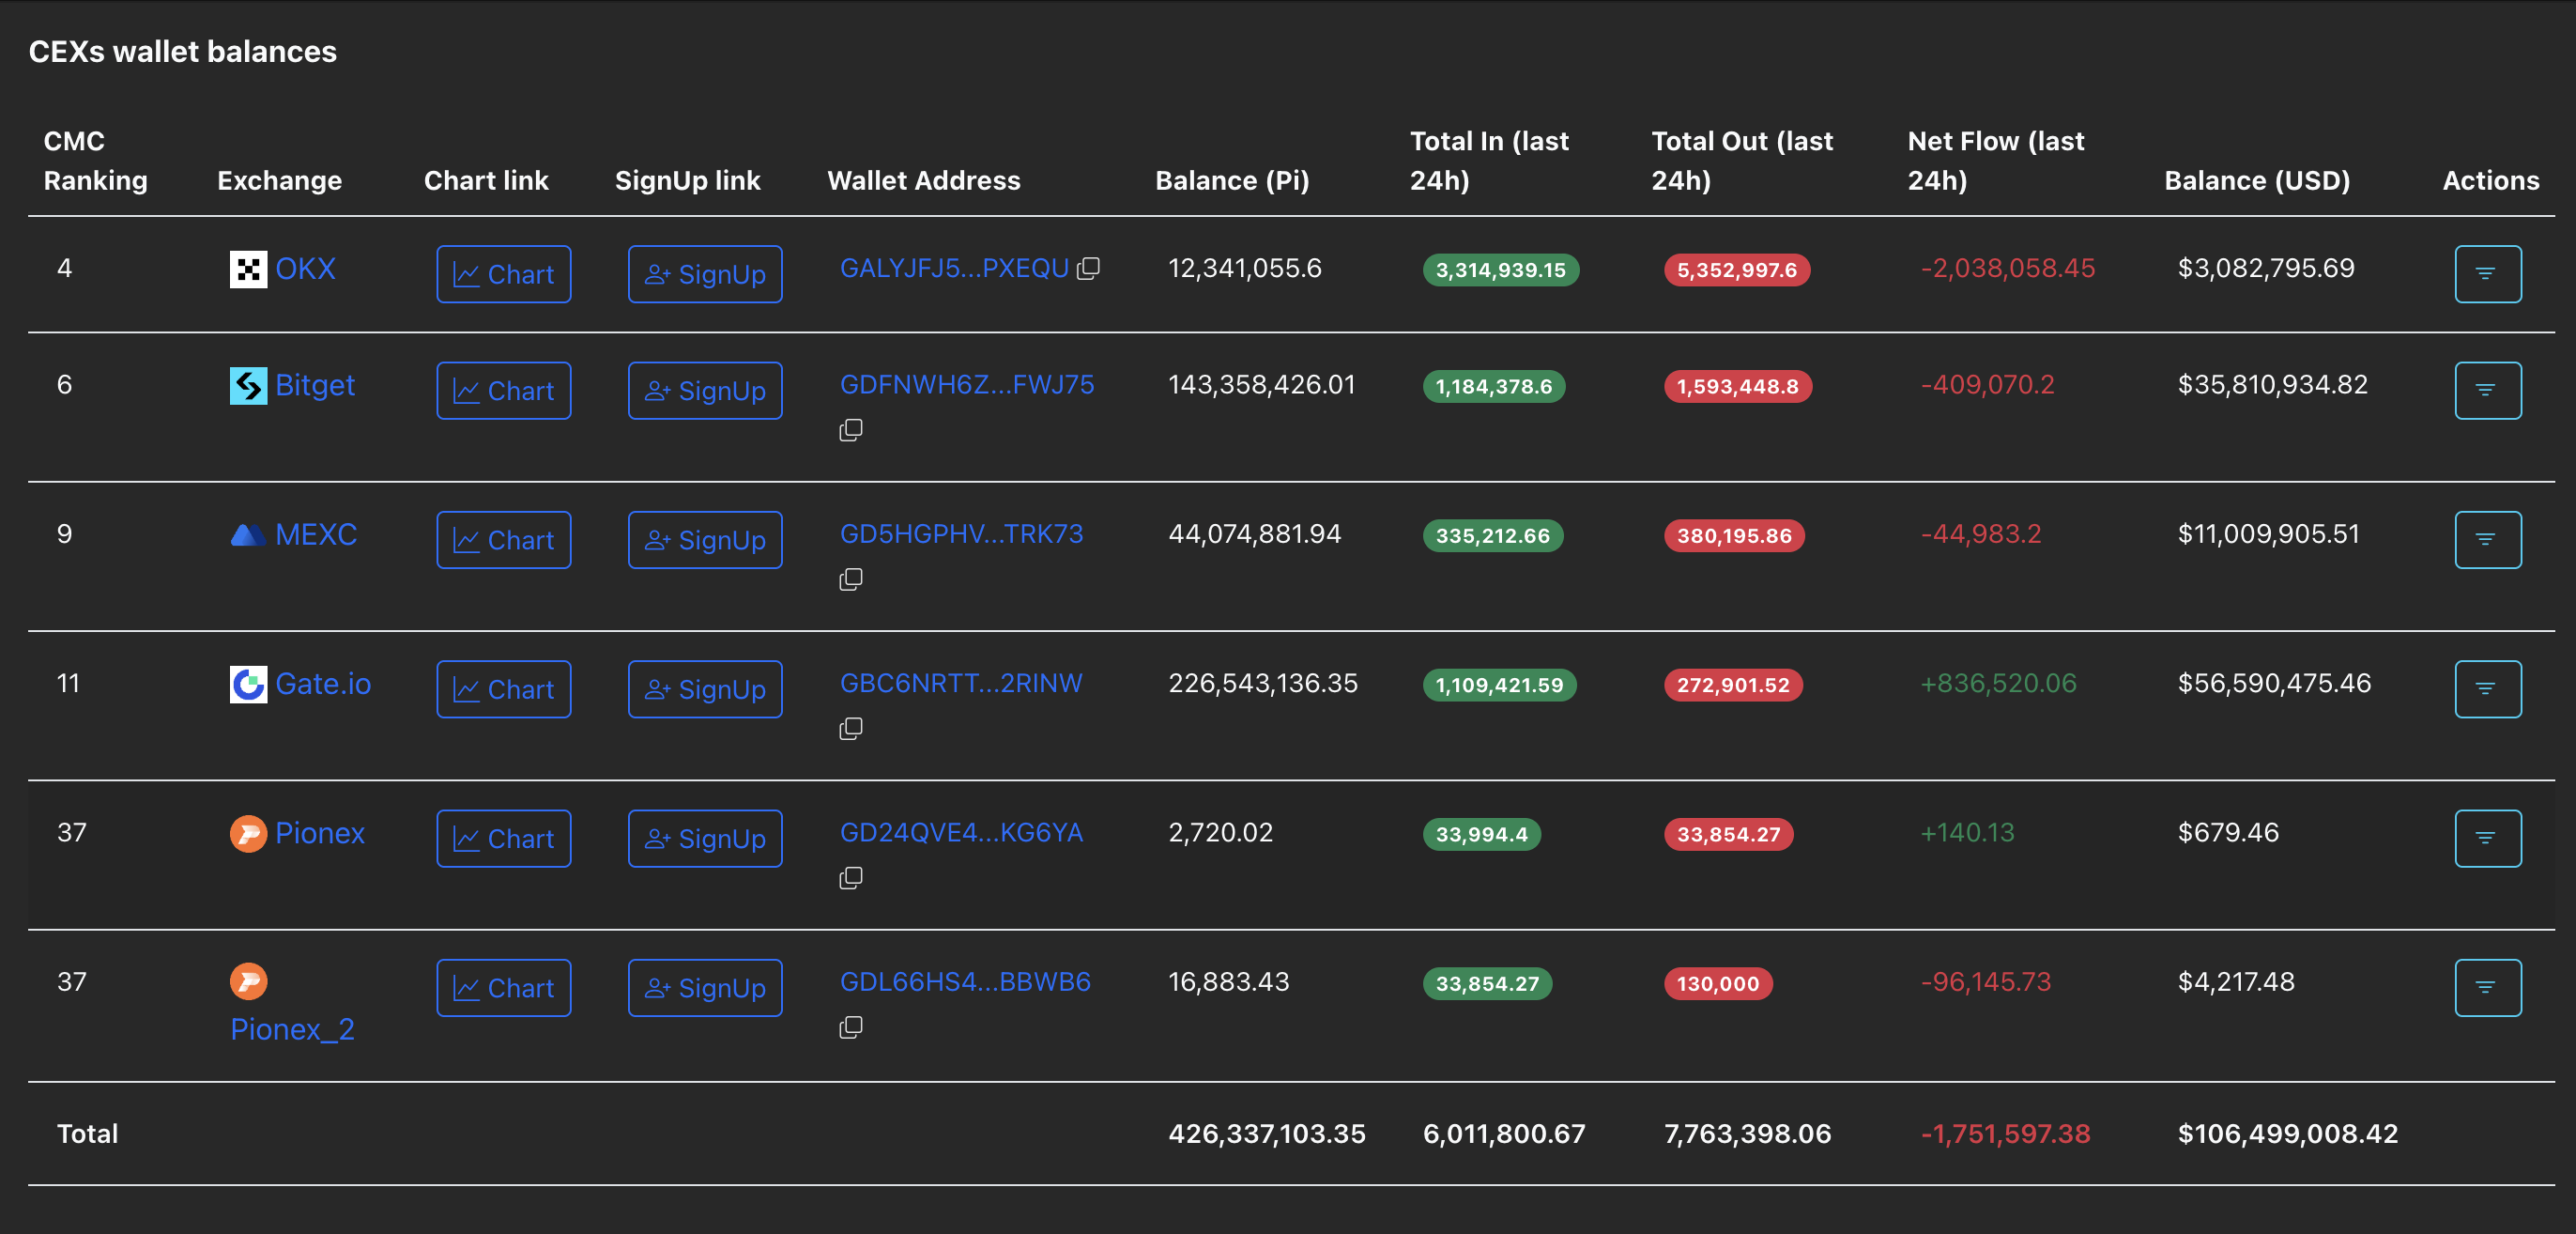
Furthermore, the whitepaper highlights the initial listing request for OKCoin Europe Ltd (OKX Europe), with a start date of November 28. Pi Network positions for a potential increase in trading volume that could support a price surge, typically seen with listing in new markets.
As of Thursday, PI is listed on five Centralized Exchanges (CEXs), which are holding a total balance of 426.33 million tokens. With the release of the MiCA regulation whitepaper, the increased demand for CEXs has led to a net outflow of 1.75 million PI, suggesting buy-side dominance.
Pi Network exceeds the 50-day EMA
Pi Network trades near the $0.2500 level, holding above the 50-day EMA at $0.2431. The short-term six-day recovery run is approaching the $0.2643 level, marked by the September 26 close, which served as key resistance in late October.
If PI successfully ends a day above this level, it could confirm a resurgent bullish trend, potentially targeting the $0.3220 as the immediate resistance, aligning with the August 1 low.
In line with the recovery run, the momentum indicators on the daily chart suggest heightened buying activity. The Moving Average Convergence Divergence (MACD) rises above the signal line, accompanied by a fresh wave of advancing green histogram bars, indicating increased bullish momentum.
Additionally, the Relative Strength Index (RSI) at 62 is moving north, with further room for growth before it hits the overbought zone.

If PI fails to hold above the 50-day EMA, it would extend the dynamic resistance's dominance. In such a case, the PI token could retrace towards the $0.2000 round figure.
Bitcoin, altcoins, stablecoins FAQs
Bitcoin is the largest cryptocurrency by market capitalization, a virtual currency designed to serve as money. This form of payment cannot be controlled by any one person, group, or entity, which eliminates the need for third-party participation during financial transactions.
Altcoins are any cryptocurrency apart from Bitcoin, but some also regard Ethereum as a non-altcoin because it is from these two cryptocurrencies that forking happens. If this is true, then Litecoin is the first altcoin, forked from the Bitcoin protocol and, therefore, an “improved” version of it.
Stablecoins are cryptocurrencies designed to have a stable price, with their value backed by a reserve of the asset it represents. To achieve this, the value of any one stablecoin is pegged to a commodity or financial instrument, such as the US Dollar (USD), with its supply regulated by an algorithm or demand. The main goal of stablecoins is to provide an on/off-ramp for investors willing to trade and invest in cryptocurrencies. Stablecoins also allow investors to store value since cryptocurrencies, in general, are subject to volatility.
Bitcoin dominance is the ratio of Bitcoin's market capitalization to the total market capitalization of all cryptocurrencies combined. It provides a clear picture of Bitcoin’s interest among investors. A high BTC dominance typically happens before and during a bull run, in which investors resort to investing in relatively stable and high market capitalization cryptocurrency like Bitcoin. A drop in BTC dominance usually means that investors are moving their capital and/or profits to altcoins in a quest for higher returns, which usually triggers an explosion of altcoin rallies.
Recommended Articles


