1INCH Price Forecast: 1INCH steadies near $0.18 as on-chain and derivatives data point to recovery

Source Fxstreet
  • 1INCH price hovers around $0.187 on Wednesday after facing rejection from the $0.207 level earlier this week.
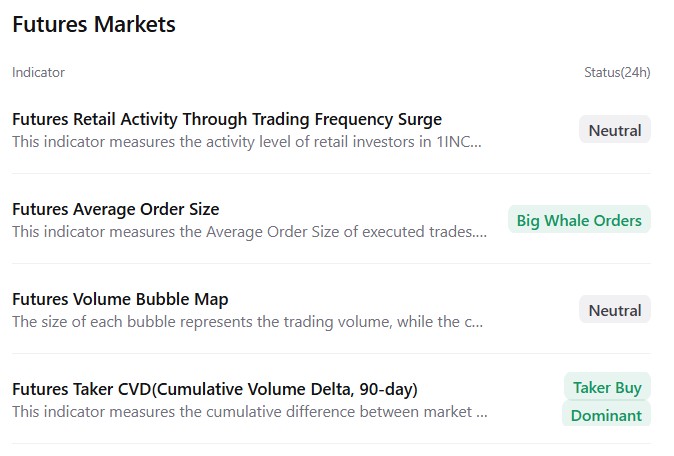
  • Rising large whale orders, buying dominance and positive funding rates suggest a recovery on the horizon. 
  • The technical indicators suggest a recovery with bulls aiming for the $0.234 mark.

1INCH (1INCH) price is stabilizing near $0.187 at the time of writing on Wednesday, after being rejected by the key resistance earlier this week. On-chain and derivatives data show improving market conditions, with rising whale activity, growing buy-side dominance and positive funding rates hinting at a possible recovery. Technical indicators further support a bullish shift, with buyers setting their sights on the $0.234 target.

1inch’s on-chain and derivatives show early signs of recovery 

CryptoQuant summary data supports a positive outlook for 1INCH as futures markets show large whale orders and buying dominance, signaling a potential rally ahead.

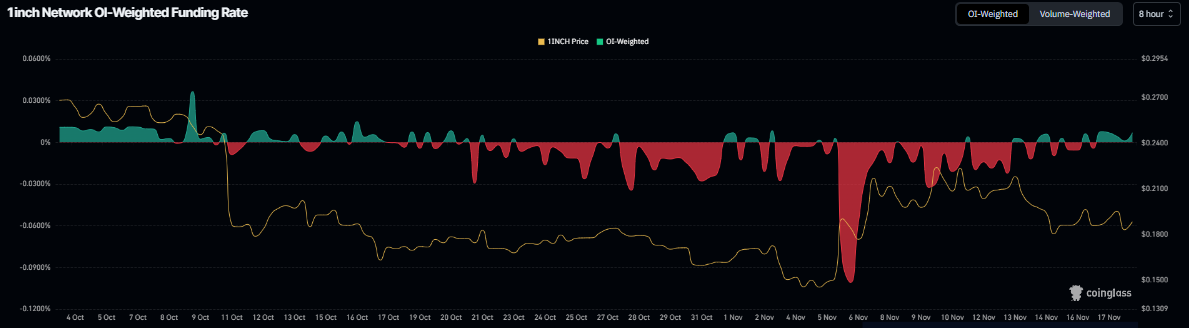
The derivatives data also support a recovery rally for 1INCH, as Coinglass’s OI-Weighted Funding Rate data shows that the number of traders betting that the price of 1INCH will slide further is lower than those anticipating a price increase.

The metric flipped to a positive rate on Monday and stood at 0.0070% on Wednesday, indicating that longs are paying shorts. Historically, as shown in the chart below, when the funding rates have flipped from negative to positive, 1INCH has rallied sharply.

1INCH funding rate chart. Source: Coinglass

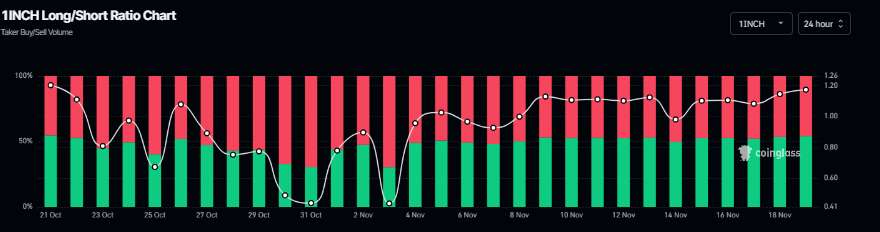
Additionally, Coinglass’s long-to-short ratio for 1INCH reads 1.17 on Wednesday, the highest level over a month. The ratio above one suggests that more traders are betting on 1INCH’s price to rally.

1INCH long-to-short ratio chart. Source: Coinglass

1INCH Price Forecast: 1INCH bulls aiming for the $0.234

1INCH price dipped slightly from the 61.8% Fibonacci retracement level at $0.207 on Monday but regained strength the following day. At the time of writing on Wednesday, it hovers at around $0.187. 

If 1INCH continues its recovery and closes above $0.207 on a daily basis, it could extend its recovery toward the next daily resistance at $0.234.

The Relative Strength Index (RSI) on the daily chart is hovering around the neutral 50 level, suggesting indecision among traders. For the recovery rally to be successful, the RSI must move above the neutral level. Moreover, the Moving Average Convergence Divergence (MACD) lines are converging, signaling indecision in momentum. For the rally to sustain, the MACD would need to confirm a bullish crossover.

1INCH/USDT daily chart 

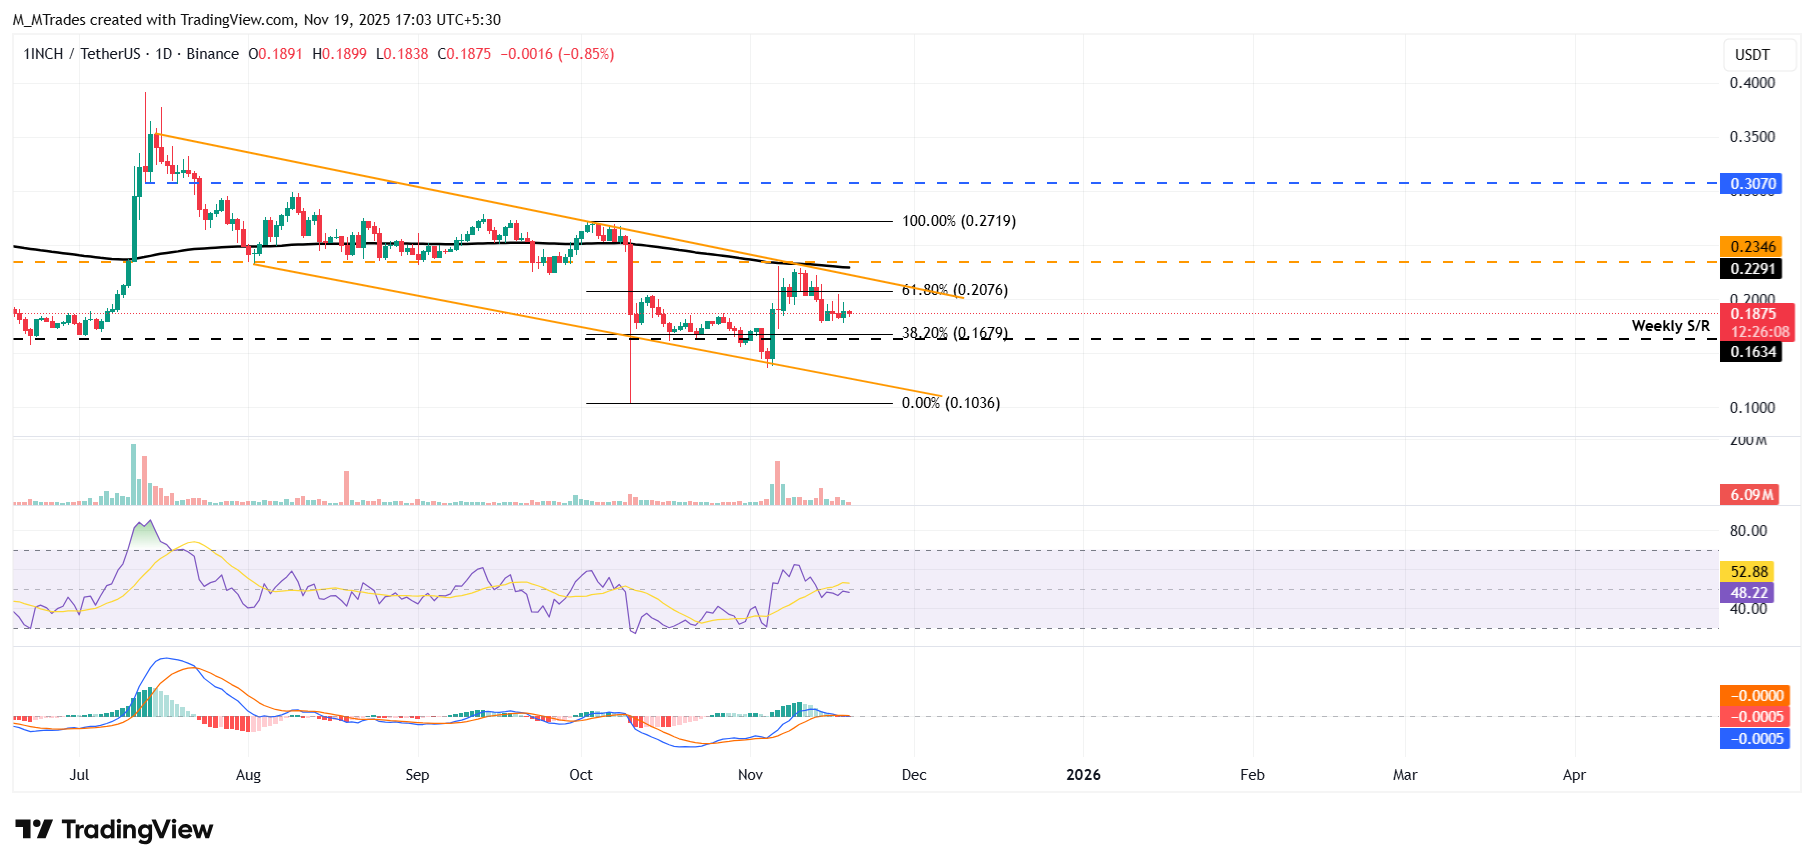
On the other hand, if 1INCH faces a correction, it could extend the decline toward the next weekly support at $0.163.

Disclaimer: For information purposes only. Past performance is not indicative of future results.
placeholder
Bitcoin slides deeper into red as bears lean on $96,600 wall and eye $90,000Bitcoin extends its decline after failing to reclaim $96,500, trading below $95,000, the 100-hour SMA and a bearish trend line near $96,600; unless bulls can force a decisive close back above $96,600–$97,200, the short-term path of least resistance stays lower, with $92,500, $90,000 and the main $88,500 support zone in focus.
Author  Mitrade
Nov 17, Mon
Bitcoin extends its decline after failing to reclaim $96,500, trading below $95,000, the 100-hour SMA and a bearish trend line near $96,600; unless bulls can force a decisive close back above $96,600–$97,200, the short-term path of least resistance stays lower, with $92,500, $90,000 and the main $88,500 support zone in focus.
placeholder
Gold Price Forecast: XAU/USD declines below $4,050 on USD strength and hawkish Fed comments Gold price (XAU/USD) extends the decline to around $4,030 during the early Asian session on Tuesday. The precious metal edges lower as traders dialed back expectations of a US interest rate cut next month.
Author  FXStreet
Yesterday 01: 23
Gold price (XAU/USD) extends the decline to around $4,030 during the early Asian session on Tuesday. The precious metal edges lower as traders dialed back expectations of a US interest rate cut next month.
placeholder
Ethereum Edges Toward Long-Term Holders’ Cost Basis, Now Only 8% Above Key Accumulation LevelEthereum is trading near $3,150 and just 8% above a key $2,895 long-term holders’ cost basis, with on-chain flows, macro uncertainty and support around $3,000–$2,800 all shaping what comes next for ETH.
Author  Mitrade
Yesterday 02: 28
Ethereum is trading near $3,150 and just 8% above a key $2,895 long-term holders’ cost basis, with on-chain flows, macro uncertainty and support around $3,000–$2,800 all shaping what comes next for ETH.
placeholder
Ethereum Dips Below $3,000: Is the Bull Market at an End?Ethereum's price plunged below $3,000 for the first time in four months, marking growing concerns of a potential end to the bull market.
Author  Mitrade
Yesterday 03: 34
Ethereum's price plunged below $3,000 for the first time in four months, marking growing concerns of a potential end to the bull market.
placeholder
Top 3 Price Prediction: Bitcoin, Ethereum, Ripple – BTC, ETH and XRP Look for a Foothold After a Sharp ShakeoutBitcoin trades near $92,600 after a dip below $90,000, while Ethereum around $3,118 and XRP near $2.21–$2.23 sit on key support zones, as BTC, ETH and XRP all try to turn a sharp correction into a tradable rebound rather than a deeper slide.
Author  Mitrade
7 hours ago
Bitcoin trades near $92,600 after a dip below $90,000, while Ethereum around $3,118 and XRP near $2.21–$2.23 sit on key support zones, as BTC, ETH and XRP all try to turn a sharp correction into a tradable rebound rather than a deeper slide.
goTop
quote