

The 65-Month Clock Is Ticking: Why Bitcoin May Drop 20% While Silver Shines
As risk assets enter a sensitive phase, many analysts are closely monitoring the 65 Month Liquidity Cycle. This model is believed to have accurately forecasted market peaks and troughs for over two decades.
Are we approaching a new tightening phase where Bitcoin faces 20% downward pressure, while Silver emerges as an alternative haven?
65 Month Liquidity Cycle: Global Liquidity Map Enters Final Stage
In the latest chart from CrossBorder Capital, the black line represents the Global Liquidity Index (GLI). It is currently rising sharply, approaching the red peak area. Its movement resembles the late phases of the 2016-2021 cycle. This strongly suggests we are entering the vibrant late upswing phase of the liquidity cycle. During this period, asset valuations are soaring well beyond their intrinsic worth.
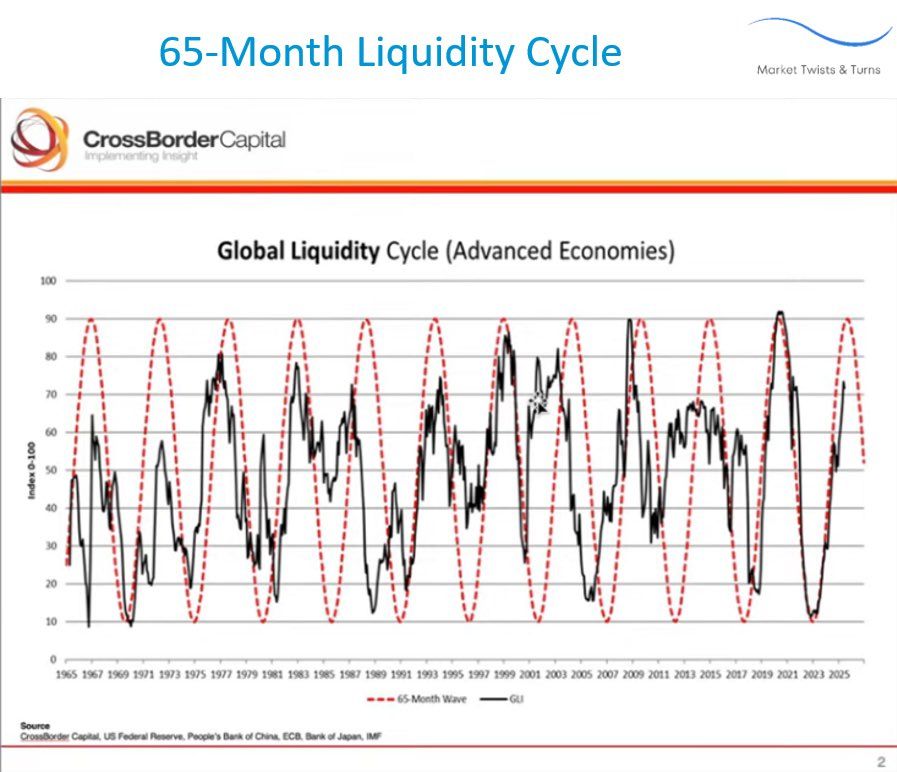 65 Month Liquidity Cycle. Source: X
This is an average 5.5-year cycle, first identified through Fourier analysis in 1999. Each cycle follows a familiar pattern: capital is injected strongly in the early phase, peaks when monetary policy is extremely loose, and then reverses as credit and liquidity tighten.
Based on the slopes of previous cycles, the next liquidity peak is expected to appear in Q1 or Q2 2026, roughly between March and June, just a few months away. This suggests we are nearing an “overheat” phase, when capital flow slows and adjustment risks rise.
If this assumption holds, risk assets—from tech stocks to crypto—will soon enter a “re-pricing” period. This is when smart money begins to reduce exposure to highly leveraged positions, potentially leading to a 15-20% correction in Bitcoin before the new cycle bottom forms.
Although the chart and overall analysis are compelling, as one analyst on X points out, the cycle timing on the chart is often off by several years. This means we cannot know for certain whether the market has peaked, will accelerate, remain flat, or do nothing.
“I like the chart and the overall analysis, but the timing of the cycle is on average off by years in this chart. So, you don’t know whether it has peaked, whether it will accelerate, or do nothing, based on the chart. It is a coinflip,” the analyst noted.
Bitcoin Drops, Silver Rises: Safe Money Rotation Signals
An interesting trend in 2025 is the divergence between Bitcoin (BTC) and Silver. According to charts from 2021 to 2025, Bitcoin has fallen roughly 15-20%, from $109,000 to $82,000. At the same time, Silver rose 13%, from $29 to $33. This reflects a clear shift in capital flows. As global liquidity tightens, investors gradually exit high-risk assets, such as cryptocurrencies, and rotate toward “collateral-backed” assets, including precious metals.
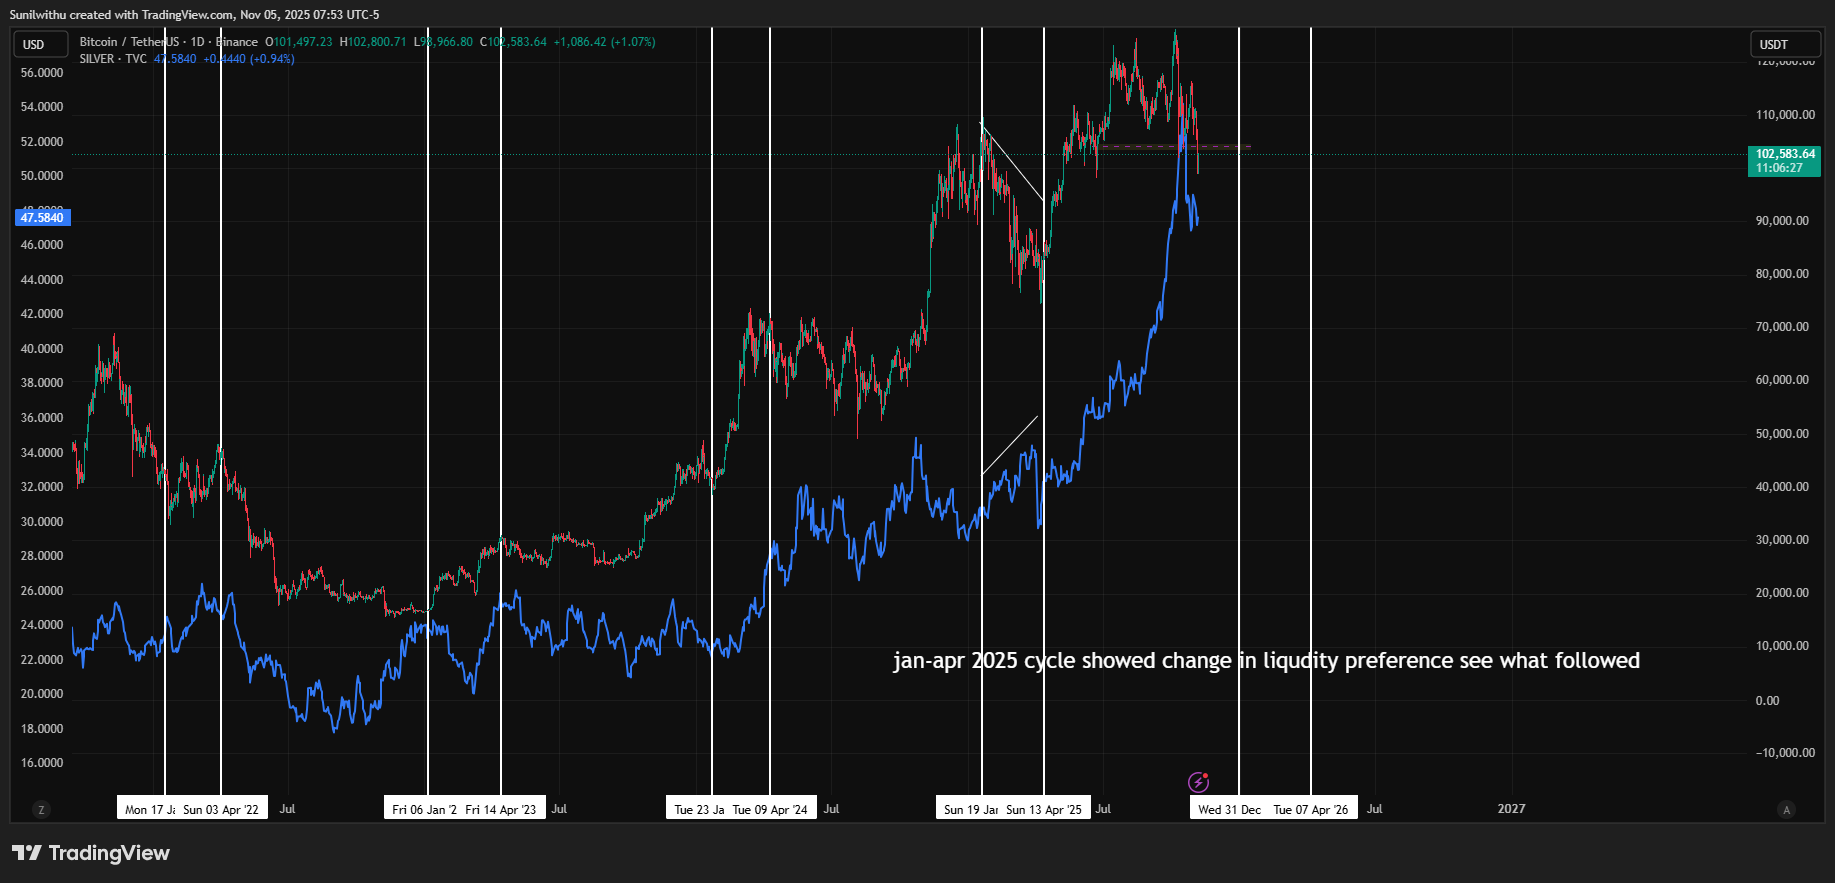 Bitcoin vs Silver divergence. Source: X
This divergence suggests that Bitcoin serves as a risk-on indicator, benefiting directly from liquidity expansion. At the same time, Silver exhibits dual characteristics of a commodity and a safe-haven asset, making it more attractive when inflation remains high but economic growth slows.
Based on stagflation signals and historical trends of the liquidity cycle, many experts predict Silver may outperform Bitcoin during January-April 2026. However, year-end 2025 rallies in both assets suggest that this shift will not occur abruptly but will be moderated by market sentiment and macro events.
“As we move into January-April 2026, we may see this trend accelerate. Bitcoin may only recover moderately, while Silver rises sharply, deepening the rotation toward tangible collateral assets,” the analyst noted.
2026: A Pivot Year for the Cycle – Bitcoin Rebounds or Silver Continues to Lead?
Although a 20% drop in Bitcoin sounds bearish, it does not necessarily mark the end of the bullish cycle. In most late liquidity cycle phases, the market typically experiences a sharp correction before entering the final upswing, known as the “liquidity echo rally.” If this scenario repeats, Bitcoin may undergo a technical dip before rebounding strongly in the second half of 2026.
Meanwhile, Silver, benefiting from industrial demand and hedging flows, may sustain short-term gains. However, when global liquidity expands again in 2027, speculative capital may shift away from precious metals toward cryptocurrencies and equities in search of higher returns.
In summary, the 65 Month Liquidity Cycle is entering a critical phase. Bitcoin is likely to experience a temporary correction, while Silver continues to play the market’s “steady hand.” For long-term investors, this may not be a signal to exit, but rather an opportunity to reposition portfolios ahead of the next liquidity wave in 2026-2027.
Recommended Articles


