

XRP Price Forecast: XRP erases recent gains as crypto market pullback extends
- XRP extends its correction below $2.18 support amid a sell-off gripping crypto majors.
- XRP faces increasing downside risks amid neutral retail activity.
- Whale-to-exchange transactions cool down in November after a significant spike in October.
Ripple (XRP) edges lower, trading below $2.18 at the time of writing on Friday. The sell-off has affected most major cryptocurrencies, including Bitcoin (BTC), which hovers above $100,000 and Ethereum (ETH), trading below $3,250.
Several attempts to sustain price recovery have failed, resulting in losses. The sticky risk-off sentiment can be attributed to macroeconomic uncertainty amid the extended United States (US) government shutdown, low retail activity and a lack of significant price catalysts within the ecosystem, among other factors.
XRP retail activity slows as sellers tighten grip
XRP retail activity remains in the neutral zone following the October 10 aggressive sell-off, which resulted in the largest single-day liquidation event in the crypto market. At least $19 billion was wiped out, leaving traders counting losses and investors demoralised.
The Neutral zone, as observed in CryptoQuant’s chart below, indicates that retail investors have retreated to the sidelines until sentiment in the broader cryptocurrency market improves. Conversely, neutral conditions also suggest that XRP is approaching a potential bottom, with buy-the-dip opportunities emerging.
-1762528075569-1762528075570.png)
Meanwhile, whale-to-exchange (Binance) transactions have significantly declined over the past week, following several spikes in October. Roughly 800 transactions of this nature have been recorded on Friday, down from approximately 49,000 on October 25 and 44,000 on October 11.
Investors transfer their assets to exchanges intending to trade or sell. Hence, spikes in whale-to-exchange transactions often precede heightened volatility. Fewer whales sending XRP to exchanges decreases potential selling pressure, which could pave the way for a steady recovery.
Technical outlook: XRP bears tighten their grip
XRP has given back intraday gains after topping out at $2.23 on Friday, resulting in an extended drawdown below $2.18. The daily chart shows that sellers have the upper hand, particularly with the Relative Strength Index (RSI) falling to 35, from 42 on Wednesday.
Investors will likely remain bearish heading into the weekend, citing a sell signal from the Moving Average Convergence Divergence (MACD) indicator since Tuesday. Sentiment may remain bearish as long as the blue line holds below the red signal line and the indicator continues to edge lower.
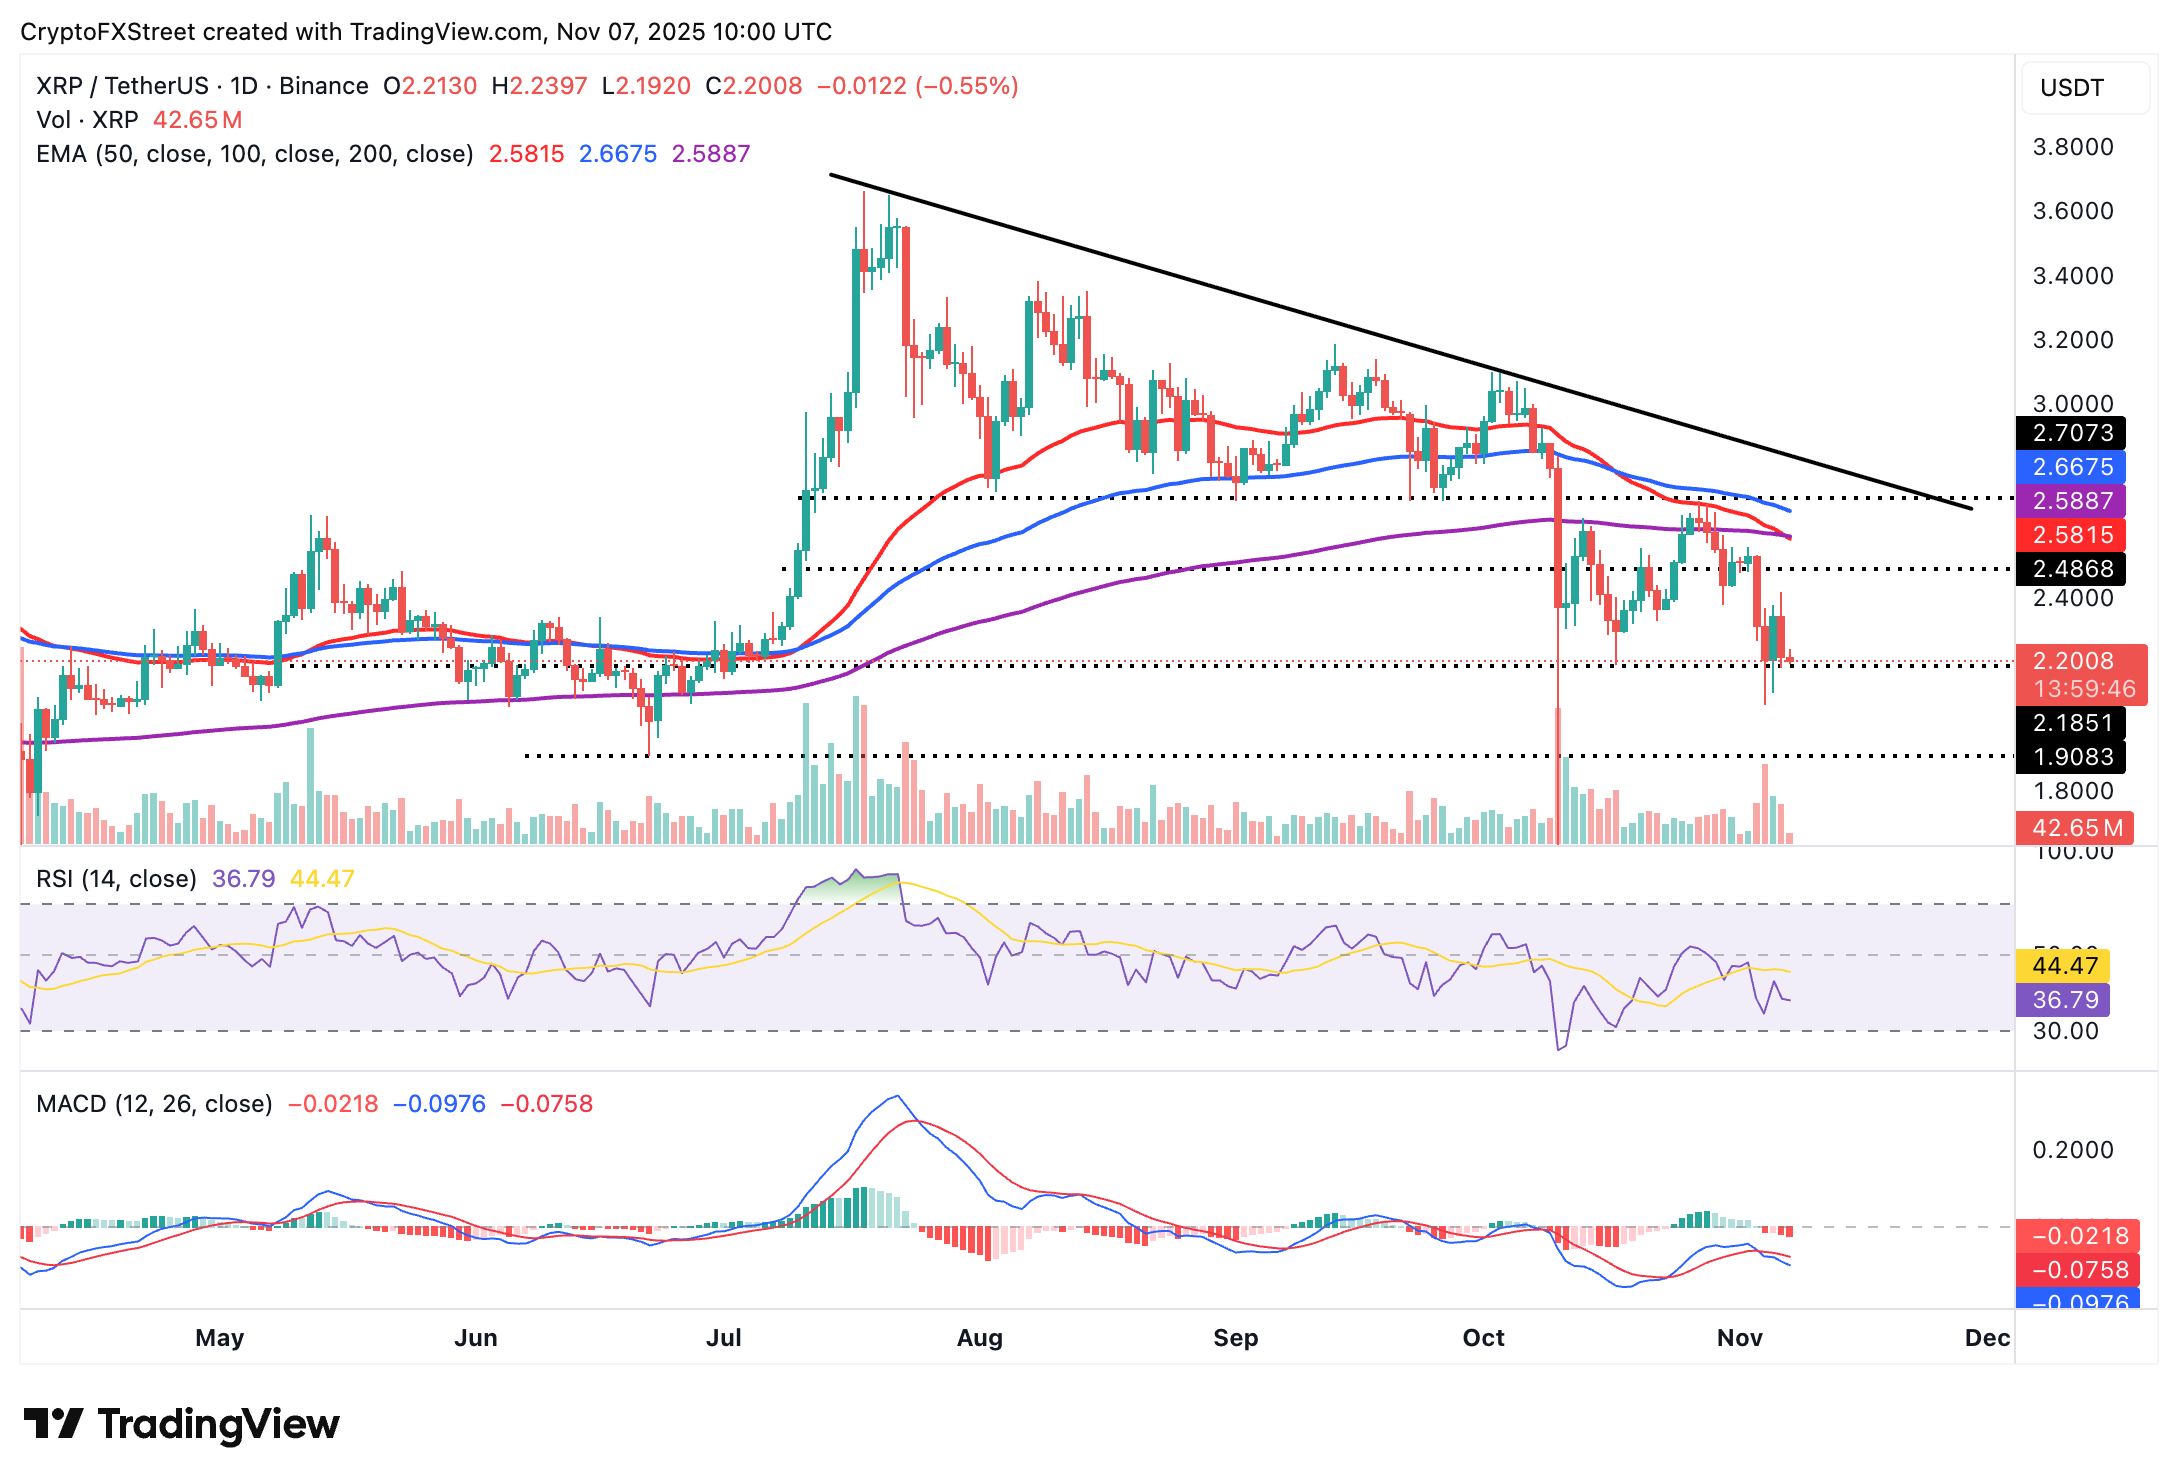
A Death Cross is a bearish pattern, which occurs when a shorter-term moving average crosses below a longer-term one. From the daily chart above, the 50-day EMA at $2.58 is on the verge of crossing below the 200-day EMA, bolstering the bearish outlook.
Still, if bulls seek exposure by buying the dip, XRP could resume its uptrend, targeting highs above the confluence of the 200-day and 50-day EMAs at $2.58.
Cryptocurrency metrics FAQs
The developer or creator of each cryptocurrency decides on the total number of tokens that can be minted or issued. Only a certain number of these assets can be minted by mining, staking or other mechanisms. This is defined by the algorithm of the underlying blockchain technology. On the other hand, circulating supply can also be decreased via actions such as burning tokens, or mistakenly sending assets to addresses of other incompatible blockchains.
Market capitalization is the result of multiplying the circulating supply of a certain asset by the asset’s current market value.
Trading volume refers to the total number of tokens for a specific asset that has been transacted or exchanged between buyers and sellers within set trading hours, for example, 24 hours. It is used to gauge market sentiment, this metric combines all volumes on centralized exchanges and decentralized exchanges. Increasing trading volume often denotes the demand for a certain asset as more people are buying and selling the cryptocurrency.
Funding rates are a concept designed to encourage traders to take positions and ensure perpetual contract prices match spot markets. It defines a mechanism by exchanges to ensure that future prices and index prices periodic payments regularly converge. When the funding rate is positive, the price of the perpetual contract is higher than the mark price. This means traders who are bullish and have opened long positions pay traders who are in short positions. On the other hand, a negative funding rate means perpetual prices are below the mark price, and hence traders with short positions pay traders who have opened long positions.
Recommended Articles


