

GBP/USD hovers around 1.3150 as US shutdown dampens households’ sentiment
- GBP/USD rises 0.10% after rebounding from session lows amid cautious Fed tone and US data lull.
- Fed Vice-Chair Jefferson says rate cuts should proceed slowly as policy nears neutral amid shutdown data gaps.
- US consumer sentiment drops to 50.3; White House warns GDP could shrink up to 1.5%.
GBP/USD clings to minimal gains on Friday amid the lack of economic data releases in the UK and as markets digest scarce economic data as the US government shutdown continues. The pair trades at 1.3148, up 0.10% after hitting a daily low of 1.3094.
Sterling edges higher as Dollar steadies; weak US sentiment data and Fed comments cap market optimism
The Greenback has recovered some ground during the week, yet it remains poised to end with losses of 0.27%, according to the US Dollar Index (DXY), which measures the buck’s value against a basket of six currencies. The DXY is at 99.45 after hitting a six-month high at 100.36.
Federal Reserve officials crossed the wires on Friday. The Vice-Chair Philip Jeffferson said that “The Fed should proceed slowly with further rate cuts as policy approaches the neutral rate.” He commented that his approach would be meeting by meeting and cited “a potential lack of government data due to the shutdown.”
Recently, the University of Michigan revealed that Consumer Sentiment in November, plunged to 50.3 from 53.6 in October. The survey noted that “With the federal government shutdown dragging on for over a month, consumers are now expressing worries about potential negative consequences for the economy. “
Inflation expectations for one-year period rose to 4.7% from 4.6% and for a five-year period dipped from 3.9% to 3.6%.
The White House Economic Adviser Kevin Hassett told CNN that the shutdown is hurting the economy, more than they expected, anticipating a reduction of 1 to 1.5% in GDP growth this quarter.
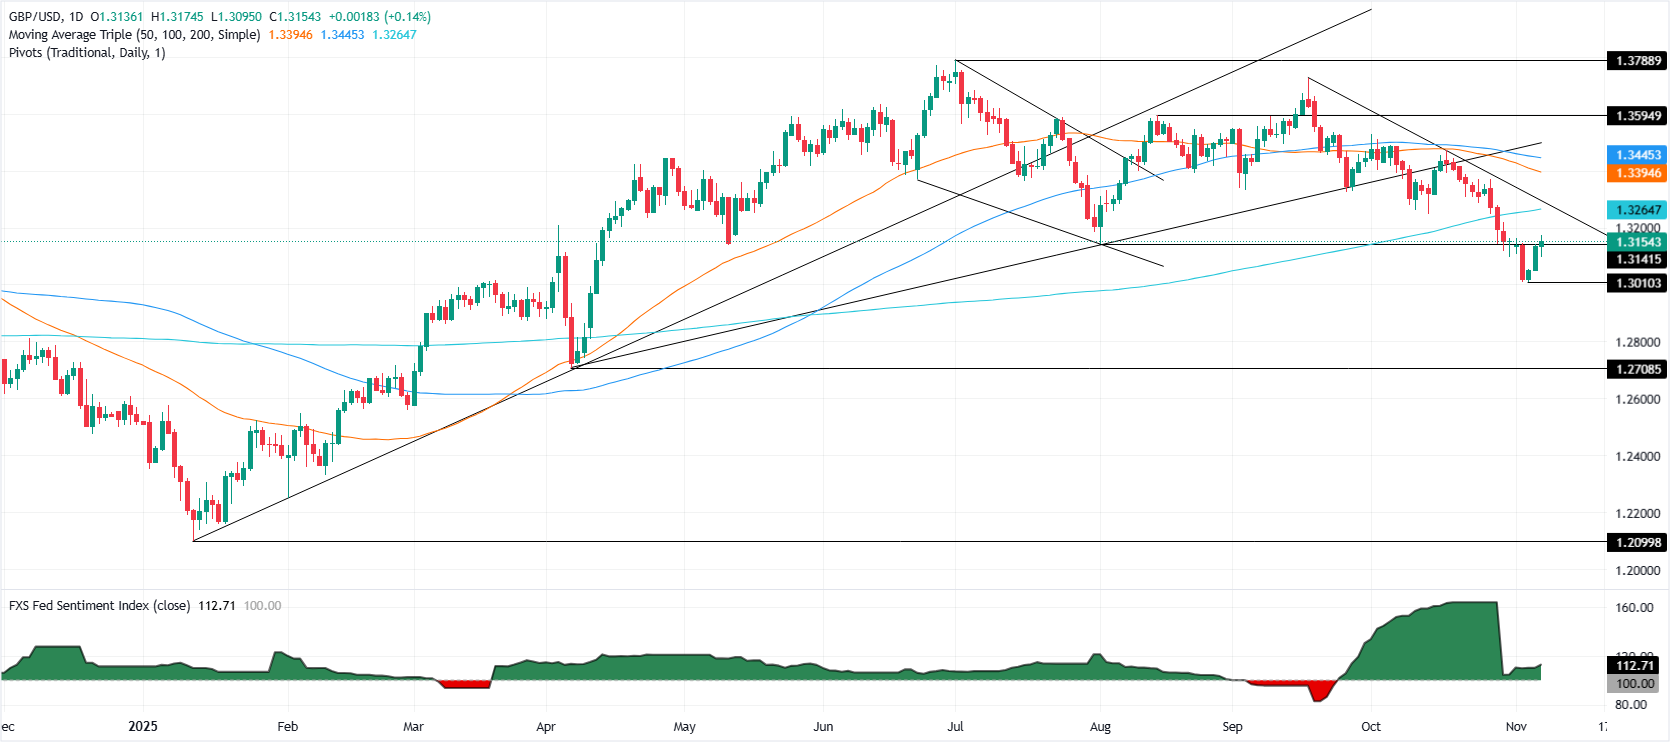
GBP/USD Price Forecast: Technical outlook
GBP/USD technical picture, points to a slight recovery but the downtrend is intact after the pair tumbled below the 200-day Simple Moving Average (SMA) of 1.3261. Bullish momentum picked up shows the RSI, but buyers must clear 1.3200 and reclaim the 200-day SMA, if they would like to take the control back. Conversely, further weakness clears the path to test the current week’s low of 1.3020 ahead of the 1.3000 mark.
Pound Sterling Price This week
The table below shows the percentage change of British Pound (GBP) against listed major currencies this week. British Pound was the strongest against the New Zealand Dollar.
| USD | EUR | GBP | JPY | CAD | AUD | NZD | CHF | |
|---|---|---|---|---|---|---|---|---|
| USD | -0.39% | -0.16% | -0.57% | 0.42% | 1.14% | 2.06% | -0.03% | |
| EUR | 0.39% | 0.23% | -0.12% | 0.81% | 1.52% | 2.46% | 0.36% | |
| GBP | 0.16% | -0.23% | -0.52% | 0.58% | 1.29% | 2.22% | 0.13% | |
| JPY | 0.57% | 0.12% | 0.52% | 0.97% | 1.71% | 2.64% | 0.68% | |
| CAD | -0.42% | -0.81% | -0.58% | -0.97% | 0.65% | 1.61% | -0.44% | |
| AUD | -1.14% | -1.52% | -1.29% | -1.71% | -0.65% | 0.92% | -1.14% | |
| NZD | -2.06% | -2.46% | -2.22% | -2.64% | -1.61% | -0.92% | -2.05% | |
| CHF | 0.03% | -0.36% | -0.13% | -0.68% | 0.44% | 1.14% | 2.05% |
The heat map shows percentage changes of major currencies against each other. The base currency is picked from the left column, while the quote currency is picked from the top row. For example, if you pick the British Pound from the left column and move along the horizontal line to the US Dollar, the percentage change displayed in the box will represent GBP (base)/USD (quote).
Recommended Articles


