

One Painful Dip Before Next Bitcoin Price Rally? Here’s What Charts Show
Bitcoin’s November start has once again disappointed traders. The price has dropped 2.4% in the past 24 hours and is down 6.2% over the past week.
While the market has been stuck in a pattern of short rebounds and deeper pullbacks, on-chain data now points to another dip, possibly significant, before the next rally phase begins.
NUPL Suggests the Market Bottom Isn’t Fully In
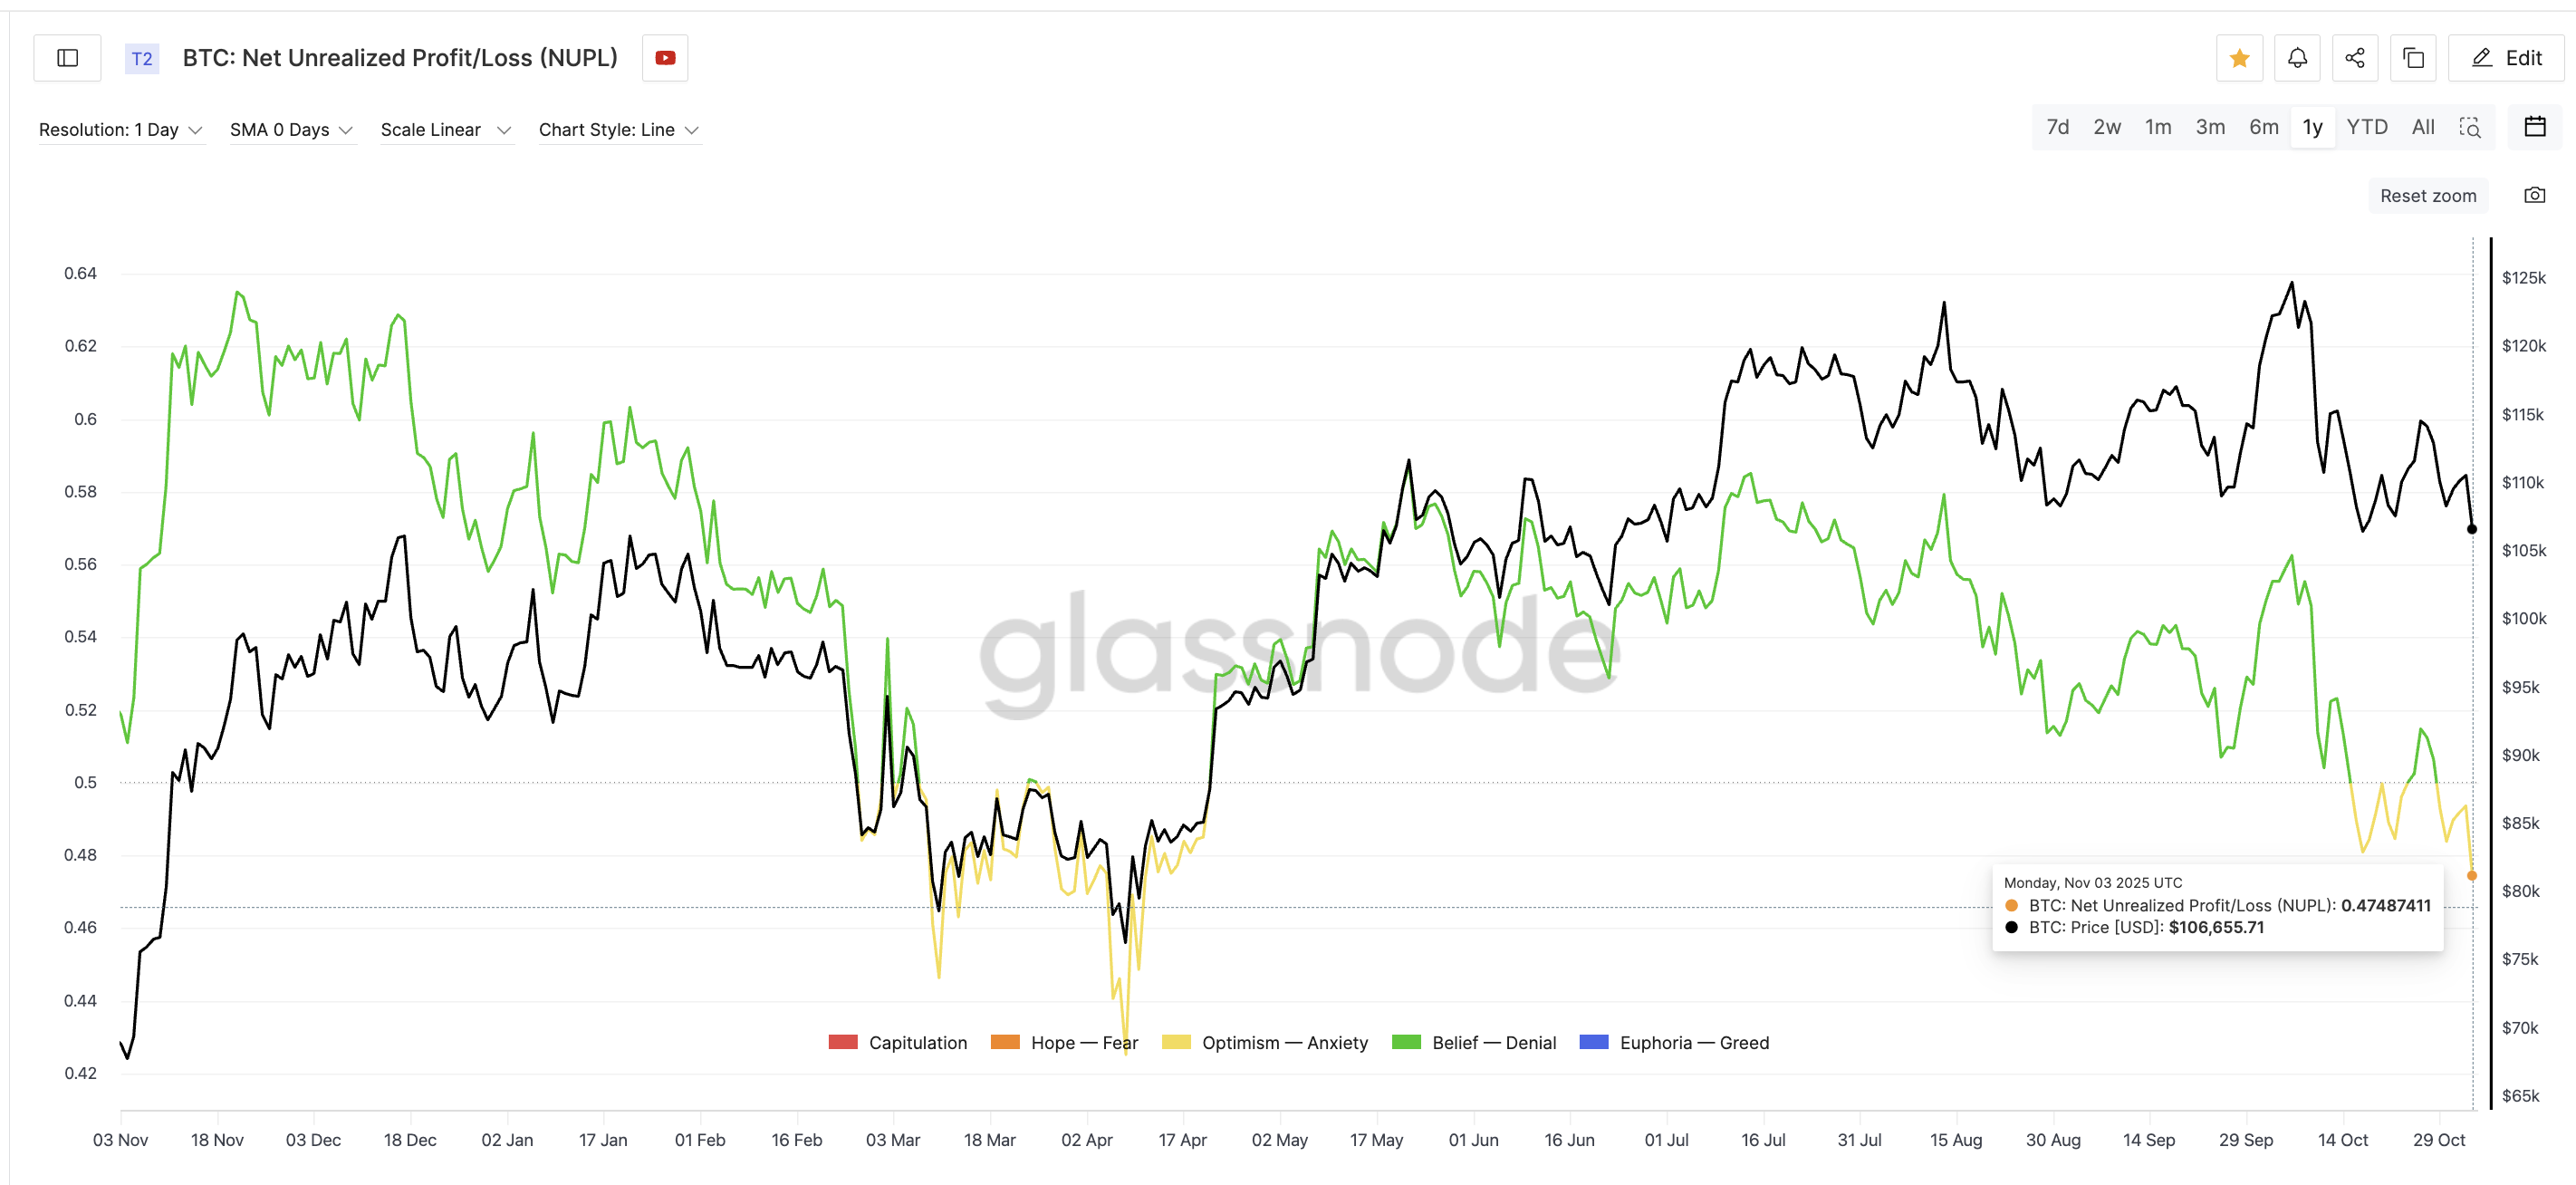
The Net Unrealized Profit/Loss (NUPL) metric shows how much profit or loss Bitcoin investors are holding. When NUPL values drop sharply, it signals that holders are losing incentives to sell — often setting up the next bottom.
Currently, Bitcoin’s NUPL sits at 0.47, the lowest level since April 8, when it fell to 0.42. During that earlier cycle, Bitcoin’s NUPL declined in three stages — 0.48 on February 26, 0.44 on March 10, and 0.42 on April 8 — before Bitcoin rallied from $76,000 to above $125,000.
 Bitcoin NUPL Needs To Drop Lower: Glassnode
Want more token insights like this? Sign up for Editor Harsh Notariya’s Daily Crypto Newsletter here.
This time, the metric started falling in late October. And the current reading matches the first stage of that earlier drop, the level on February 26. If this structure repeats, the next leg lower — toward 0.42–0.44 — could occur by early to mid-December, marking the next accumulation phase before a recovery takes hold.
As NUPL drop involves shaking out the weak hands, it might be followed by a steady BTC price drop. And that looks likely, now!
Bearish Crossover Could Be the Trigger — and It’s Happening Now
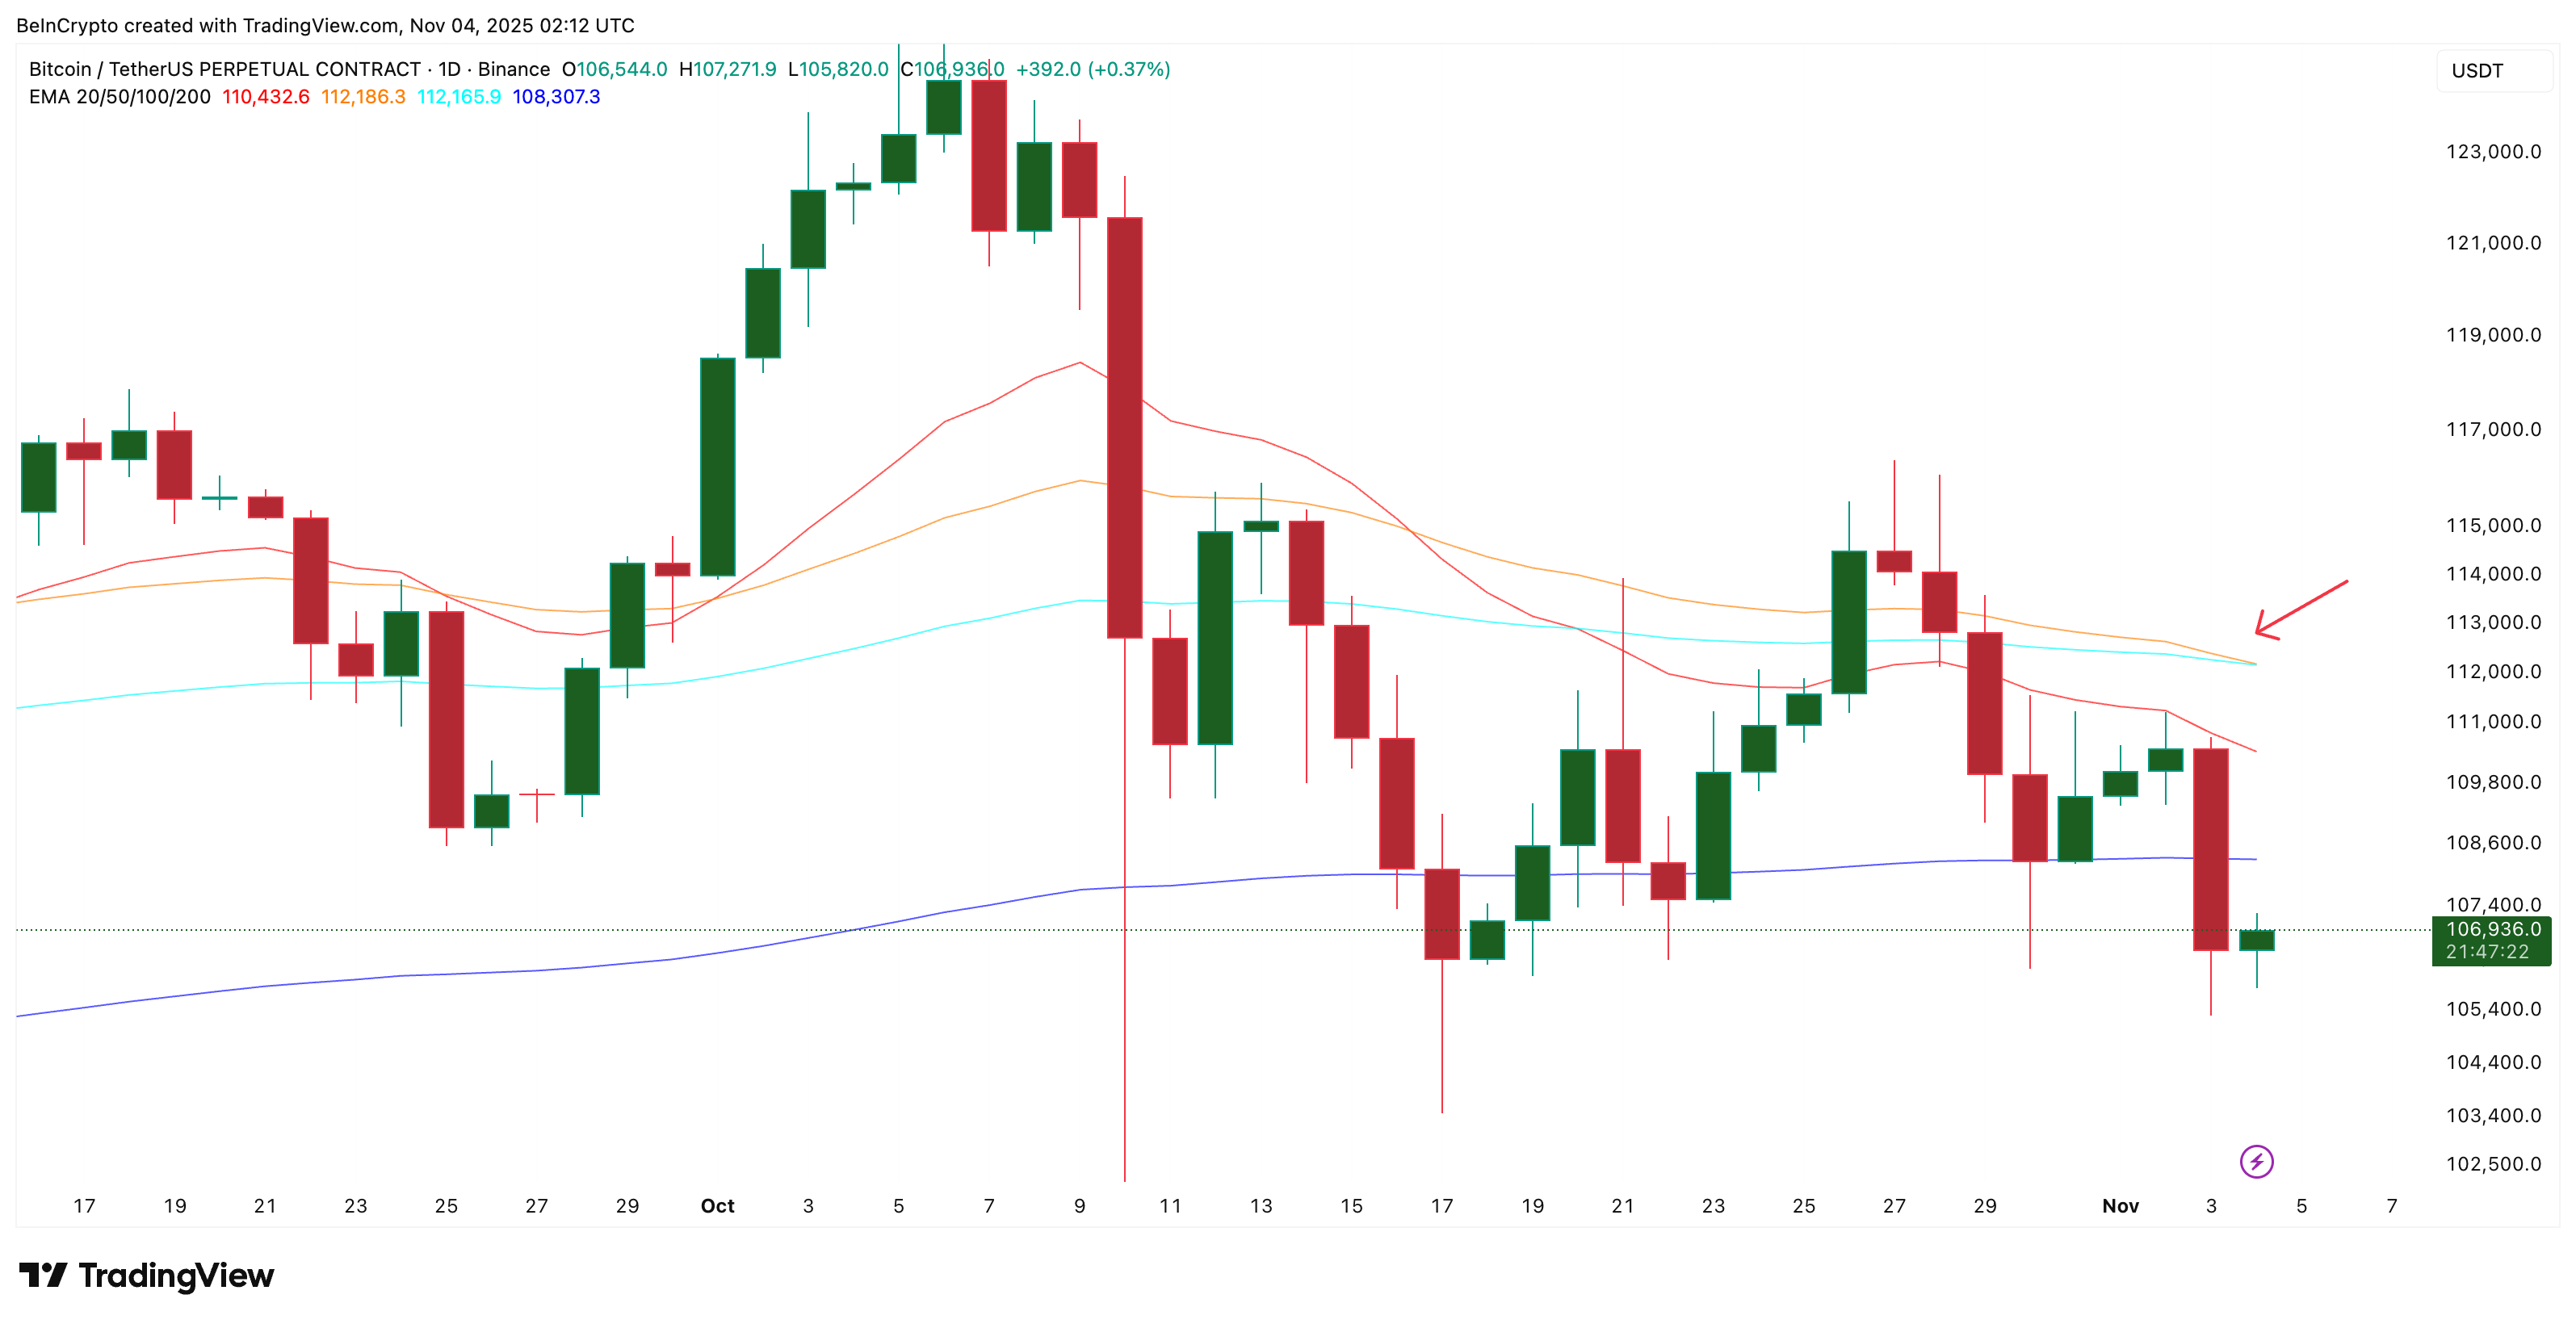
A “bearish crossover” happens when a short-term exponential moving average or EMA (like the 50-day) crosses below a long-term one (like the 100-day). On Bitcoin’s daily chart, this crossover is forming right now — and it’s critical.
The Exponential Moving Average (EMA) is a short-term trend indicator that tracks price changes by giving more weight to recent movements. It helps identify whether buyers or sellers currently control the market.
From a buyer-seller perspective, this indicates that short-term sellers are gaining the upper hand over longer-term holders. It reflects a shift in control: traders who bought recently are exiting, while longer-term investors are hesitant to buy until clear strength returns.
 Bitcoin’s Next Dip Trigger: TradingView
This setup often sparks panic-driven selloffs, forcing weaker hands out of the market before a fresh accumulation phase begins. If the 50-day EMA fully crosses below the 100-day and prices fail to recover quickly, that could accelerate a short, intense shakeout that pushes NUPL to its final base range (0.42–0.44).
Key Bitcoin Price Levels To Watch
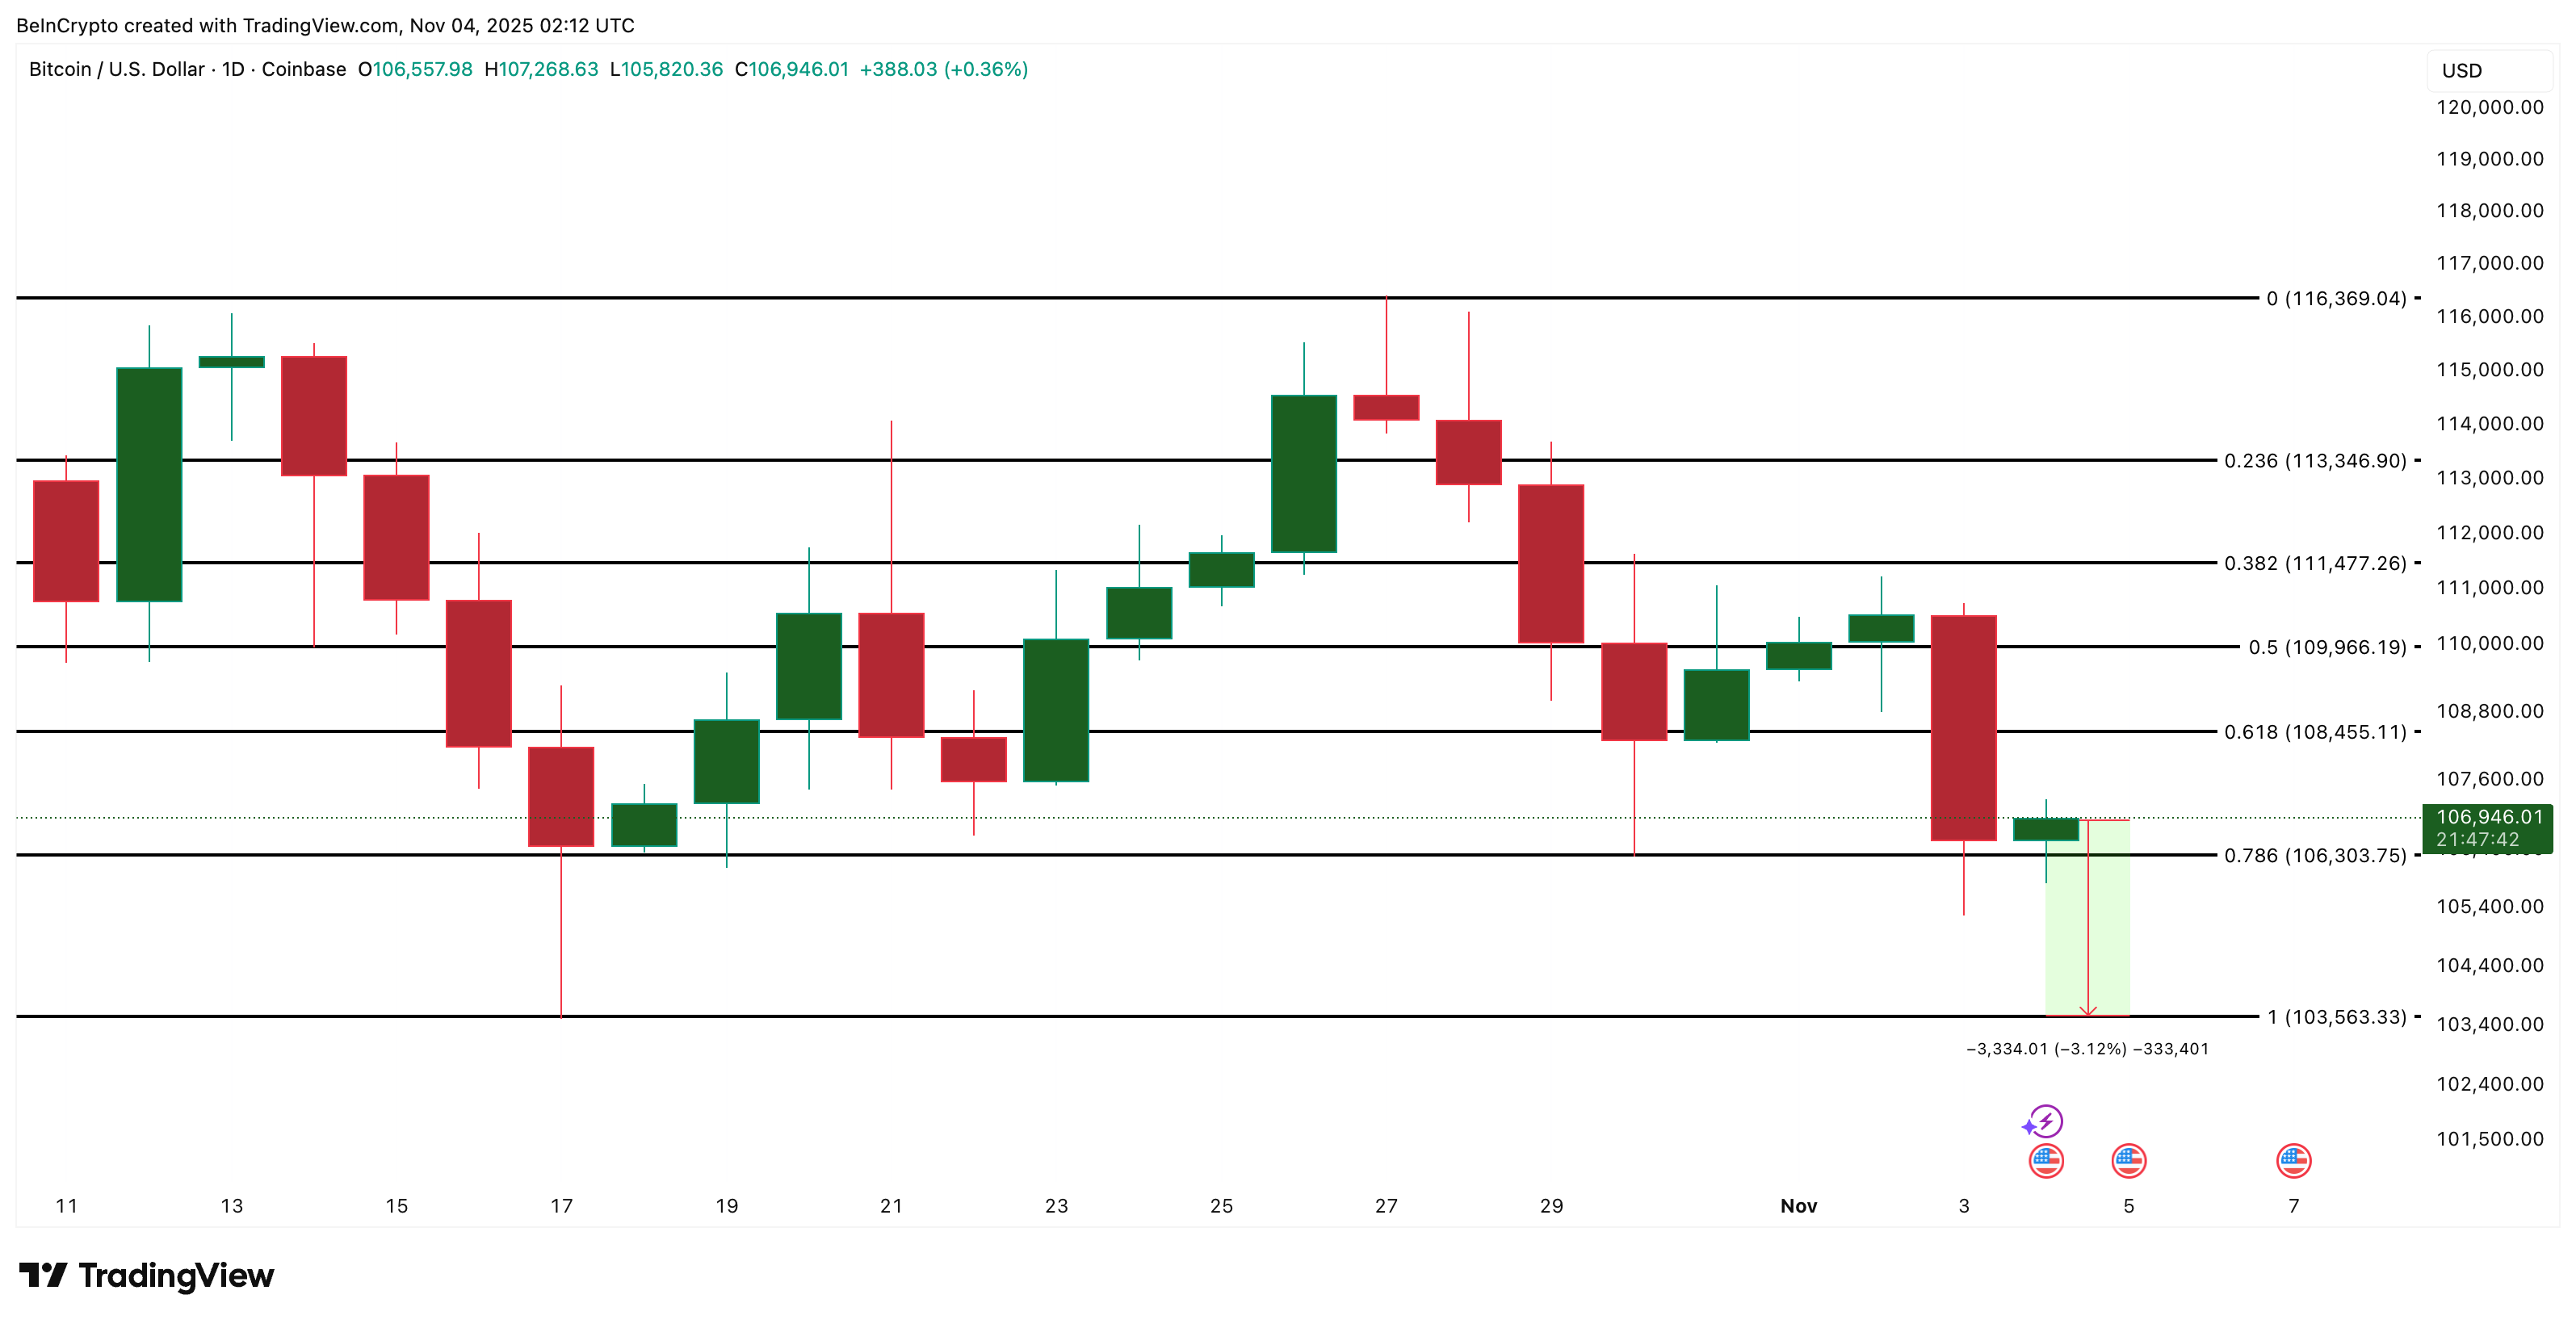
Bitcoin is currently hovering near $106,900, just above the 0.786 Fibonacci retracement at $106,300. This level acted as short-term support in October. If that level breaks, the next target sits near $103,500. That would result in a roughly 3%–4% drop and would then lower the NUPL. If that level breaks, the BTC price might head lower.
 Bitcoin Price Analysis: TradingView
However, a strong daily close above $111,400 would flip the short-term structure bullish again. That level has acted as resistance since October 30. Breaking above it would invalidate the bearish crossover’s effect and open a path toward the $113,300 zone. However, such a significant Bitcoin price upmove would also invalidate the NUPL-based bottoming theory, at least for now.
Recommended Articles


