


Pi Coin Could See a Comeback Opportunity Amid The Market Crash – Here’s How
The market crash triggered by renewed US–China tariff tensions sent most altcoins sharply lower. Yet Pi Coin (PI) held its ground better than expected. Despite losing nearly 23% over the past week (part of it happening during the crash), the Pi Coin price managed to stay above the $0.15 support, showing resilience at a time when most tokens broke lower.
Since October 7, Pi has steadily recovered and now trades close to $0.20, hinting that buyer confidence may be quietly returning. A closer look at both the chart and on-chain behavior suggests that Pi could be gearing up for a rebound, provided selling pressure keeps cooling off.
Shrinking Sell Volume and Money Flow Show Buyers Are Returning
On the daily chart, the volume spread pattern—often studied in Wyckoff-style analysis—helps identify shifts in buying and selling strength.
During the tariff-driven crash, a red bar dominated the chart, signaling full control by Pi Coin sellers. But that bar has now turned yellow, meaning sellers remain active but with less intensity.
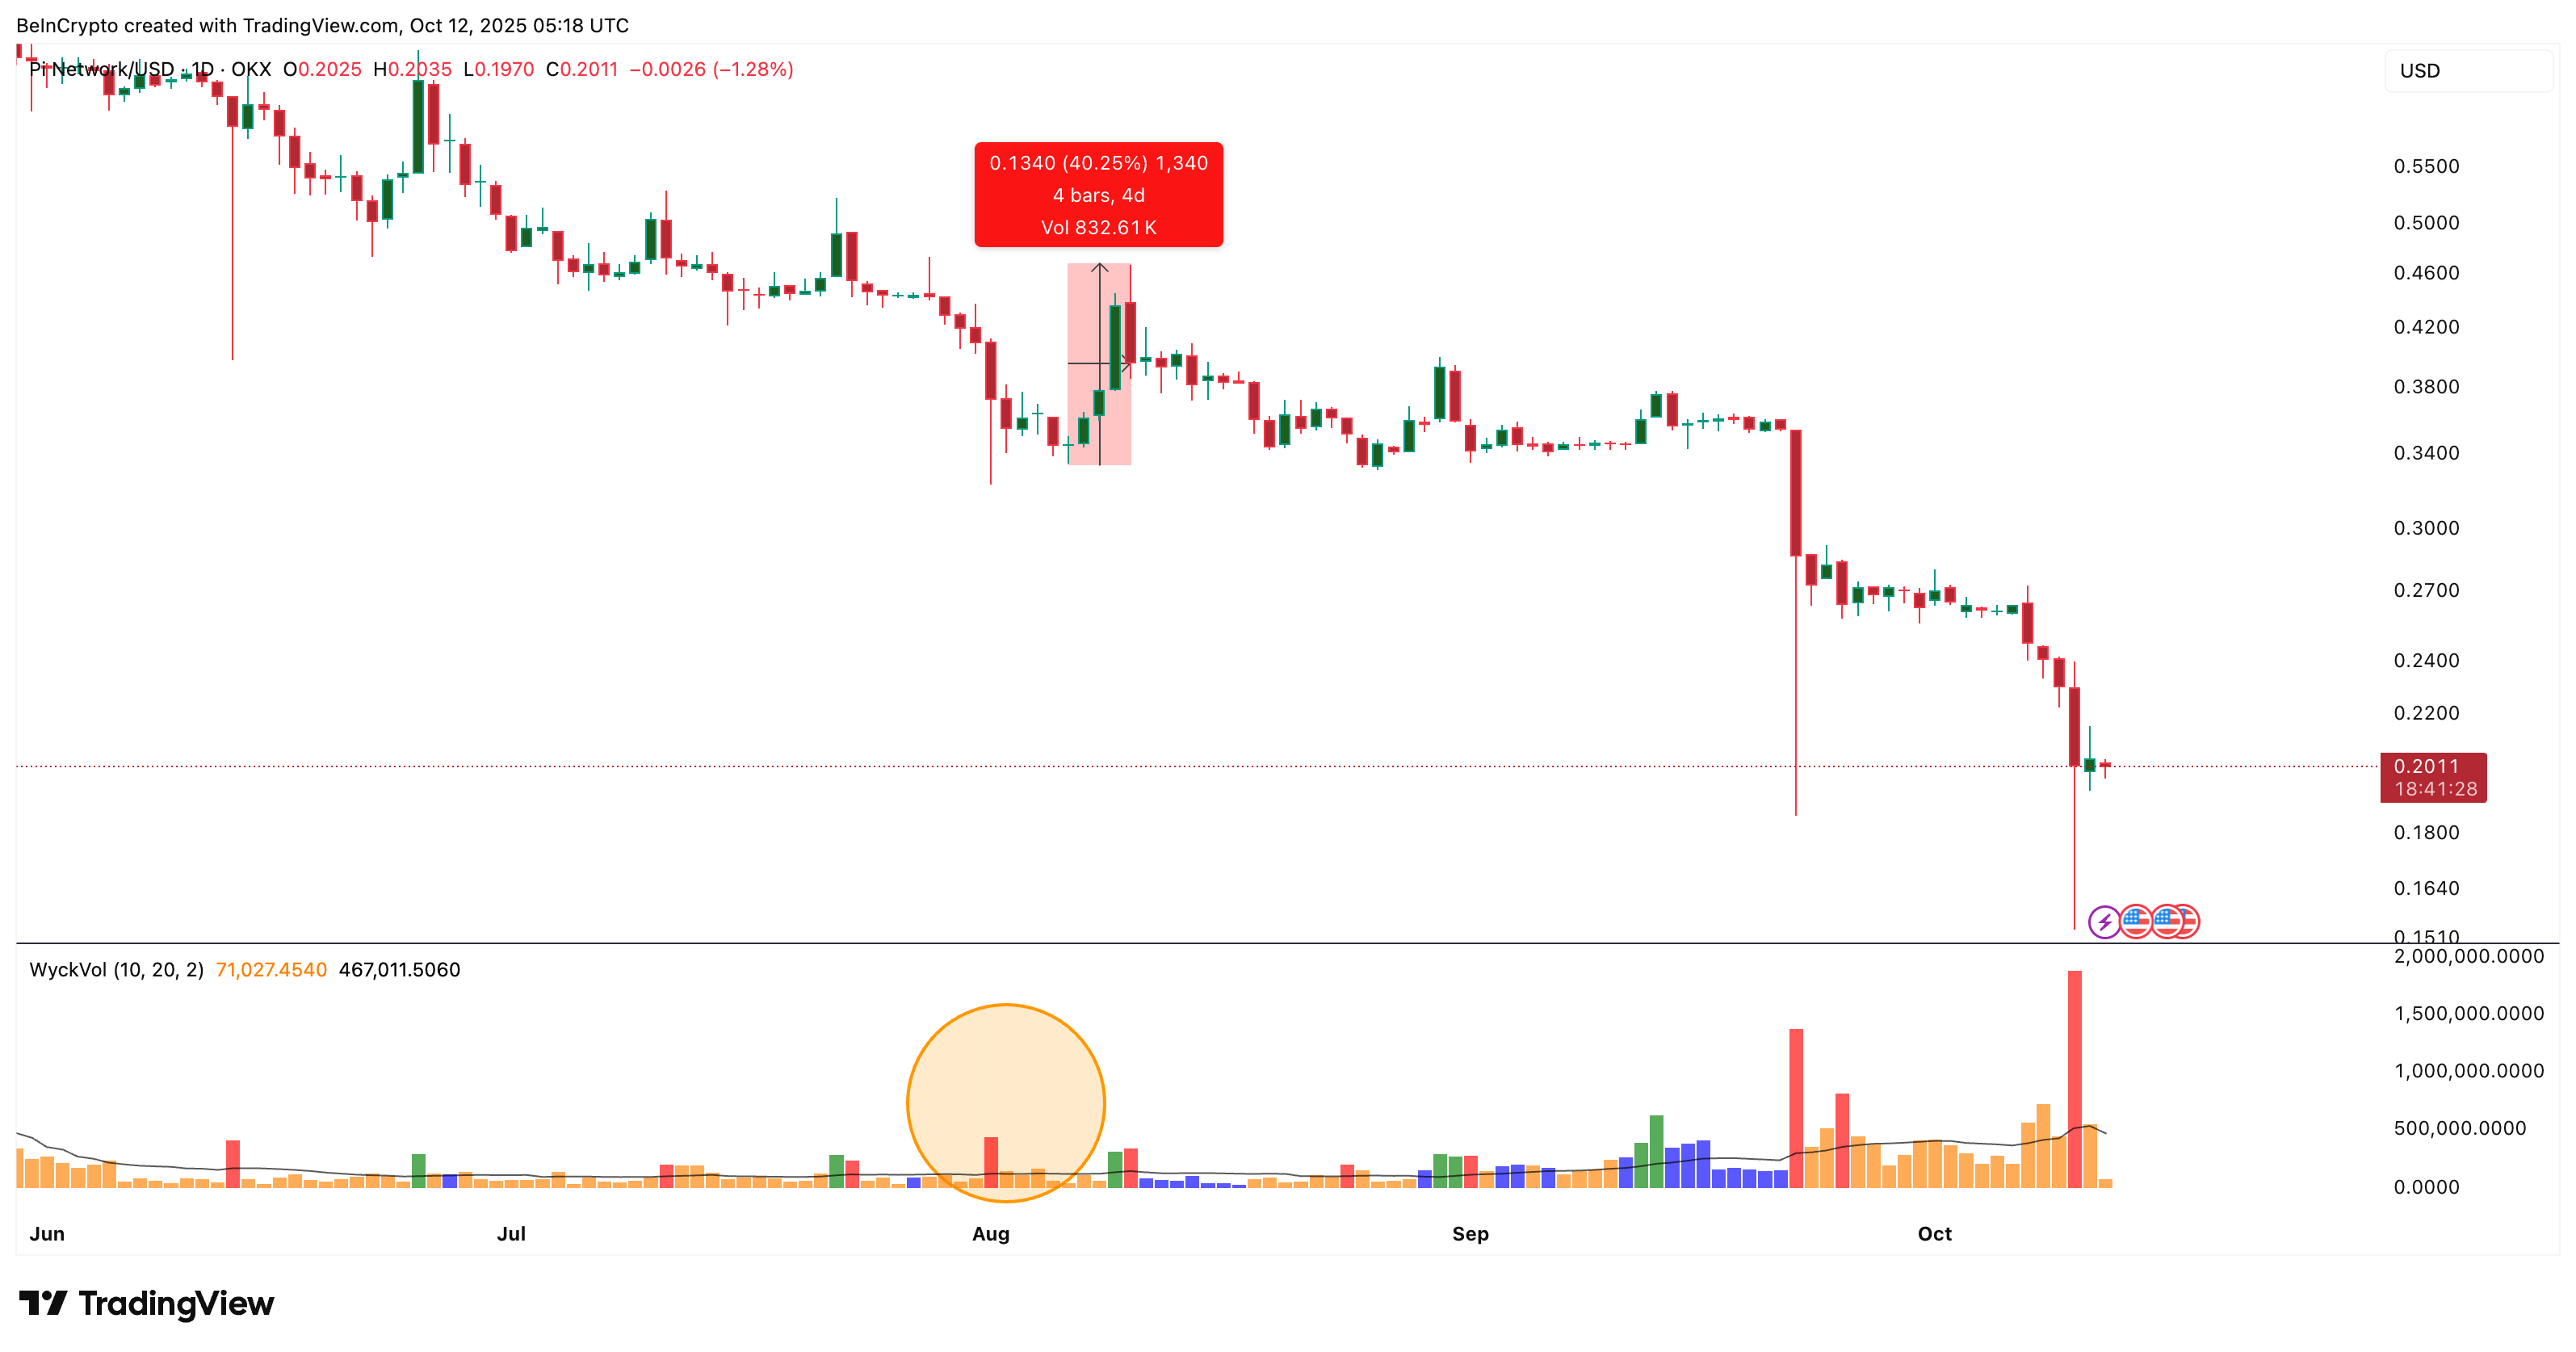 Pi Coin Sell Pressure Shrinking: TradingView
Want more token insights like this? Sign up for Editor Harsh Notariya’s Daily Crypto Newsletter here.
More importantly, the yellow bars have been shrinking. That shows selling momentum is fading, and buyers are gradually stepping in.
The last time this shrinking pattern appeared was in early August, when Pi Coin rallied nearly 40% in just four days. If this trend continues without another spike in red sell bars, PI could see a similar short-term rebound again.
The Chaikin Money Flow (CMF)—which measures how much large-scale or institutional money is entering or leaving an asset—adds to this positive setup.
Even though CMF briefly dipped below zero, it remains well above its October 7 low and far stronger than its late-August levels.
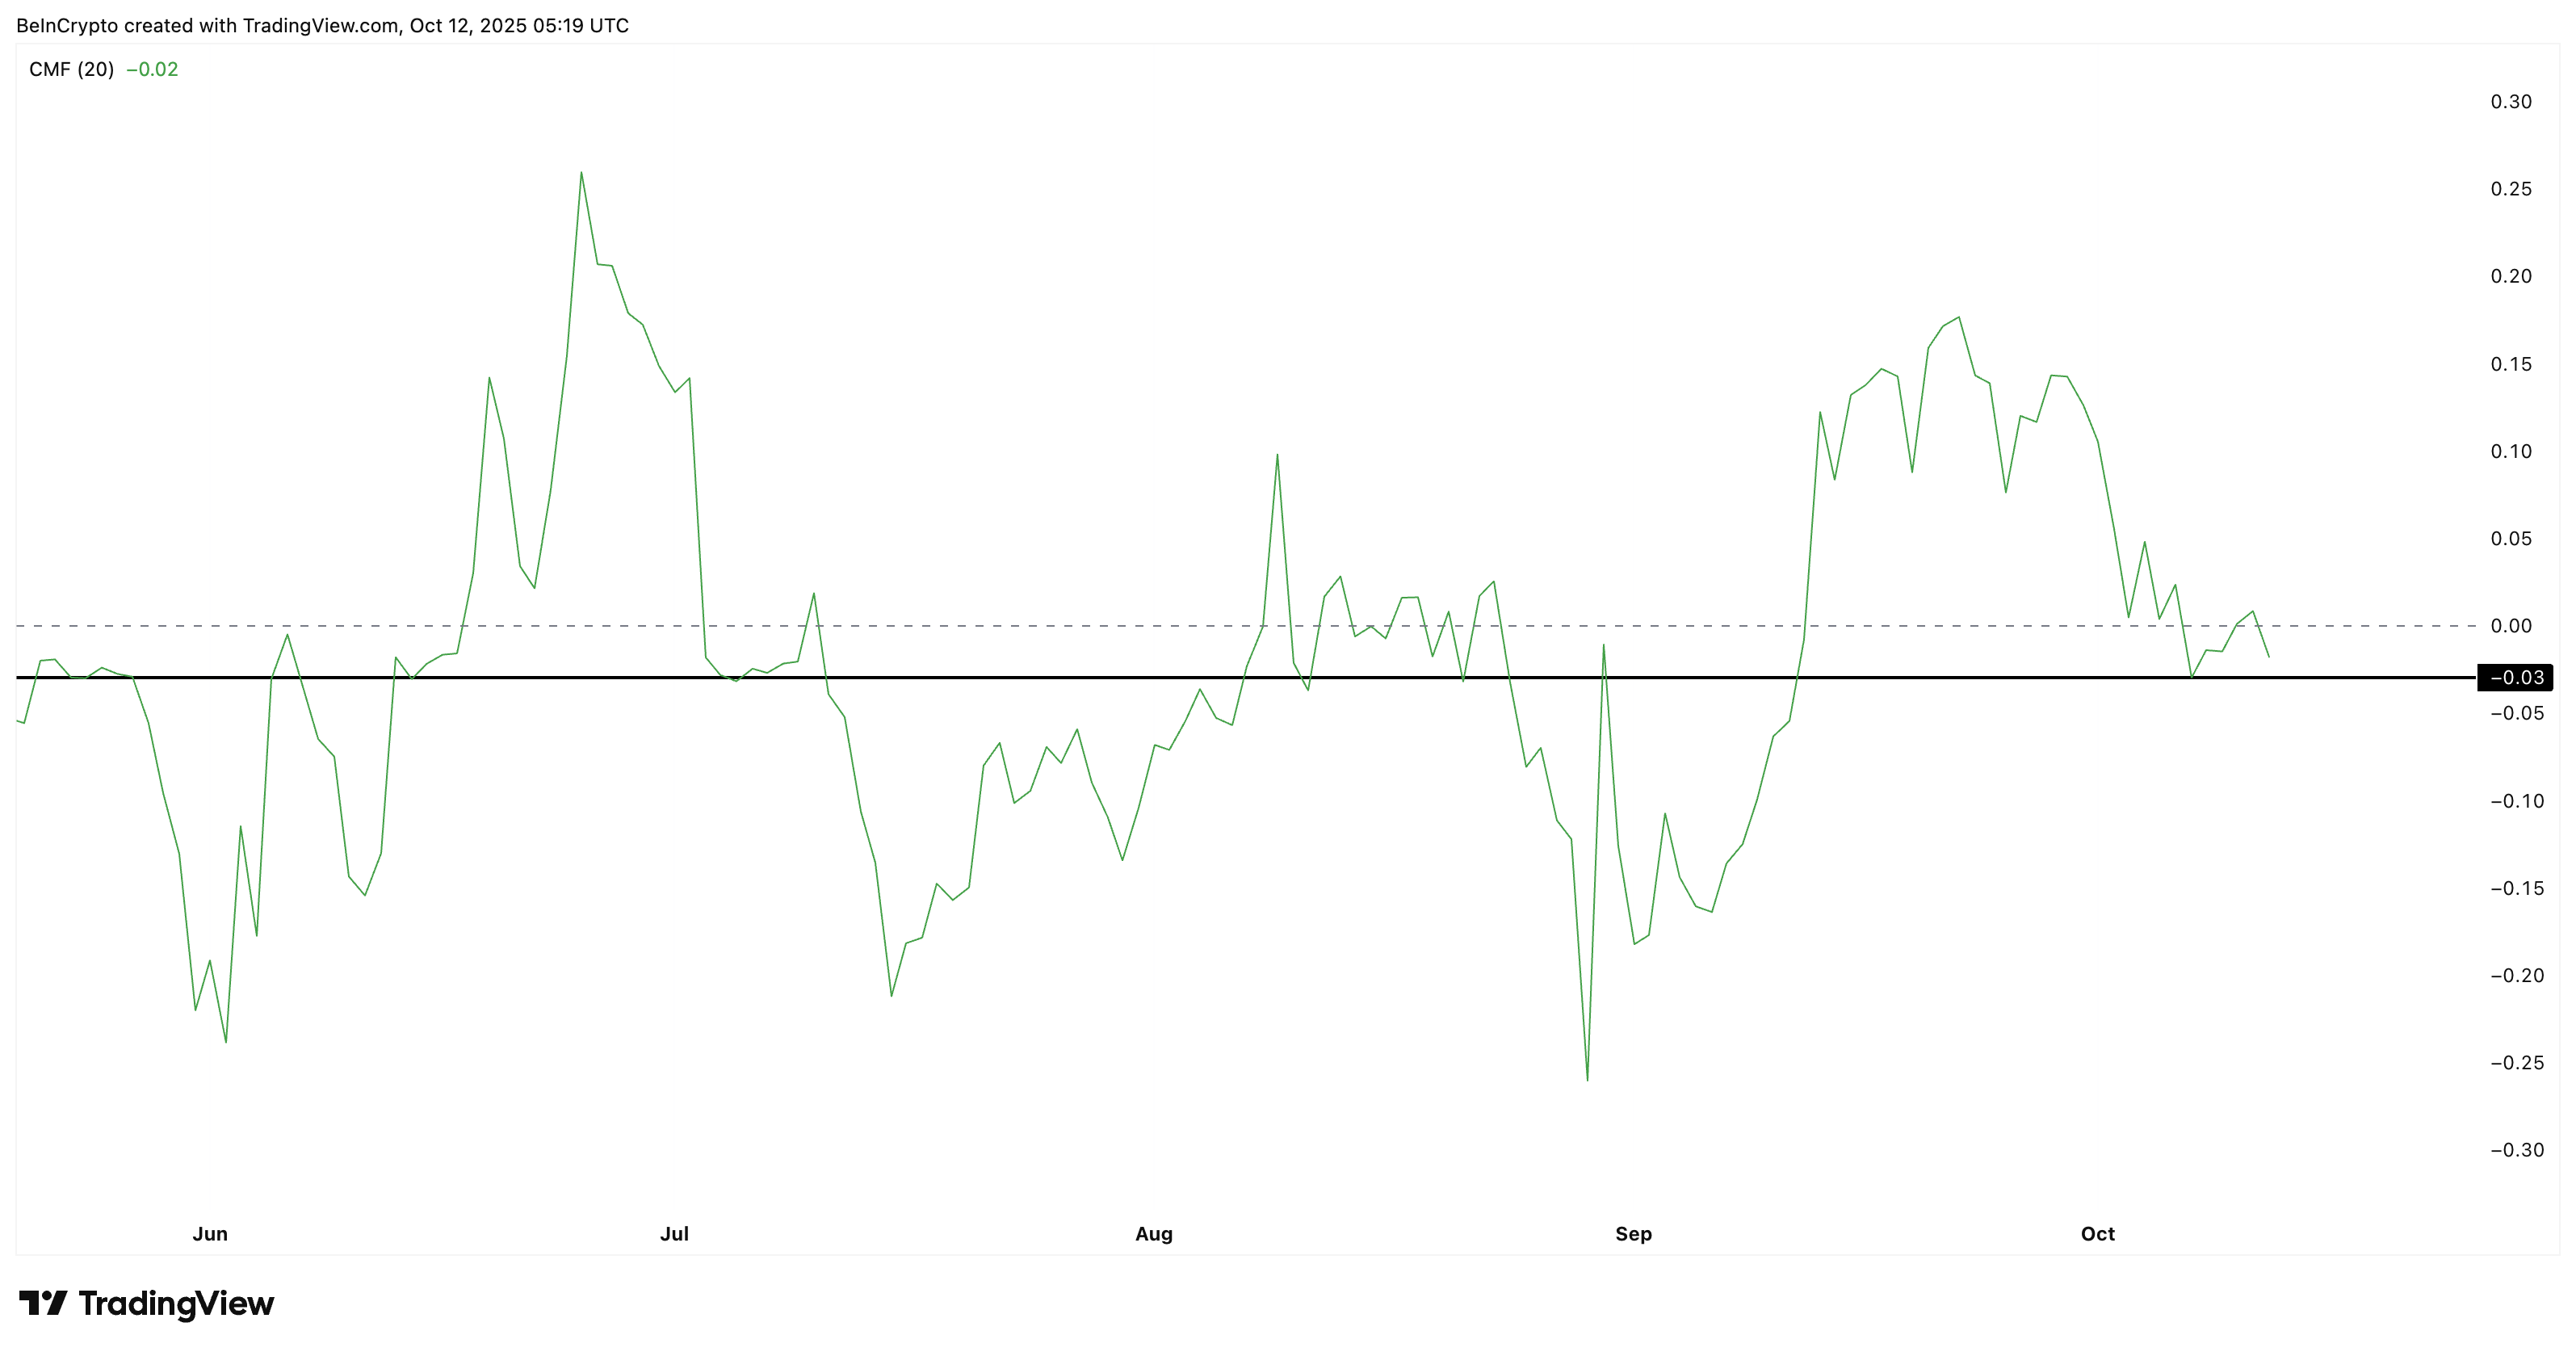 Pi Coin CMF: TradingView
This means big traders are still quietly accumulating Pi Coin, even as smaller investors remain cautious (exhibited by still-yellow Wyckoff bars). Together, these signals reflect a cooling sell-off and slow return of buyer strength.
Bullish Divergence Hints at a Pi Coin Price Reversal in Motion
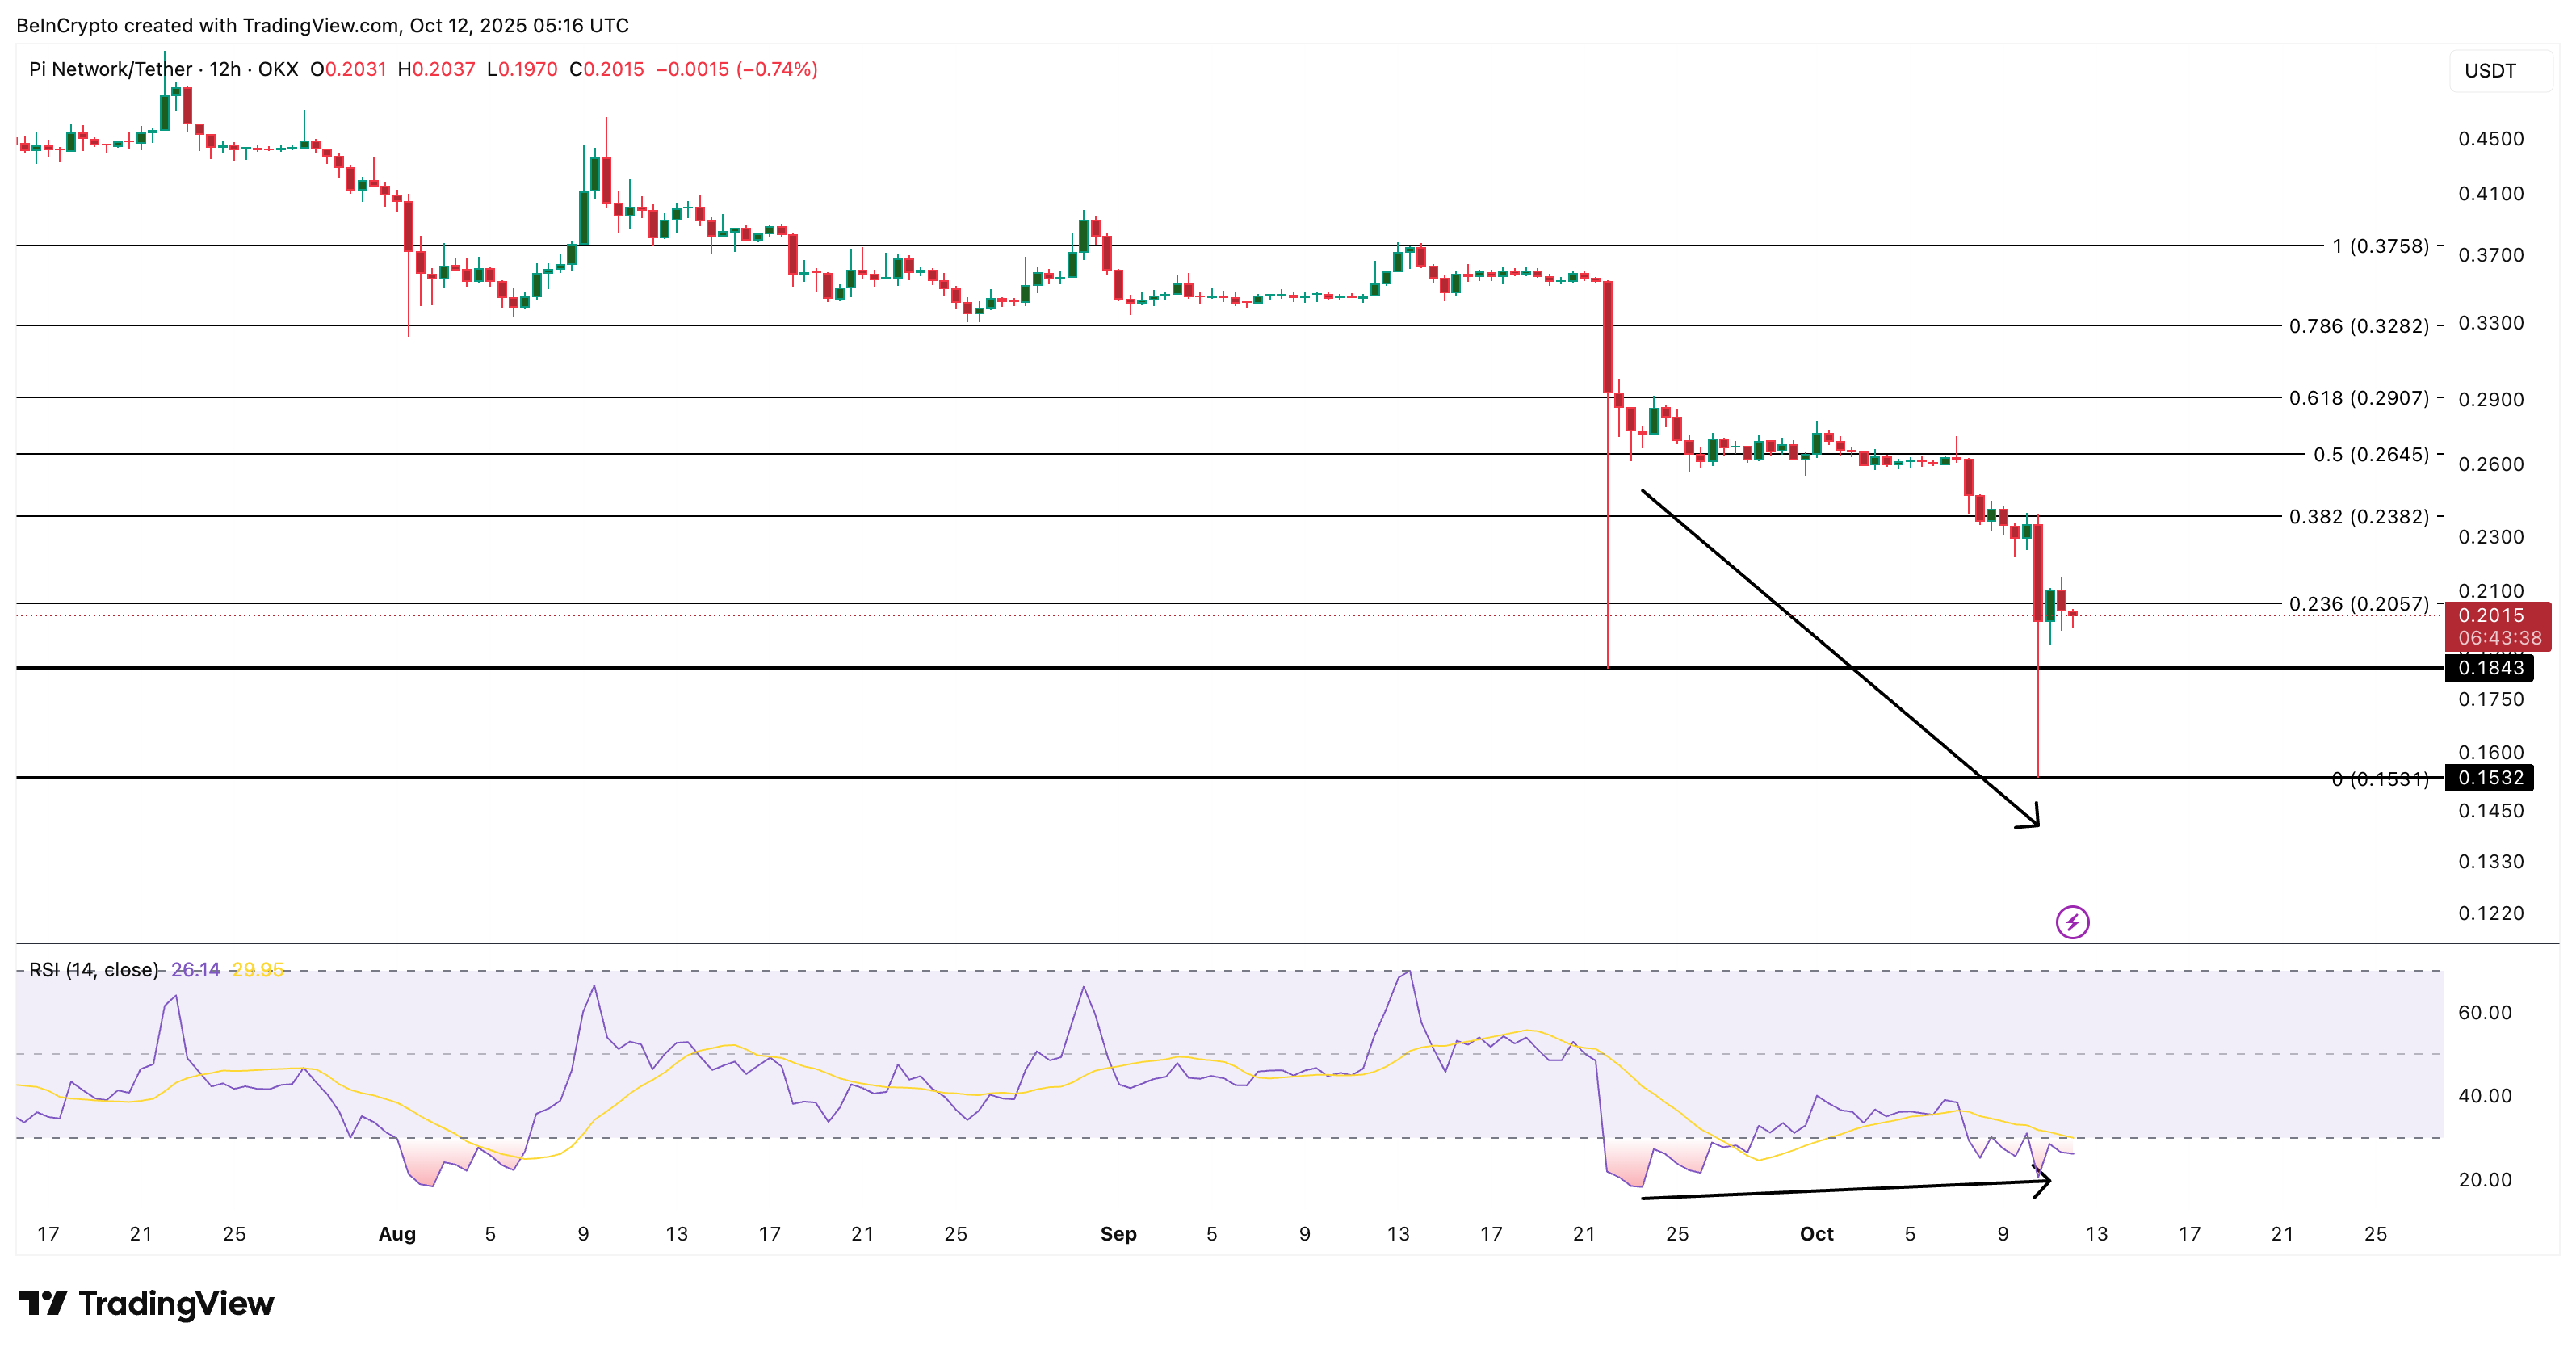
On the 12-hour chart, Pi Coin’s price has formed a bullish RSI divergence between September 23 and October 10. While the price made a lower low, the Relative Strength Index (RSI) made a higher low, showing that downward momentum is losing force.
While this kind of divergence is usually associated with trend reversals, considering PI’s weak price history, a rebound looks more likely.
(RSI measures momentum between 0 and 100, showing when an asset is overbought or oversold.)
At the time of writing, PI trades at $0.201, sitting near the 0.236 Fibonacci retracement level. A 12-hour candle close above $0.205 could confirm a breakout attempt toward the next resistance at $0.238 — a roughly 18% upside from the current price.
 Pi Coin Price Analysis: TradingView
If that move holds, PI could stretch gains toward $0.264 (about 31% higher) and possibly $0.290 (around 44% above current levels).
However, a drop below $0.184 would invalidate this rebound setup and could push the Pi Coin price back toward even $0.153, depending on how the broader market reacts.
Recommended Articles


