
Crypto Today: Bitcoin, Ethereum, XRP extend gains as demand for ETFs surges
- Bitcoin surges above $118,000, supported by rising ETF inflows.
- Ethereum offers technical bullish signals, increasing the chances of an extended breakout.
- XRP rises on a surge in retail demand, with futures Open Interest at over one-week highs.
Bitcoin (BTC) trades above $118,000 on Thursday as bulls regain control, pushing for a breakout above the psychological $120,000. Altcoins, including Ethereum (ETH) and Ripple (XRP), are also gaining momentum, reflecting the optimism that is building across the crypto market for a 25-basis-point interest rate cut by the United States (US) Federal Reserve (Fed) this October.
Data spotlight: Bitcoin near $120,000 backed by ETF inflows
Interest in Bitcoin spot Exchange Products (ETF) has significantly improved from early in the week, mirrored by steady inflows. SoSoValue data shows that US ETFs experienced a total of $676 million in inflows on Wednesday, $430 million on Tuesday and $522 million on Monday.
BlackRock’s IBIT ETF saw $406 million in inflows on Wednesday, followed by Fidelity’s FBTC with $179 million and Bitwise’s BITB with $59 million. None of the 12 ETF products saw outflows, underpinning the increase in demand.
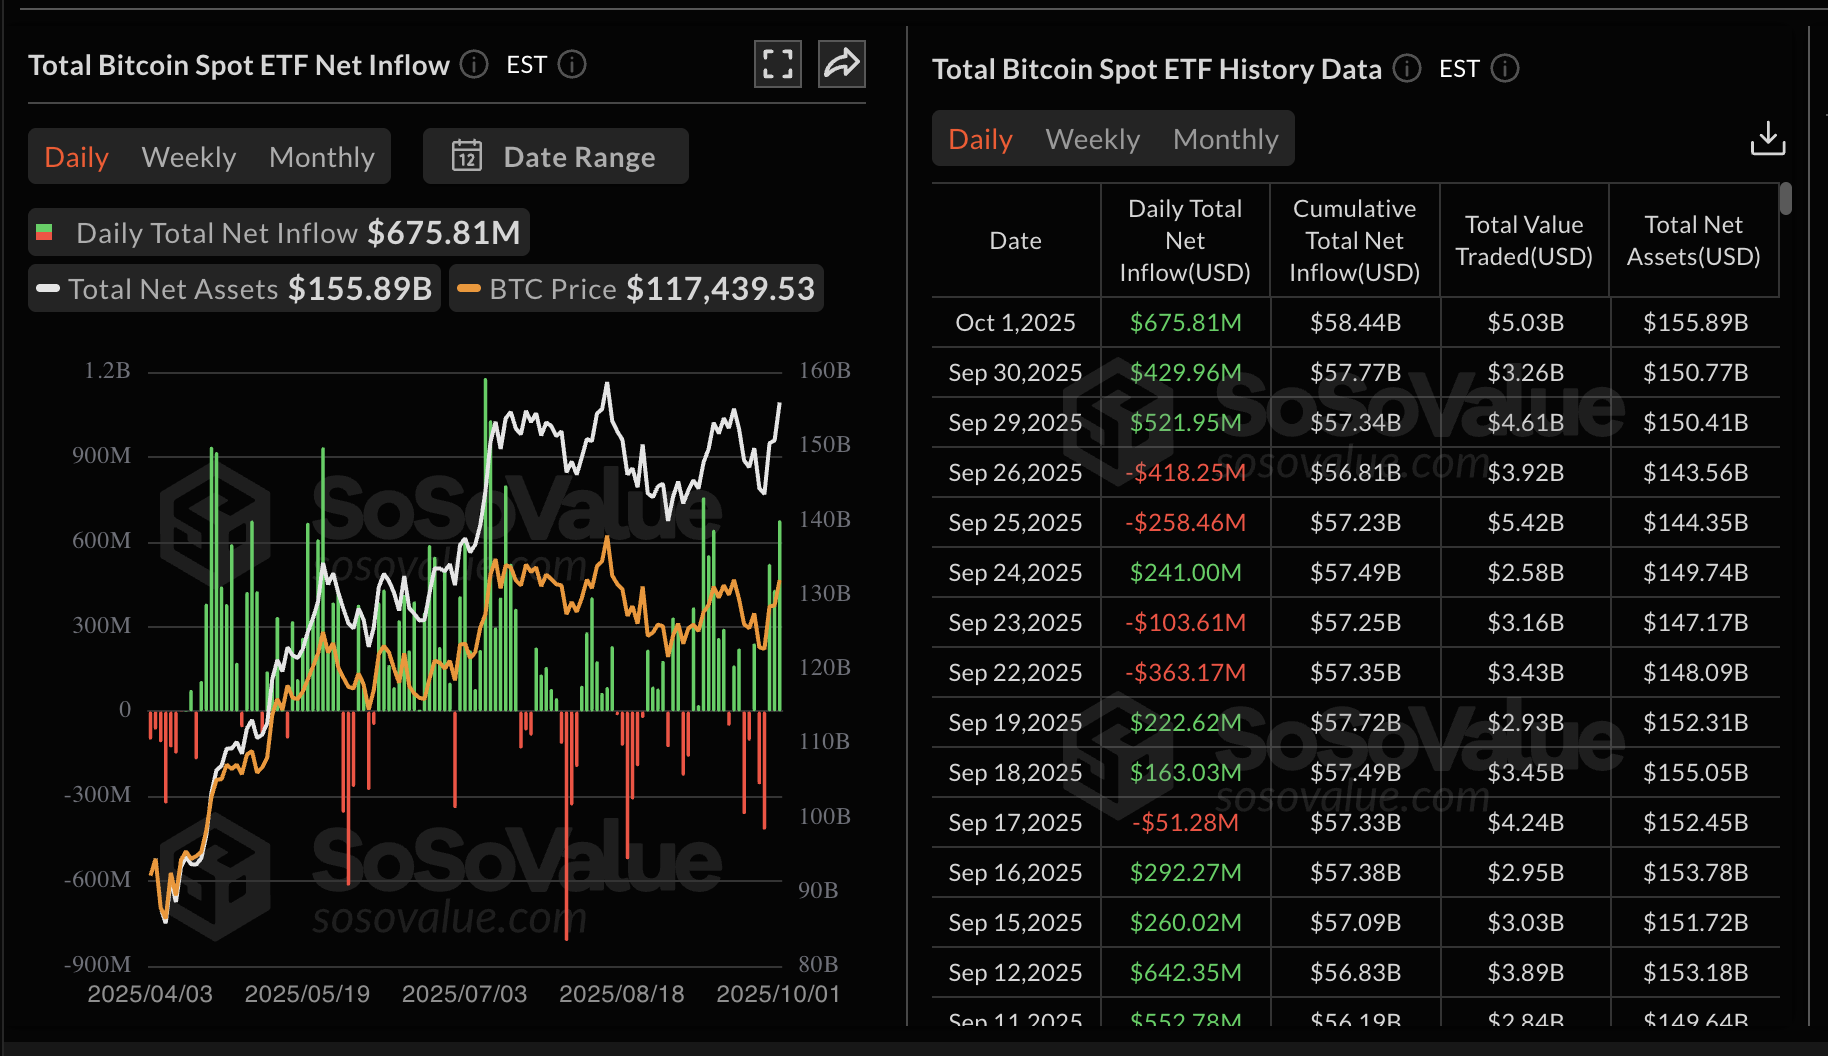
Bitcoin ETF stats | Source: SoSoValue
Demand for Ethereum spot ETFs has also increased steadily this week, but it is significantly lagging behind that for Bitcoin. Inflows on Wednesday totalled $81 million, marking three consecutive days of inflows.
BlackRock’s ETHA led with $26 million in inflows on Wednesday, followed by Fidelity’s FBTC with $37 million and Grayscales’ ETH with $14 million. None of the nine ETF products in the US experienced outflows, supporting a general bullish sentiment surrounding the altcoin.
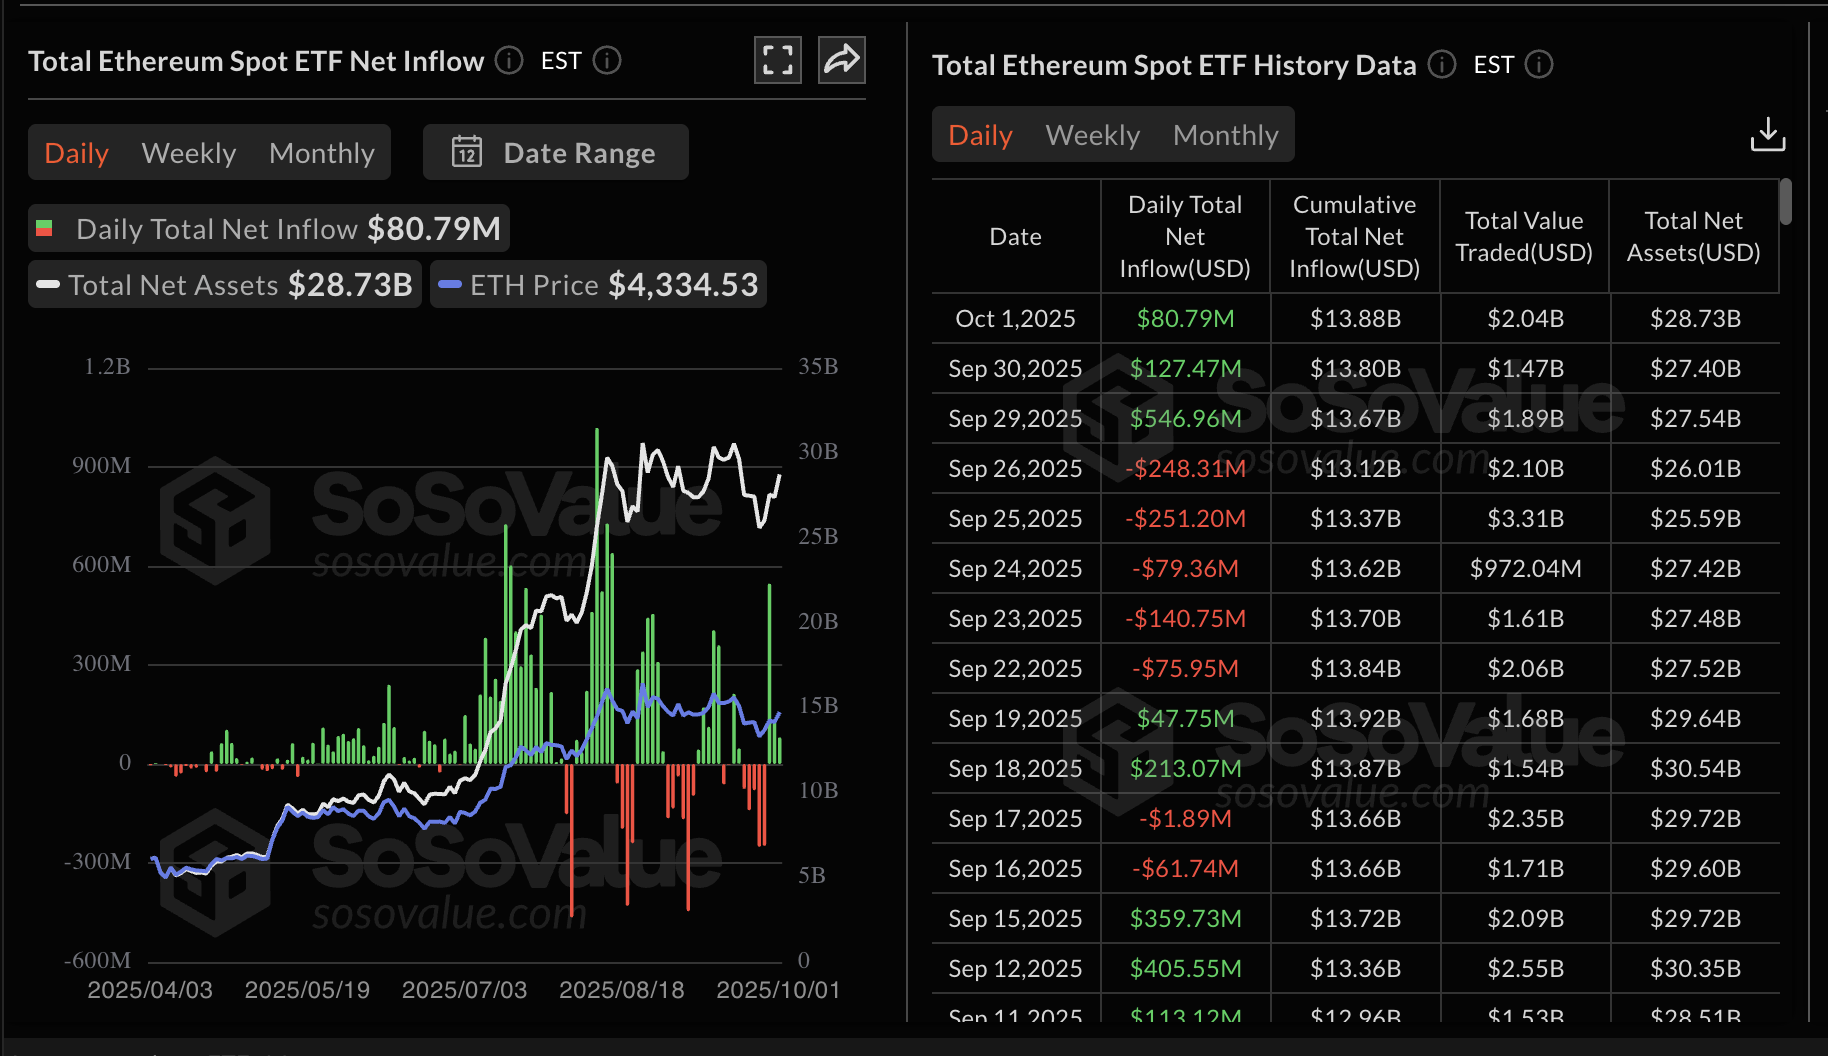
Ethereum ETF stats | Source: SoSoValue
Meanwhile, retail demand for XRP derivatives is also on the rise, with the futures Open Interest (OI) reaching a monthly low of $7.35 billion to average at around $7.83 billion at the time of writing, according to CoinGlass.
OI represents the notional value of outstanding futures contracts; hence, a persistent increase means demand for futures is gaining traction as traders pile into long positions. Higher OI also implies increased engagement and conviction in XRP’s ability to sustain the uptrend in the short term.
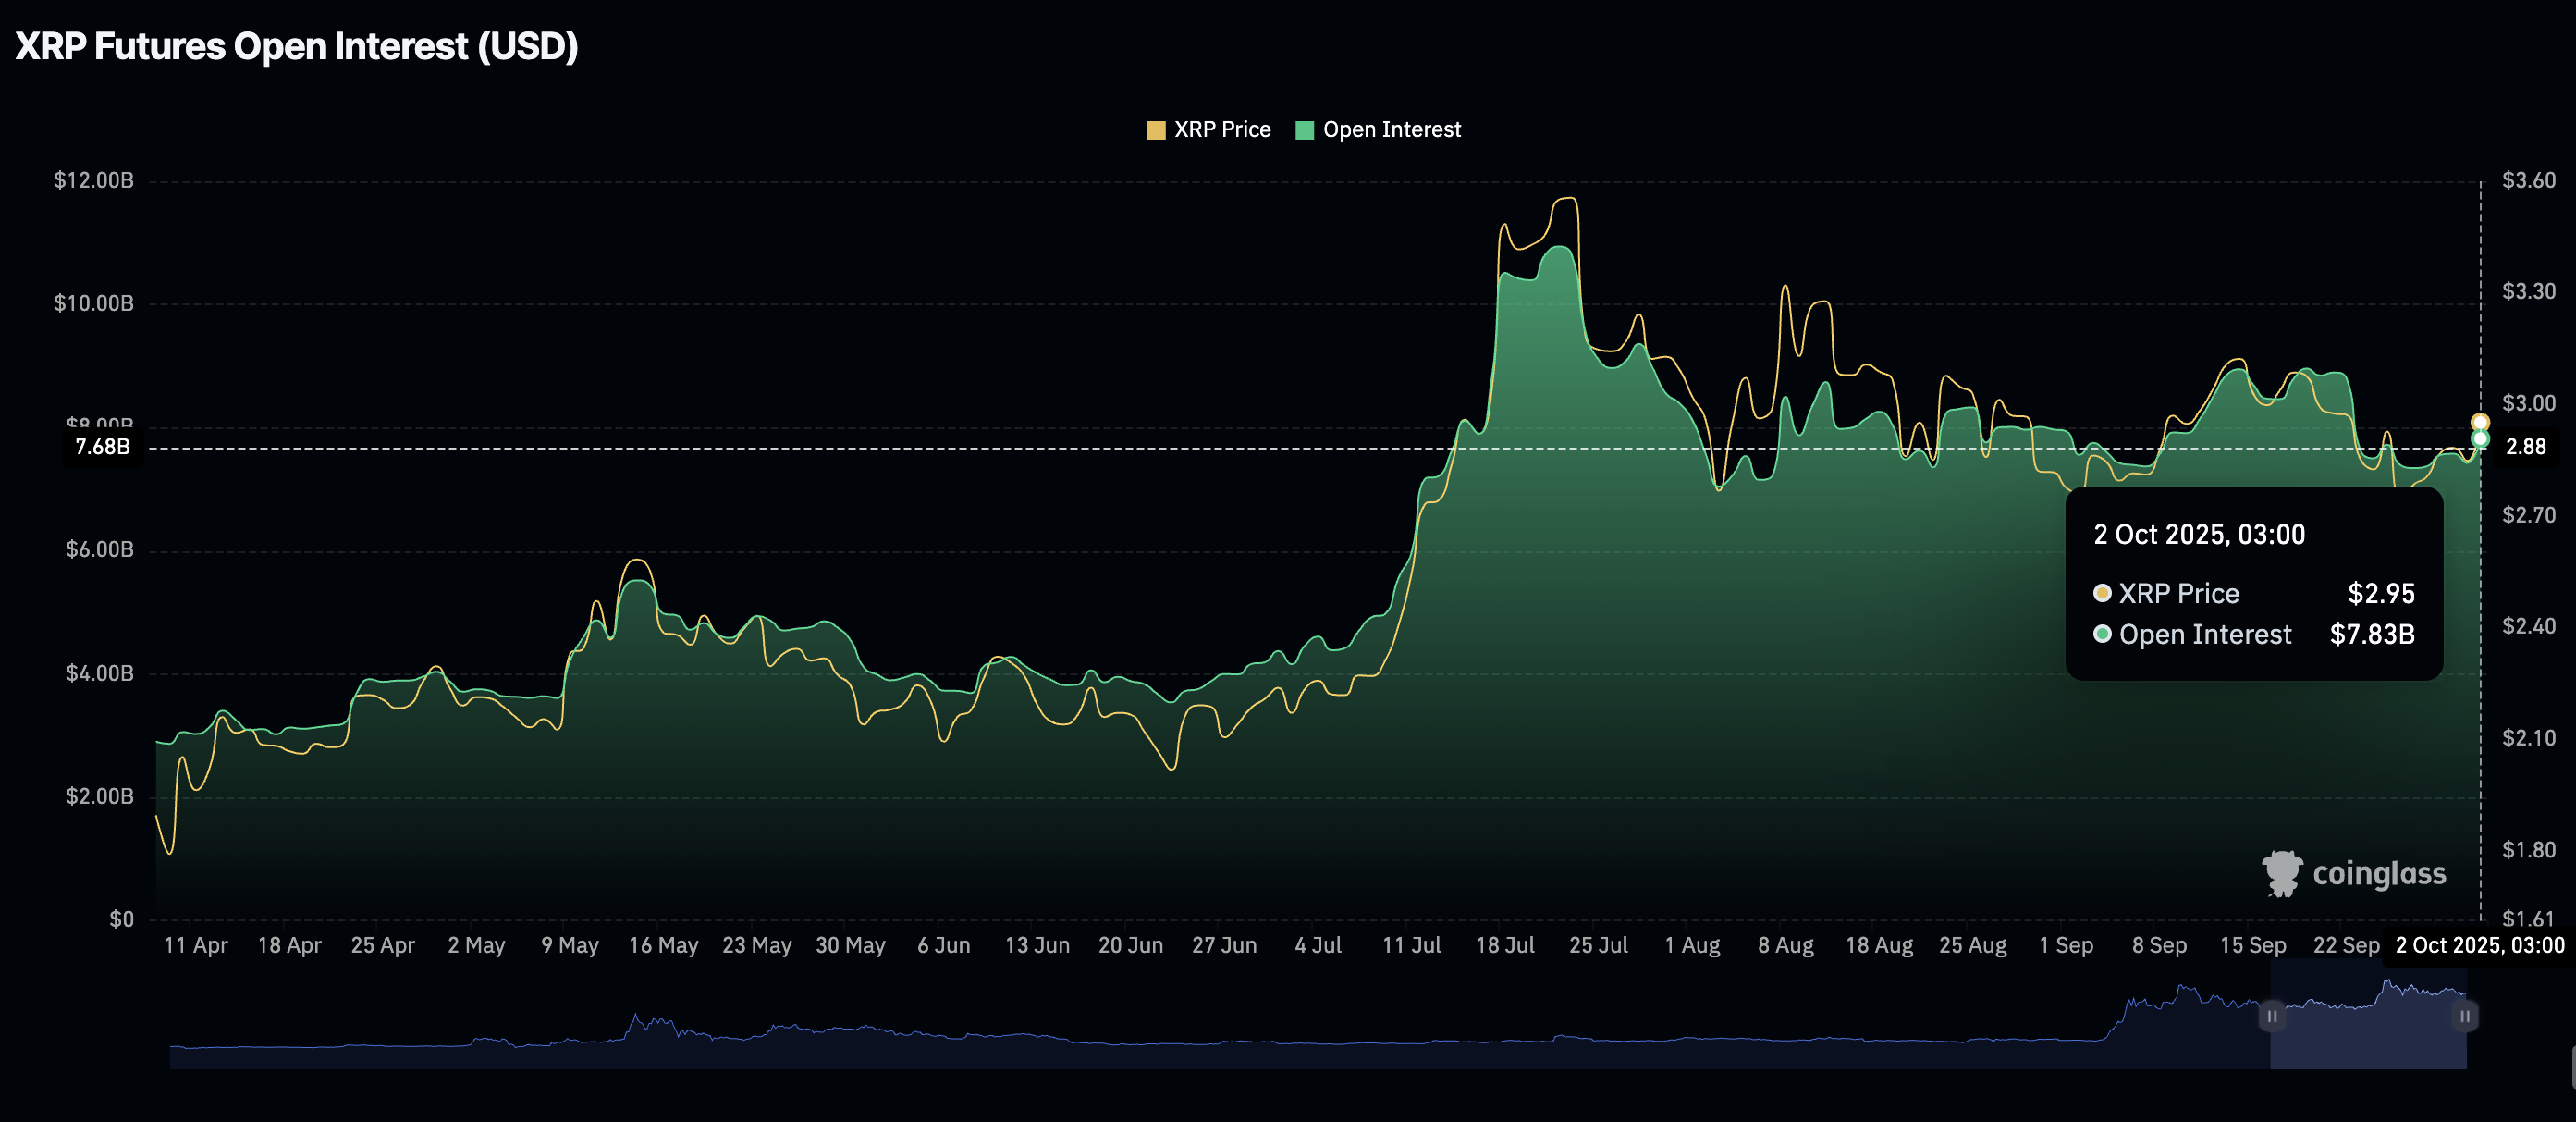
XRP Futures Open Interest | Source: CoinGlass
Chart of the day: Bitcoin nears $120,000
Bitcoin has reached an intraday high of $119,456 so far on Thursday but has pulled back slightly, confirming short-term support at $118,000. Key technical indicators have aligned to support the bullish outlook, starting with the Relative Strength Index (RSI) breaking above a descending trendline (dotted) and standing at 63 on the daily chart. A steadily rising RSI indicates that bullish momentum is building, which could boost the odds of the BTC price closing above $120,000 on Thursday.
A buy signal from the Moving Average Convergence Divergence (MACD) indicator has been maintained since Wednesday, encouraging traders to seek risk exposure. Risk-on sentiment is likely to prevail if the blue MACD line remains above the red signal line, as the green histogram bars expand.
Still, investors should be cautiously optimistic as early profit-taking could snuff out accrued gains, leading to a decline toward the 50-day Exponential Moving Average (EMA), currently at $113,766 and the 100-day EMA at $112,110.
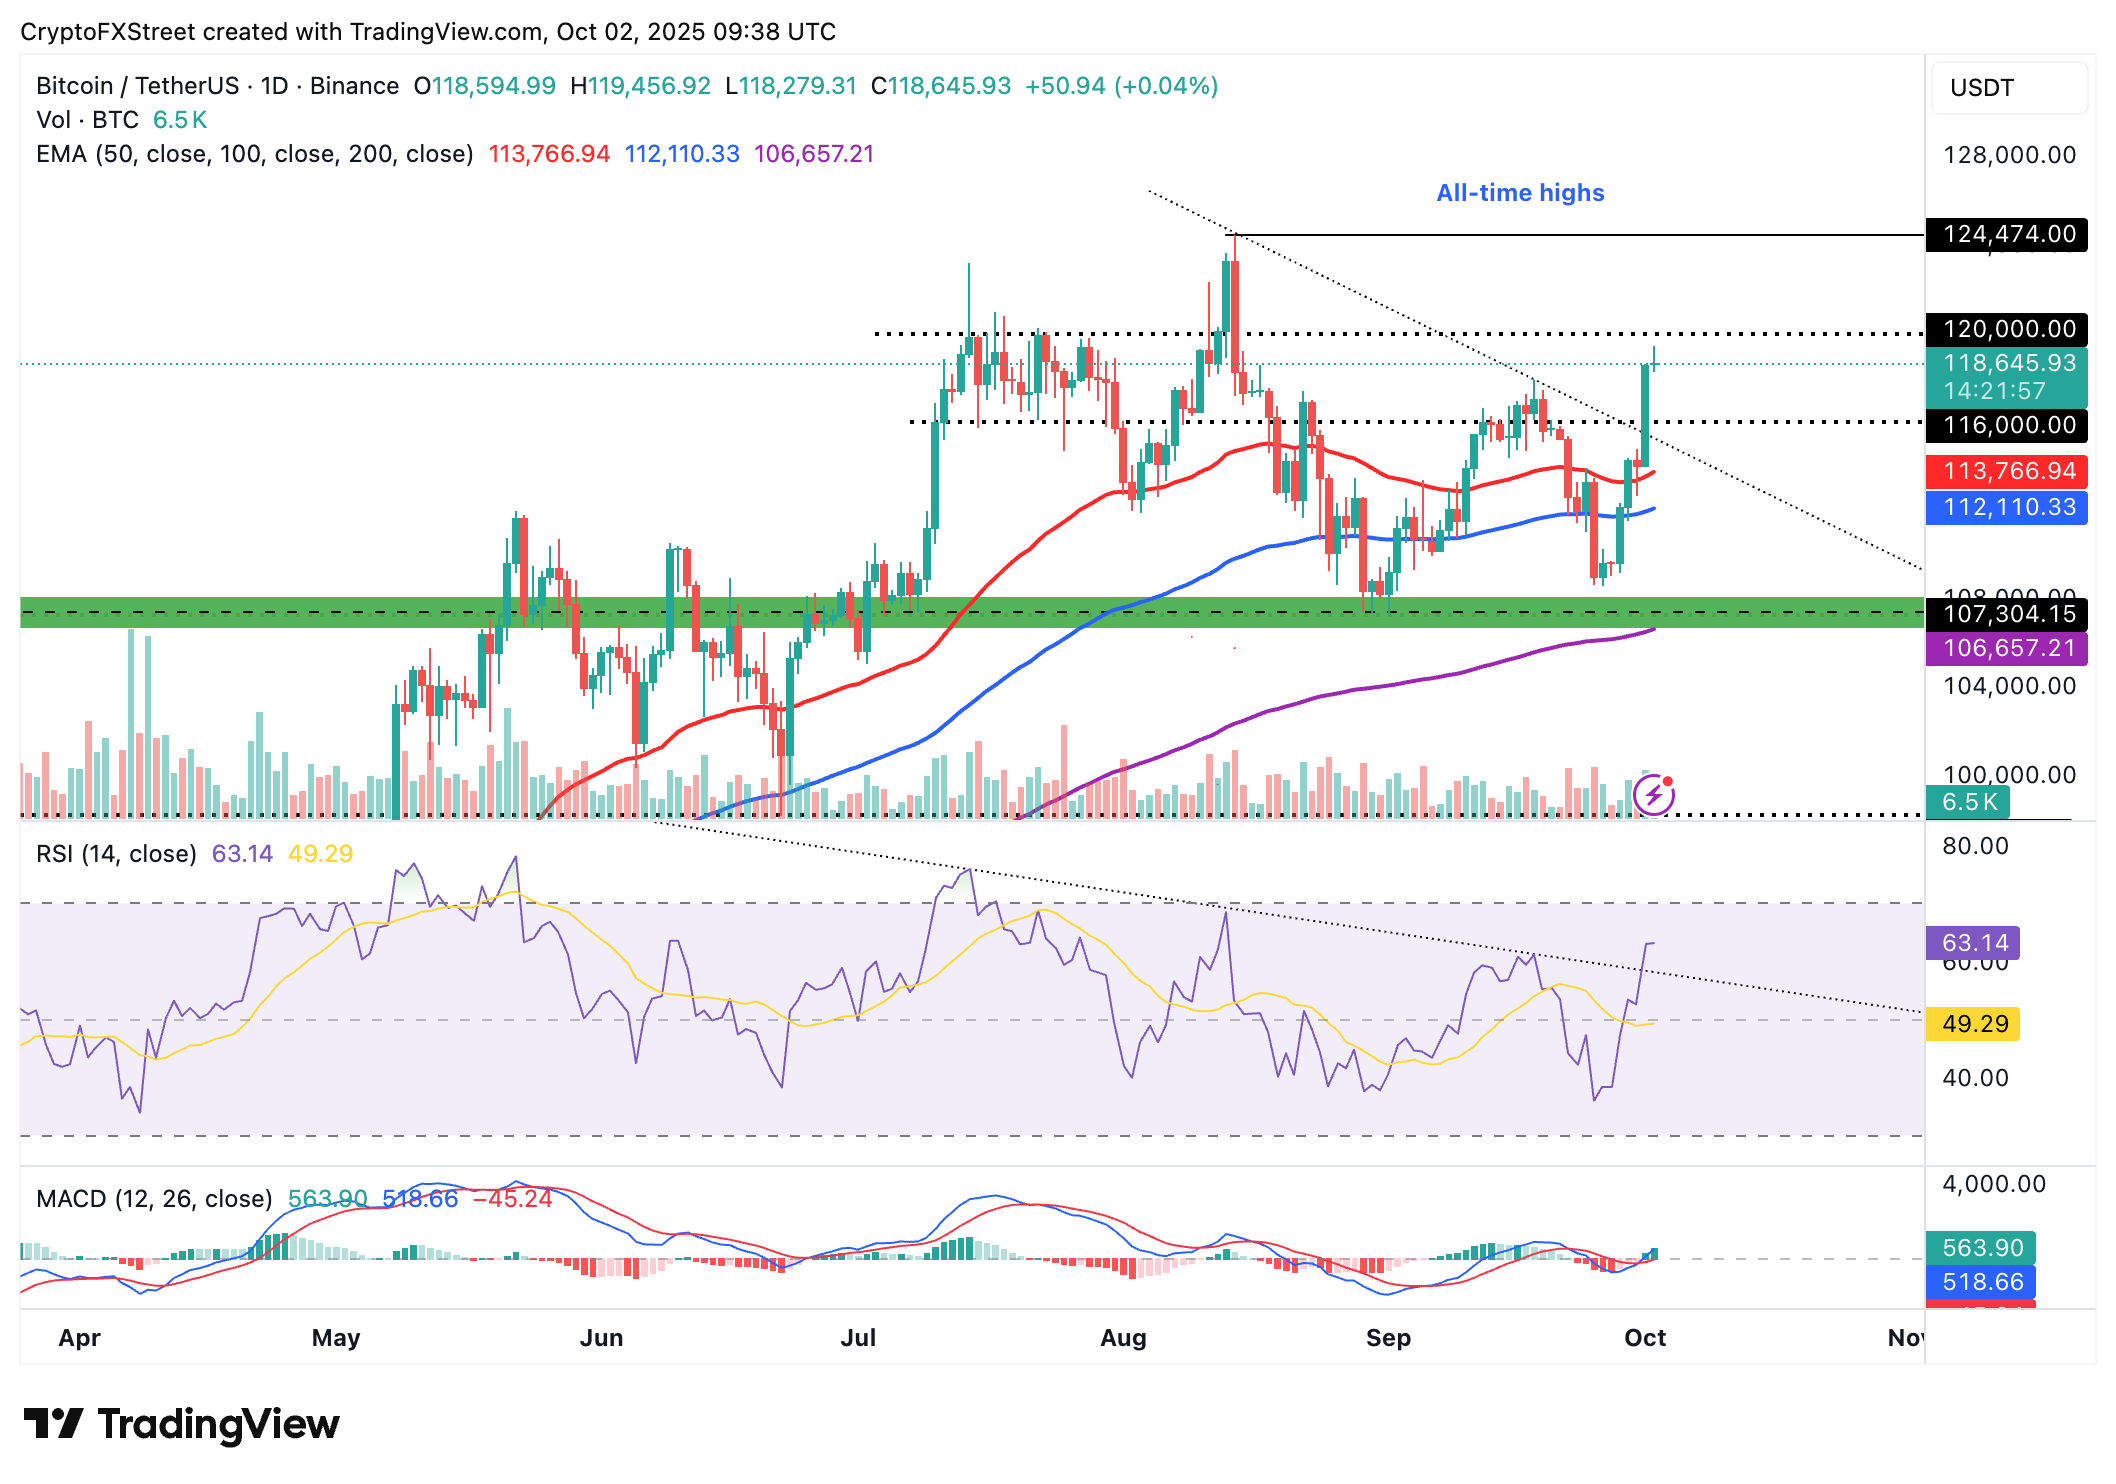
BTC/USDT daily chart
Altcoins update: Ethereum, XRP uphold bullish outlook
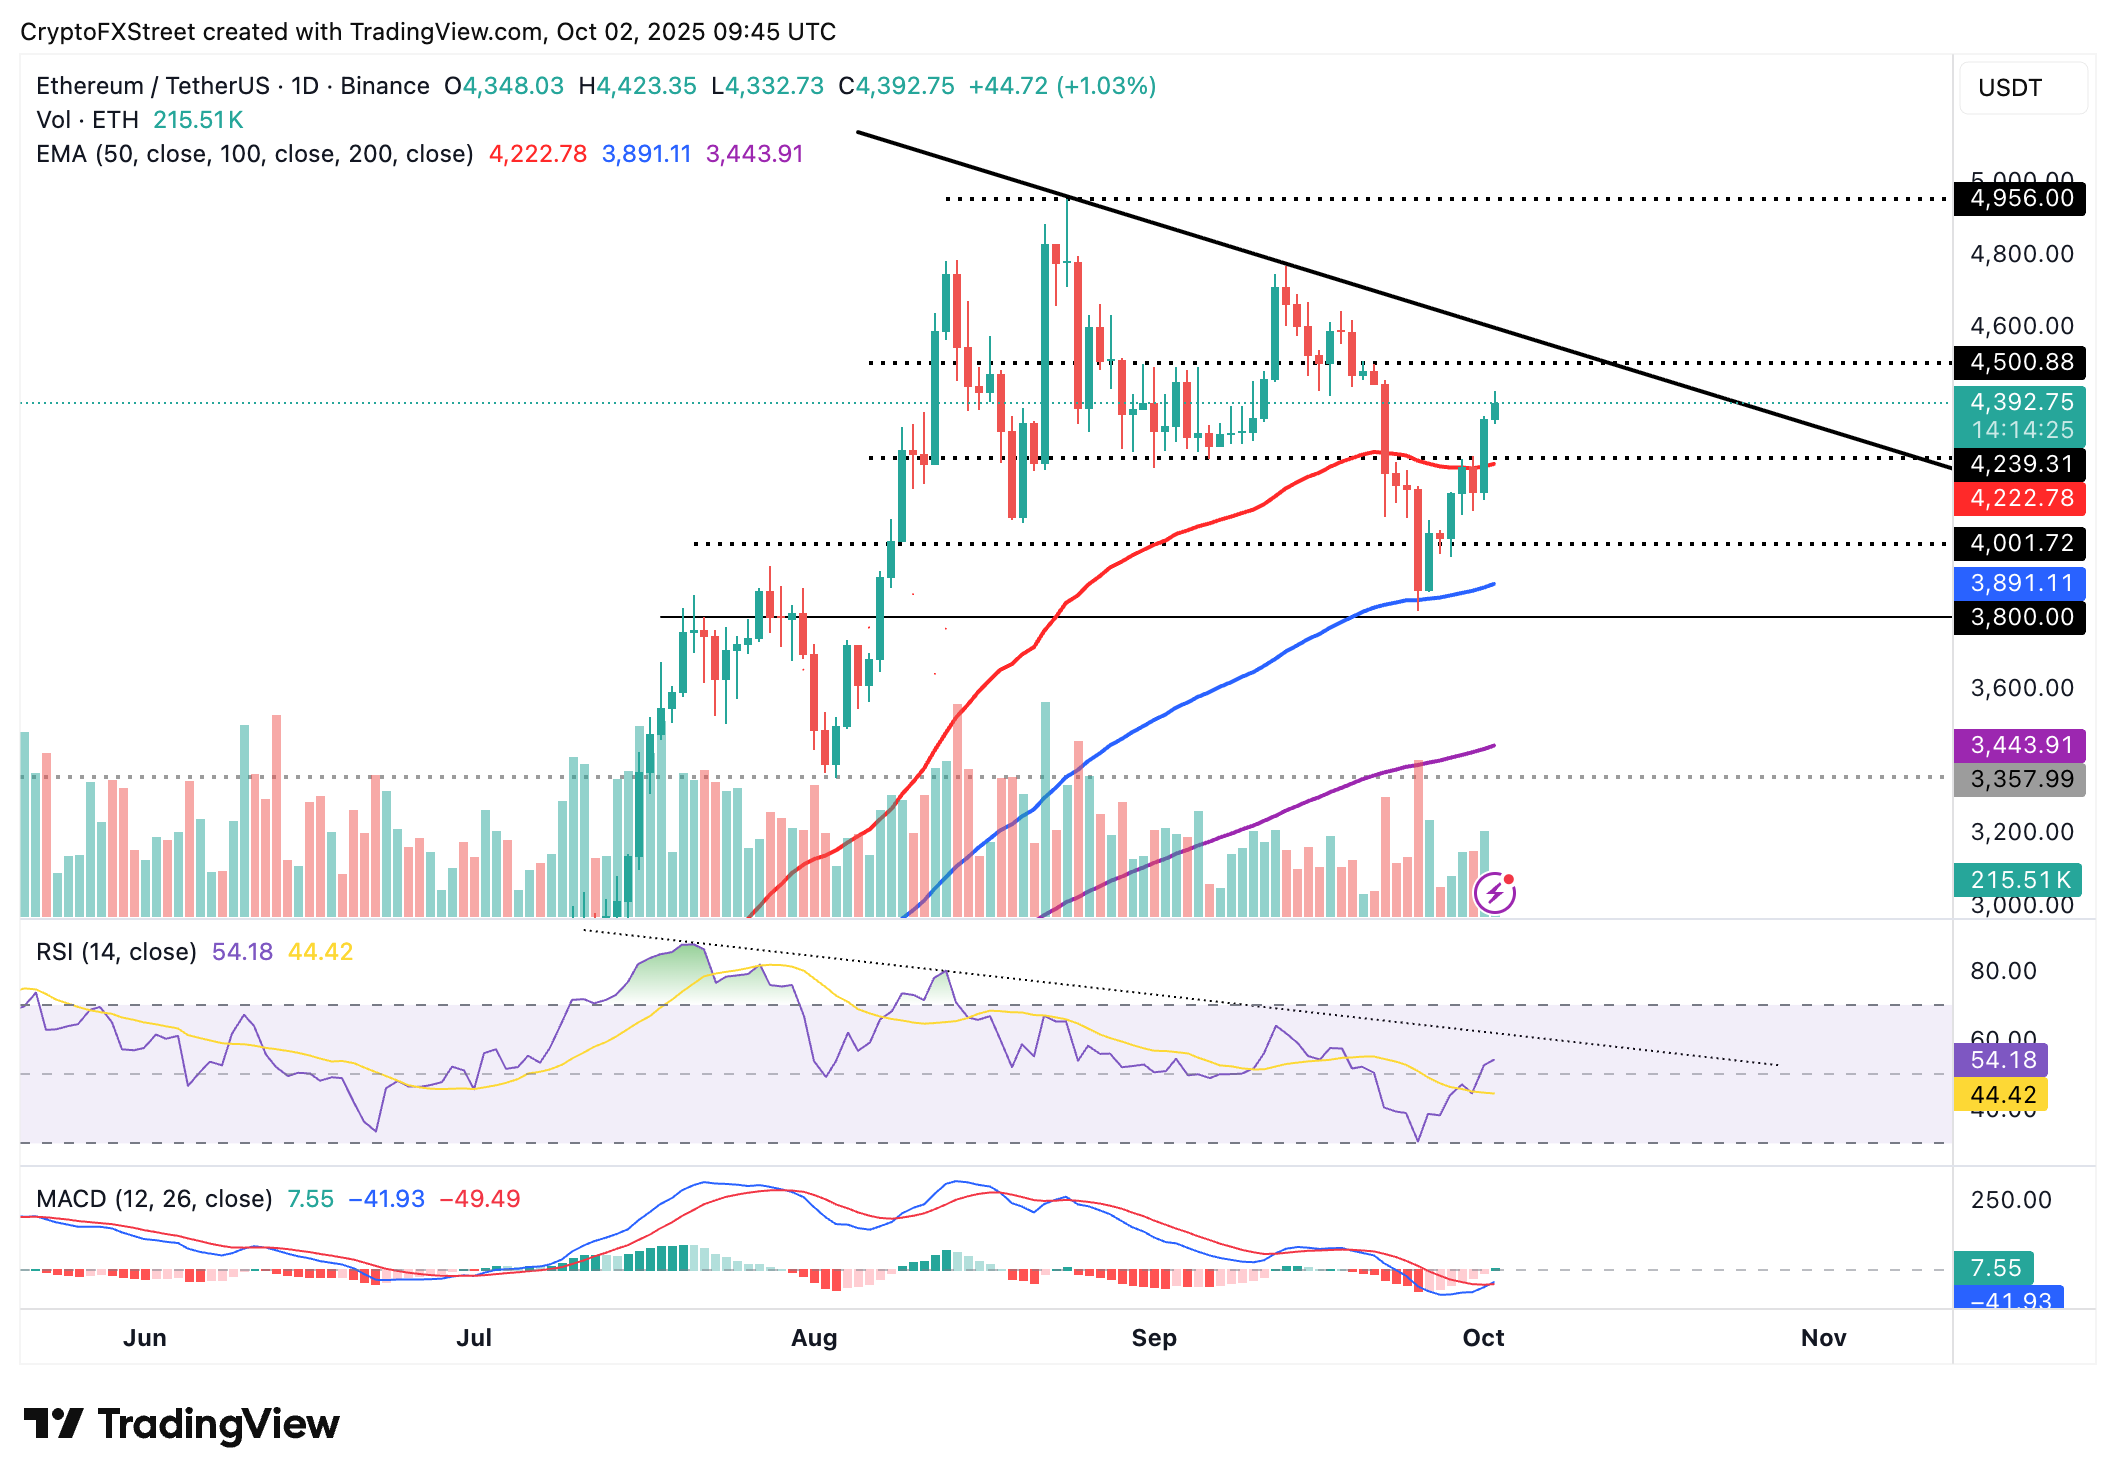
Ethereum remains relatively above the 50-day EMA, a key support level at $4,222, which reinforces risk-on sentiment. A sustained break above the short-term resistance range from $4,400 to $4,500 would validate the bullish picture.
The next leg up could bring the price of ETH near its record high of $4,956, reached on August 24. An uptrending RSI at 54 and a buy signal from the MACD indicator on the daily chart reinforce the strong bullish grip. Traders will consider increasing risk exposure, with the blue line potentially remaining above the red signal line. Another critical milestone for Ethereum would be breaking above the descending trendline, which has been in place on the daily chart since late August.
ETH/USDT daily chart
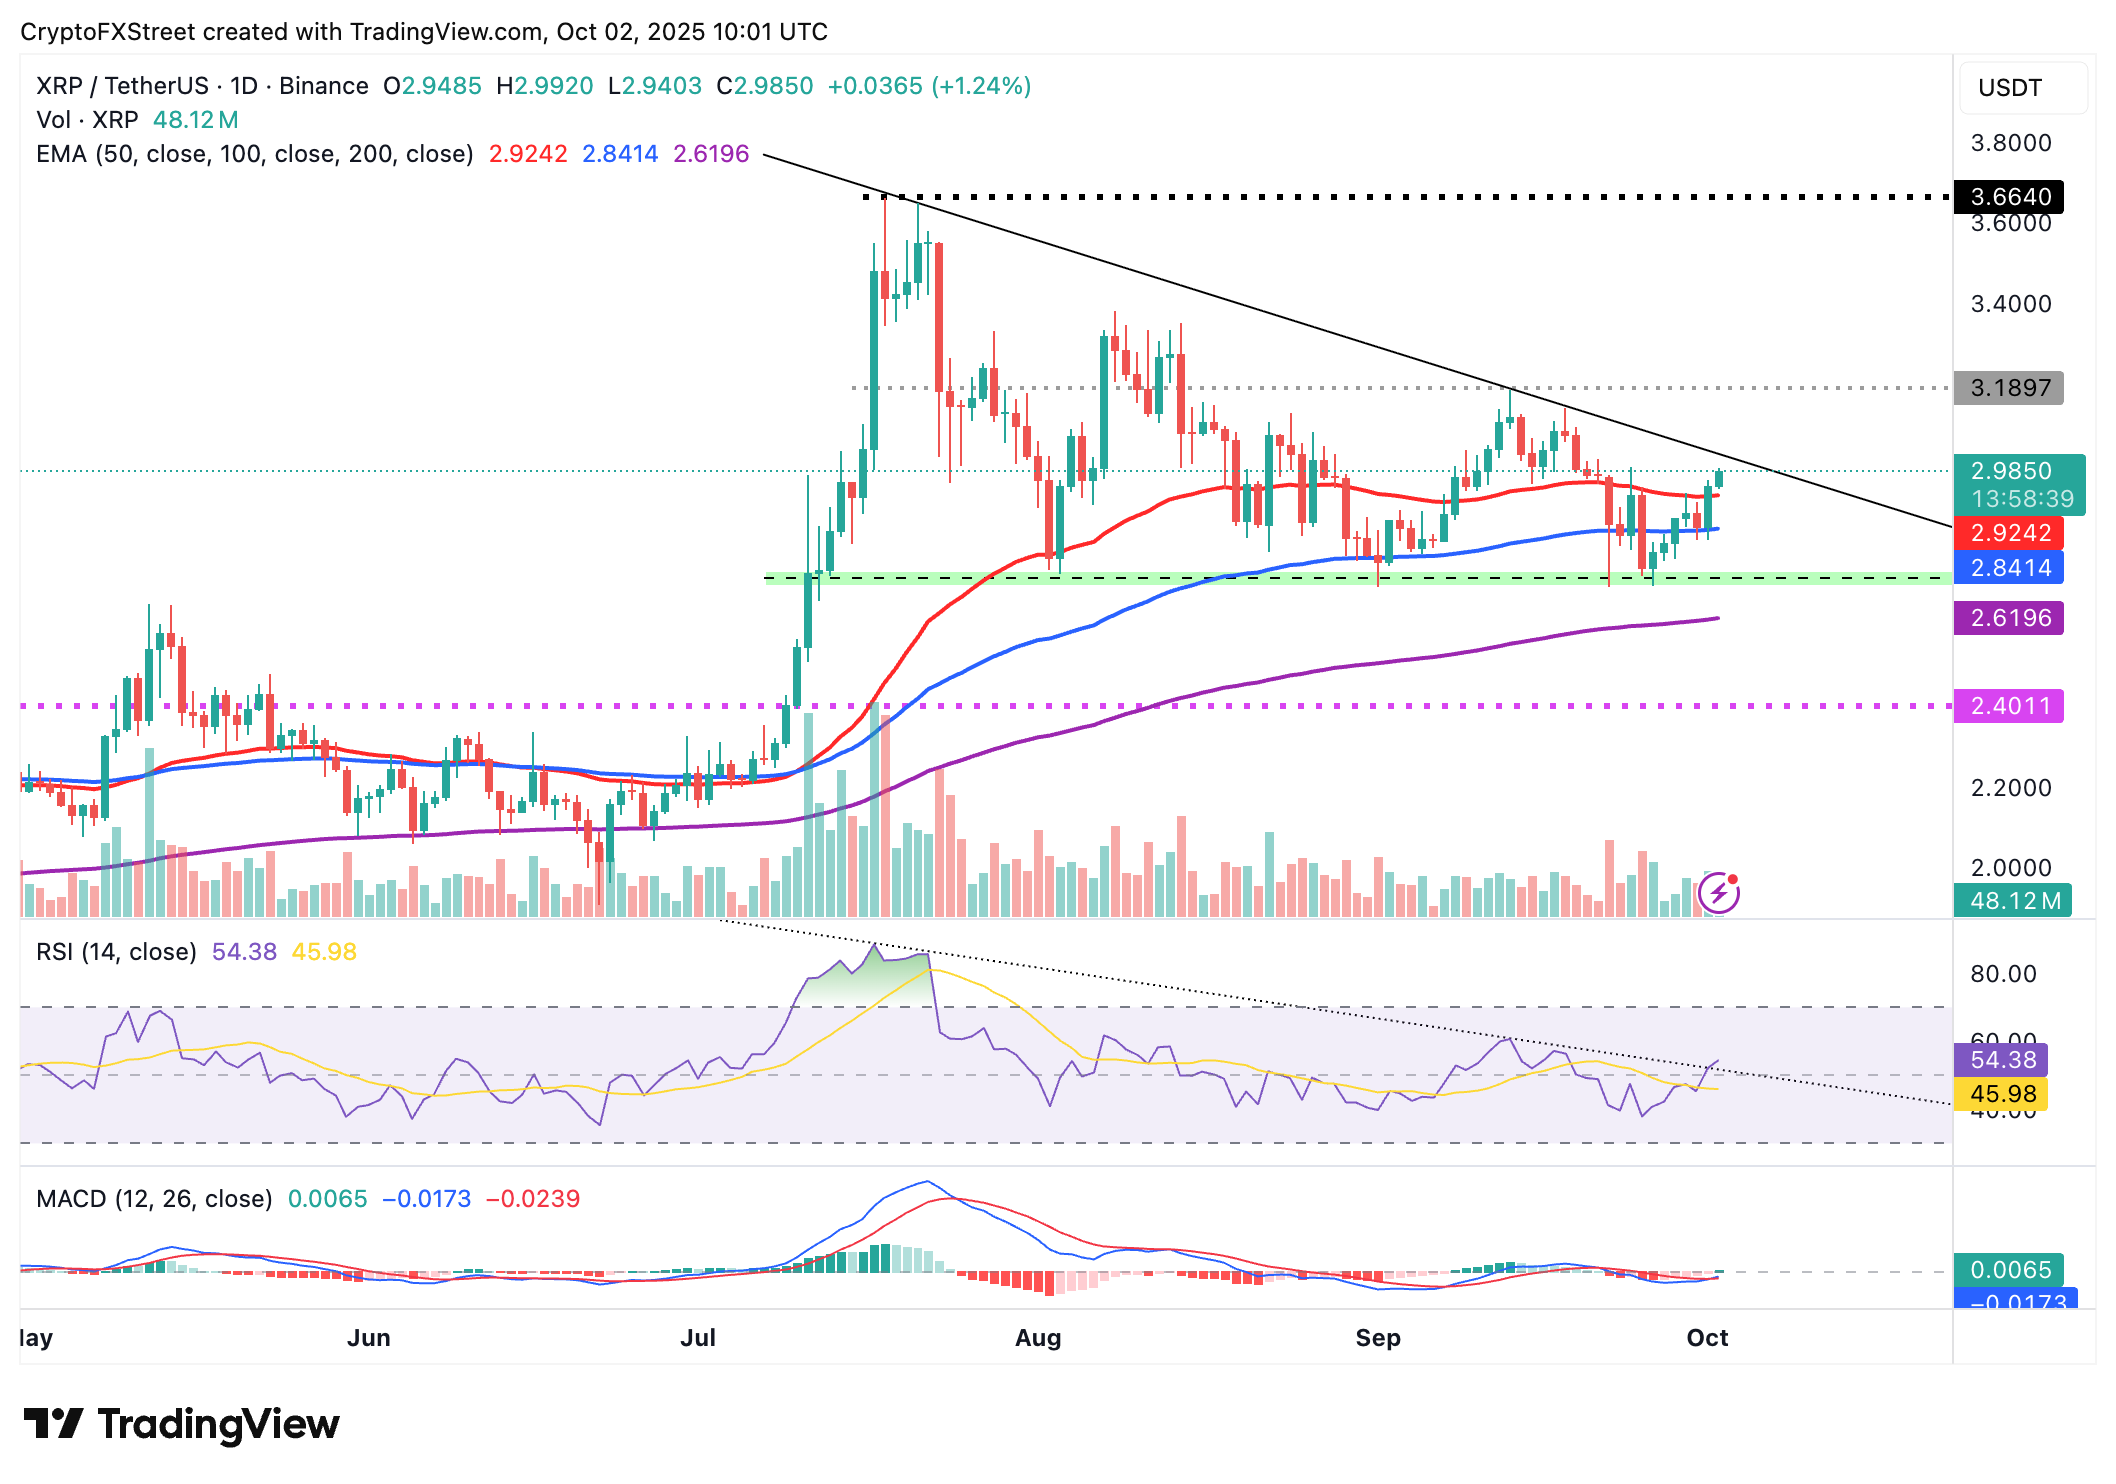
As for XRP, bulls are largely in control, supported by key moving averages. The 50-day EMA, positioned at $2.92, provides immediate support, with the 100-day EMA in line at $2.84 and the 200-day EMA at $2.62.
A gradually uptrending RSI, currently at 54 on the daily chart, underpins the bullish outlook alongside a buy signal from the MACD triggered on Wednesday.
XRP/USDT daily chart
Traders should also watch for a potential break above the descending trendline, which could signal a bullish turning point and a move toward the record high of $3.66. A medium-term resistance at $3.18 could delay the uptrend if investors take early profits.
Bitcoin, altcoins, stablecoins FAQs
Bitcoin is the largest cryptocurrency by market capitalization, a virtual currency designed to serve as money. This form of payment cannot be controlled by any one person, group, or entity, which eliminates the need for third-party participation during financial transactions.
Altcoins are any cryptocurrency apart from Bitcoin, but some also regard Ethereum as a non-altcoin because it is from these two cryptocurrencies that forking happens. If this is true, then Litecoin is the first altcoin, forked from the Bitcoin protocol and, therefore, an “improved” version of it.
Stablecoins are cryptocurrencies designed to have a stable price, with their value backed by a reserve of the asset it represents. To achieve this, the value of any one stablecoin is pegged to a commodity or financial instrument, such as the US Dollar (USD), with its supply regulated by an algorithm or demand. The main goal of stablecoins is to provide an on/off-ramp for investors willing to trade and invest in cryptocurrencies. Stablecoins also allow investors to store value since cryptocurrencies, in general, are subject to volatility.
Bitcoin dominance is the ratio of Bitcoin's market capitalization to the total market capitalization of all cryptocurrencies combined. It provides a clear picture of Bitcoin’s interest among investors. A high BTC dominance typically happens before and during a bull run, in which investors resort to investing in relatively stable and high market capitalization cryptocurrency like Bitcoin. A drop in BTC dominance usually means that investors are moving their capital and/or profits to altcoins in a quest for higher returns, which usually triggers an explosion of altcoin rallies.
Recommended Articles


