

Top Crypto Gainers: Zcash rallies on Grayscale Trust as DeXe, MYX Finance follow suit
- Zcash holds steady on Thursday after a 62% jump from the previous day.
- DeXe extends gains as bullish momentum remains elevated.
- MYX Finance’s upcycle nears the breakout of the current all-time high.
Zcash (ZEC) rally outperforms the broader cryptocurrency market, driven by Grayscale's launch of a ZEC trust and a record-high Open Interest. DeXe (DEXE) and MYX Finance (MYX) follow as top performers with double-digit gains.
Zcash rally hits a three-year high, eyeing further gains
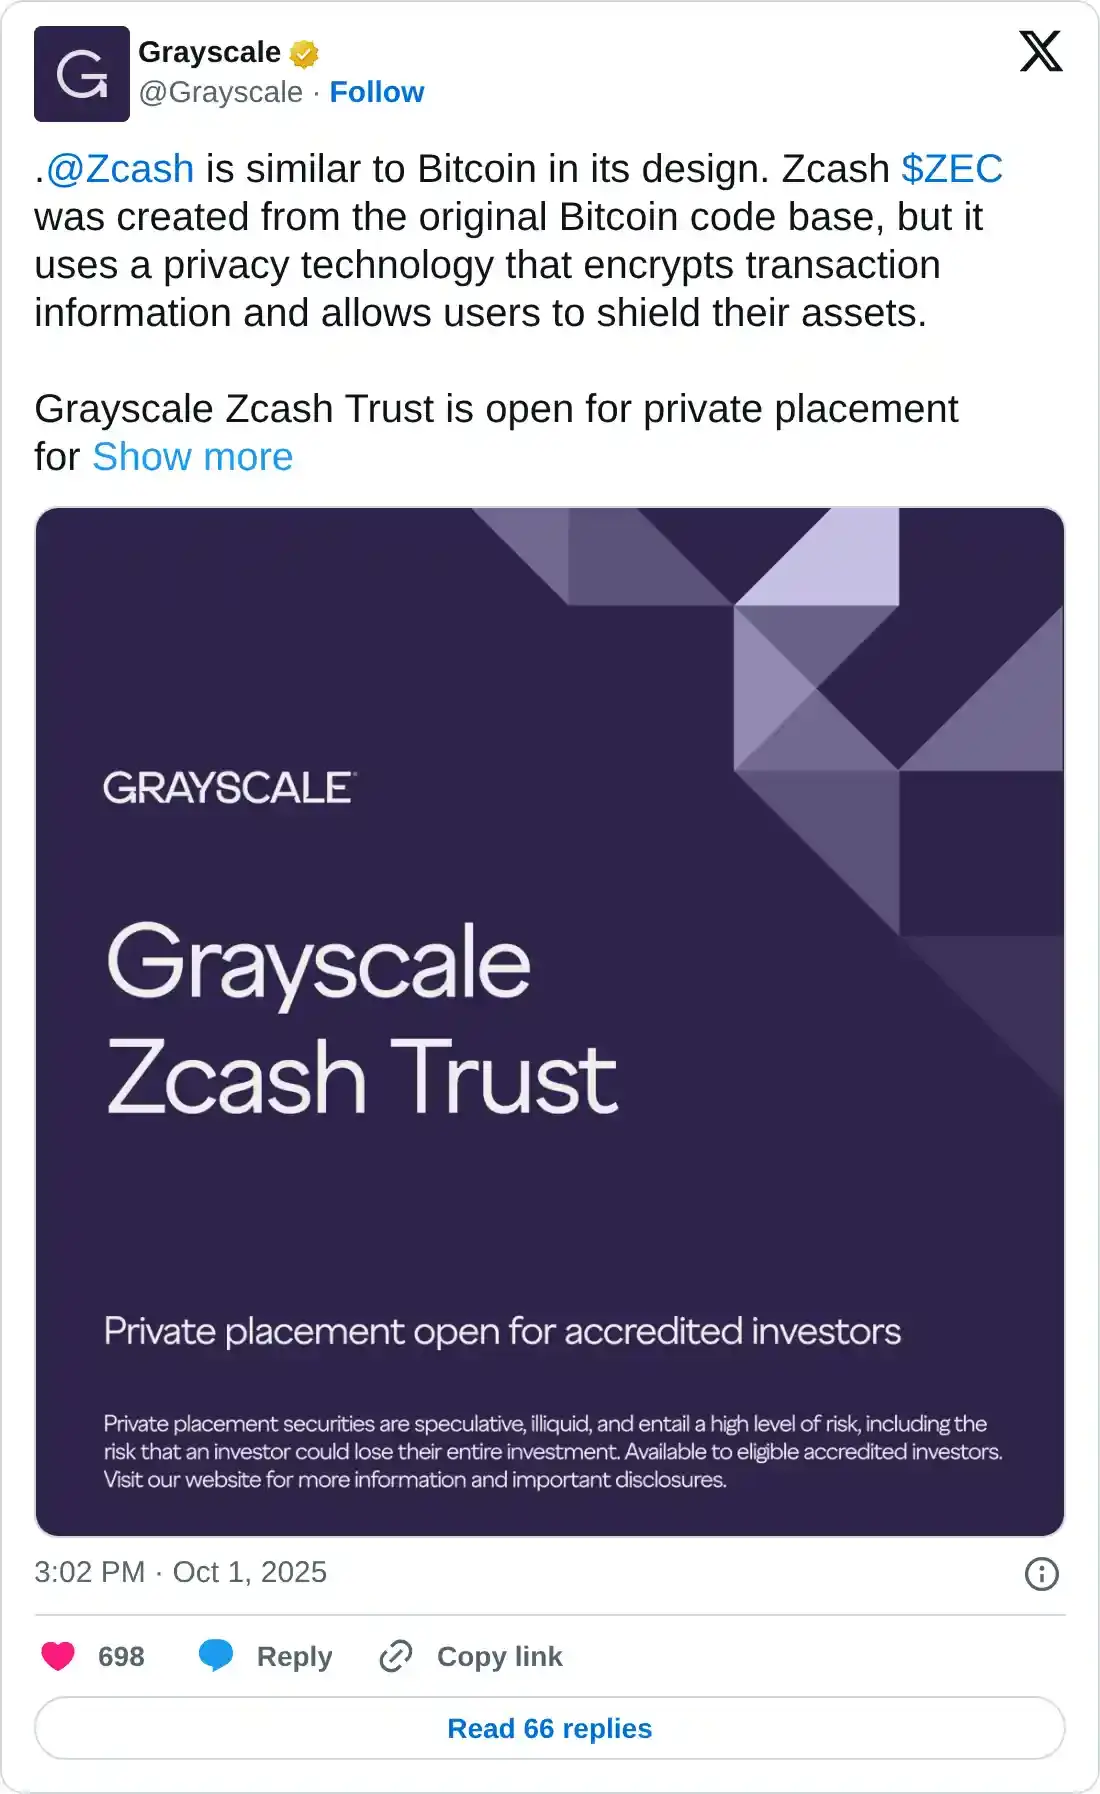
Zcash trades above $120 at the time of writing on Thursday, marking over 100% gains so far this week. The rally ignited with the launch of Grayscale’s Zcash Trust for eligible investors in a private placement. The Trust’s assets under management exceed $46 million, with a net asset value per share of $9.70 as of Thursday.
ZEC exceeds the 61.8% Fibonacci retracement level at $111, retraced from the $372 high in May 2021 to the $15 low in July 2024. A decisive close above this level could extend the rally to the 78.6% Fibonacci retracement level at $189.
CoinGlass data shows a more than 200% rise in ZEC Open Interest (OI) over the last 24 hours, reaching $120 million, indicating a significant capital inflow into Zcash derivatives. Validating the risk-on sentiment, the OI-weighted funding rate has flipped positive to 0.0491%, from -0.0711% earlier on the day.
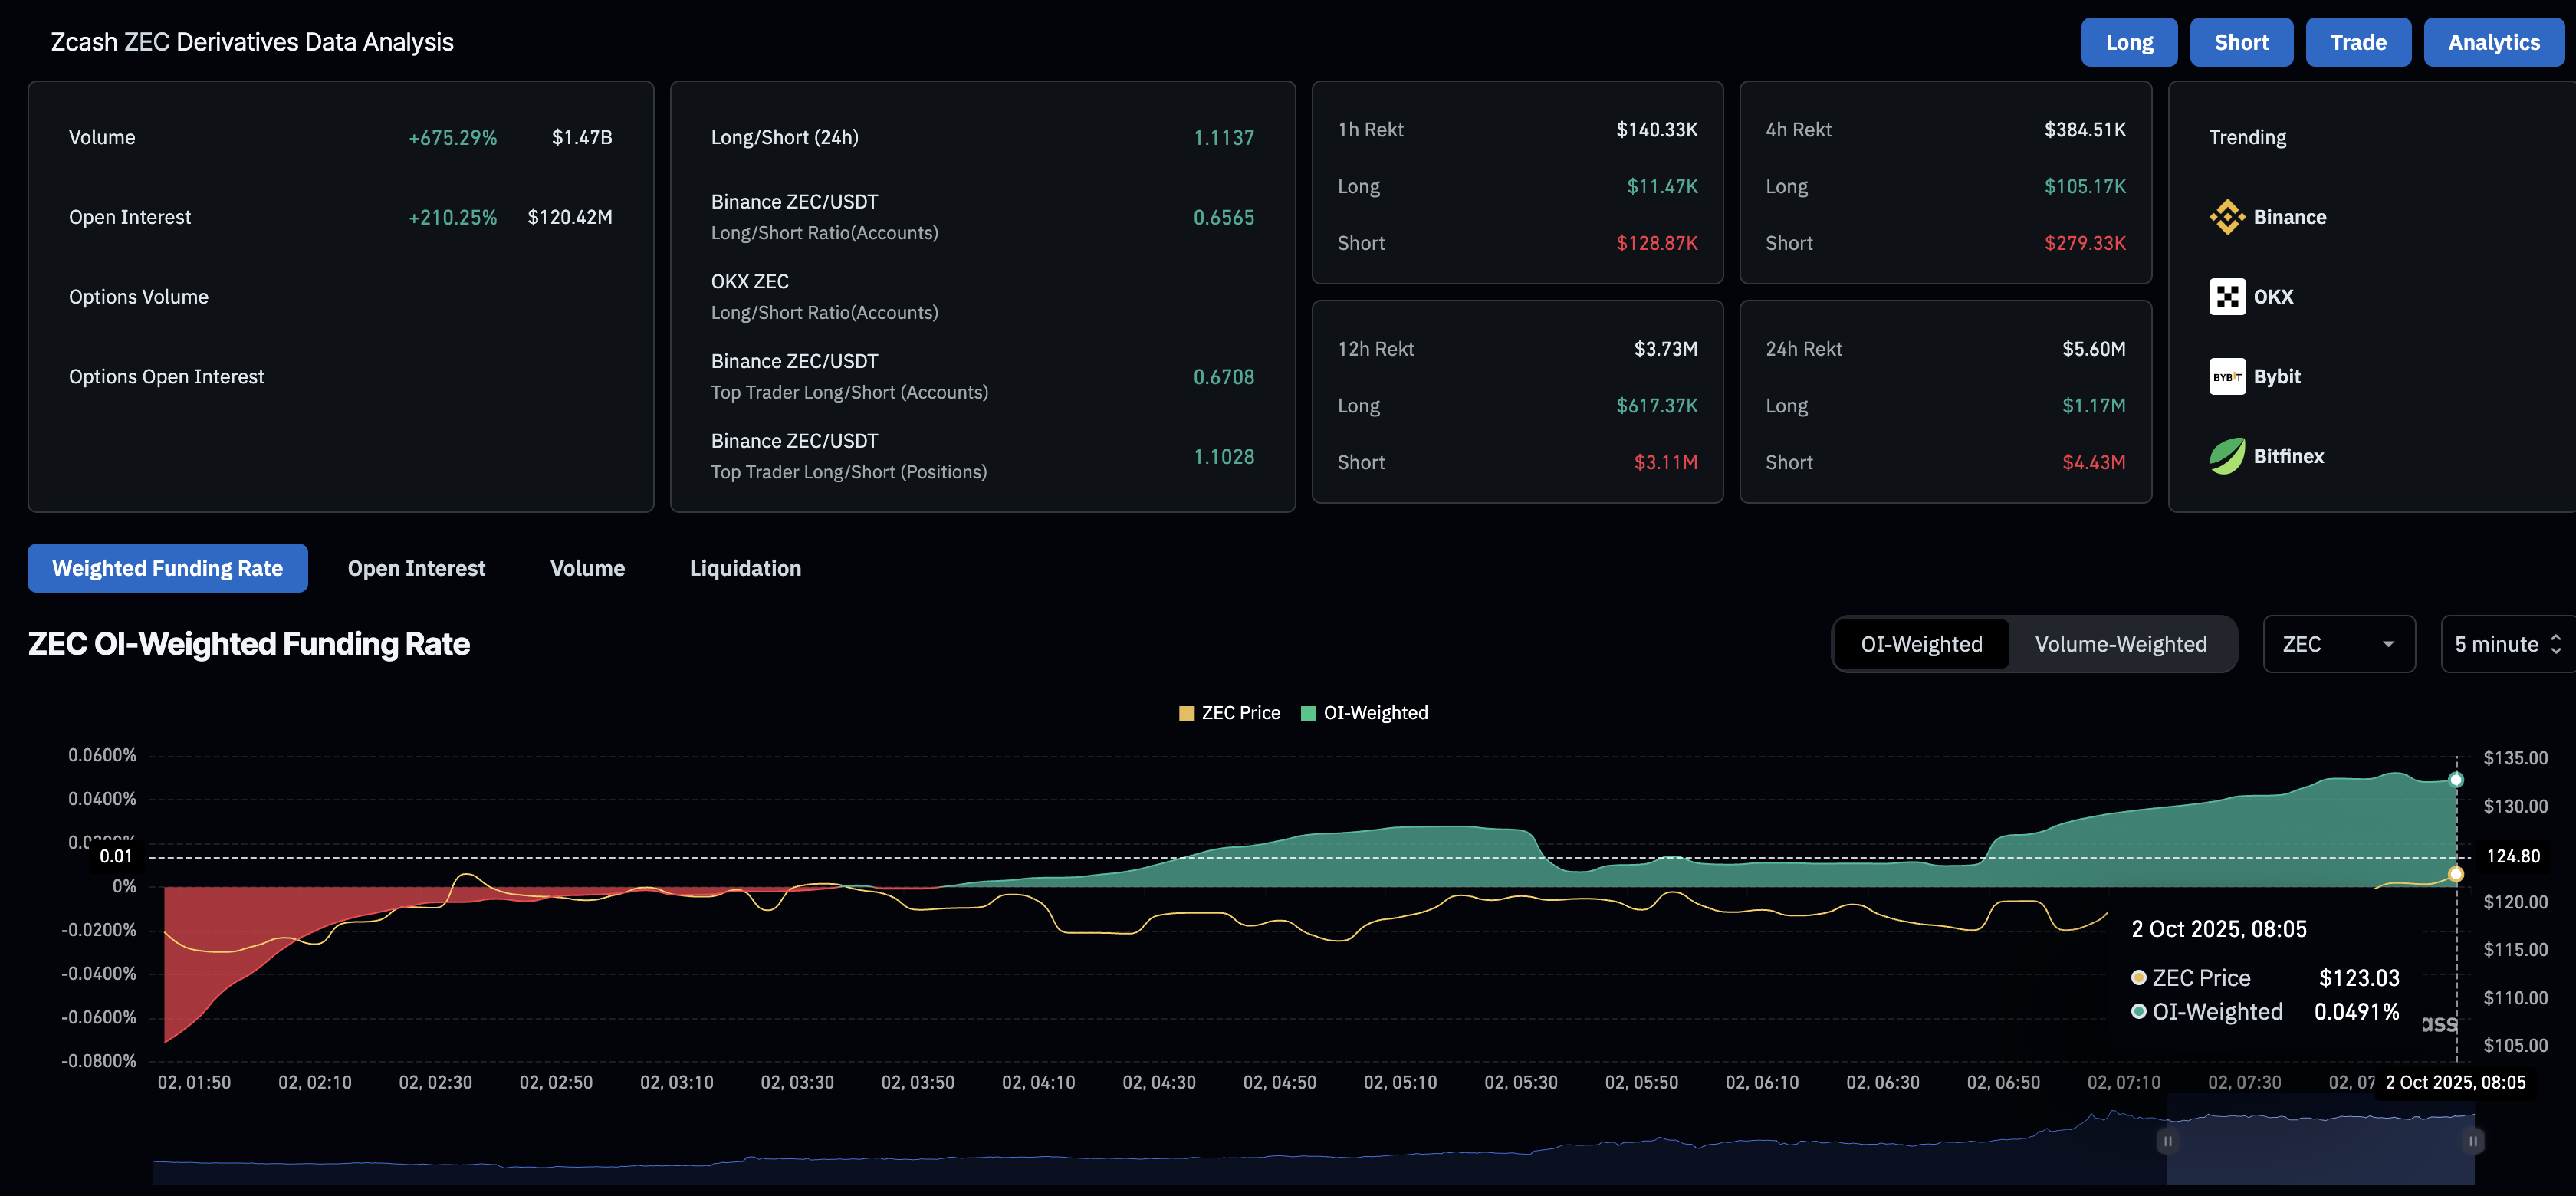
ZEC derivatives data. Source: CoinGlass
The bullish momentum is elevated as the Relative Strength Index (RSI) at 83 has entered the overbought region on the weekly chart. Additionally, the Moving Average Convergence Divergence (MACD) surges above its zero line with successive rises in the green histogram bars.
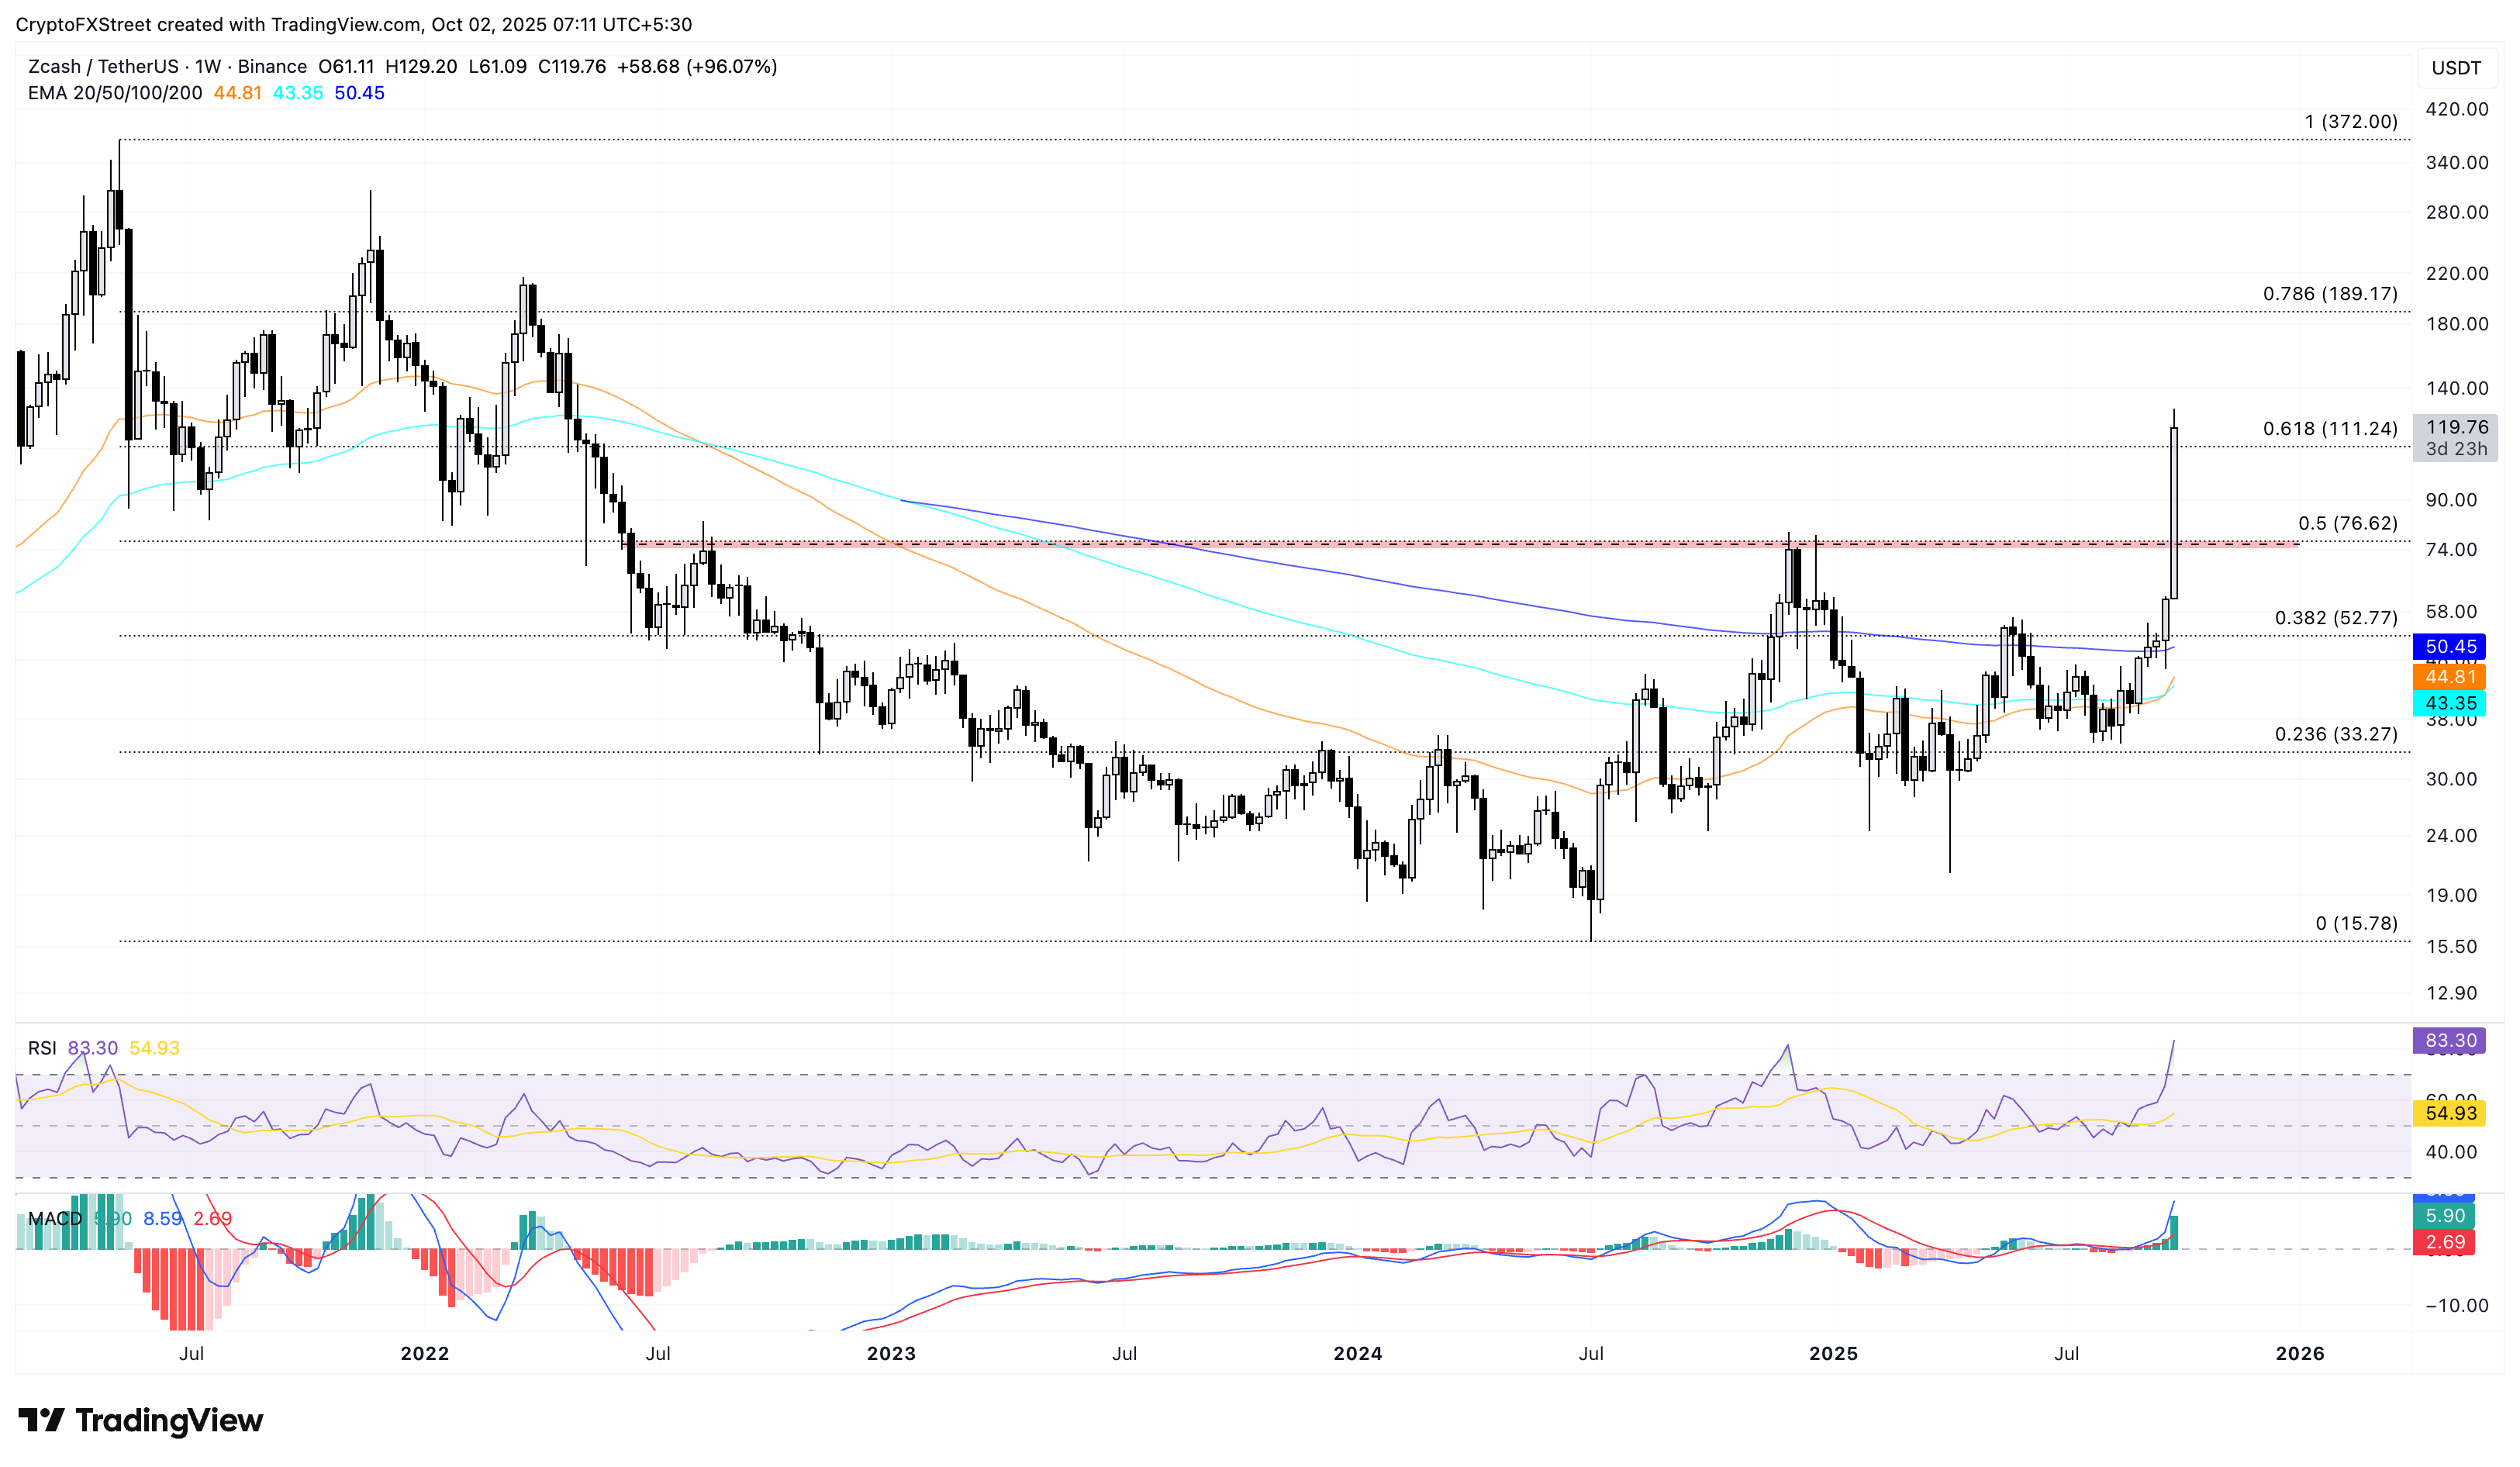
ZEC/USDT weekly price chart.
Looking down, if ZEC drops below $111, the key areas of support for ZEC lie at the $100 psychological level, followed by the 50% retracement level at $76.
DeXe gains traction amid rising whale interest
DeXe edges higher by 1% at press time on Thursday, holding above the $10.00 level after an 18% rise from the previous day. DeXe gains traction as the large wallet investors, popularly known as whales, show interest.
CryptoQuant data shows a significant increase in the number of whale orders in recent days, indicating a notable rise in demand. If this trend continues, the general demand-supply rule suggests an uptrend.
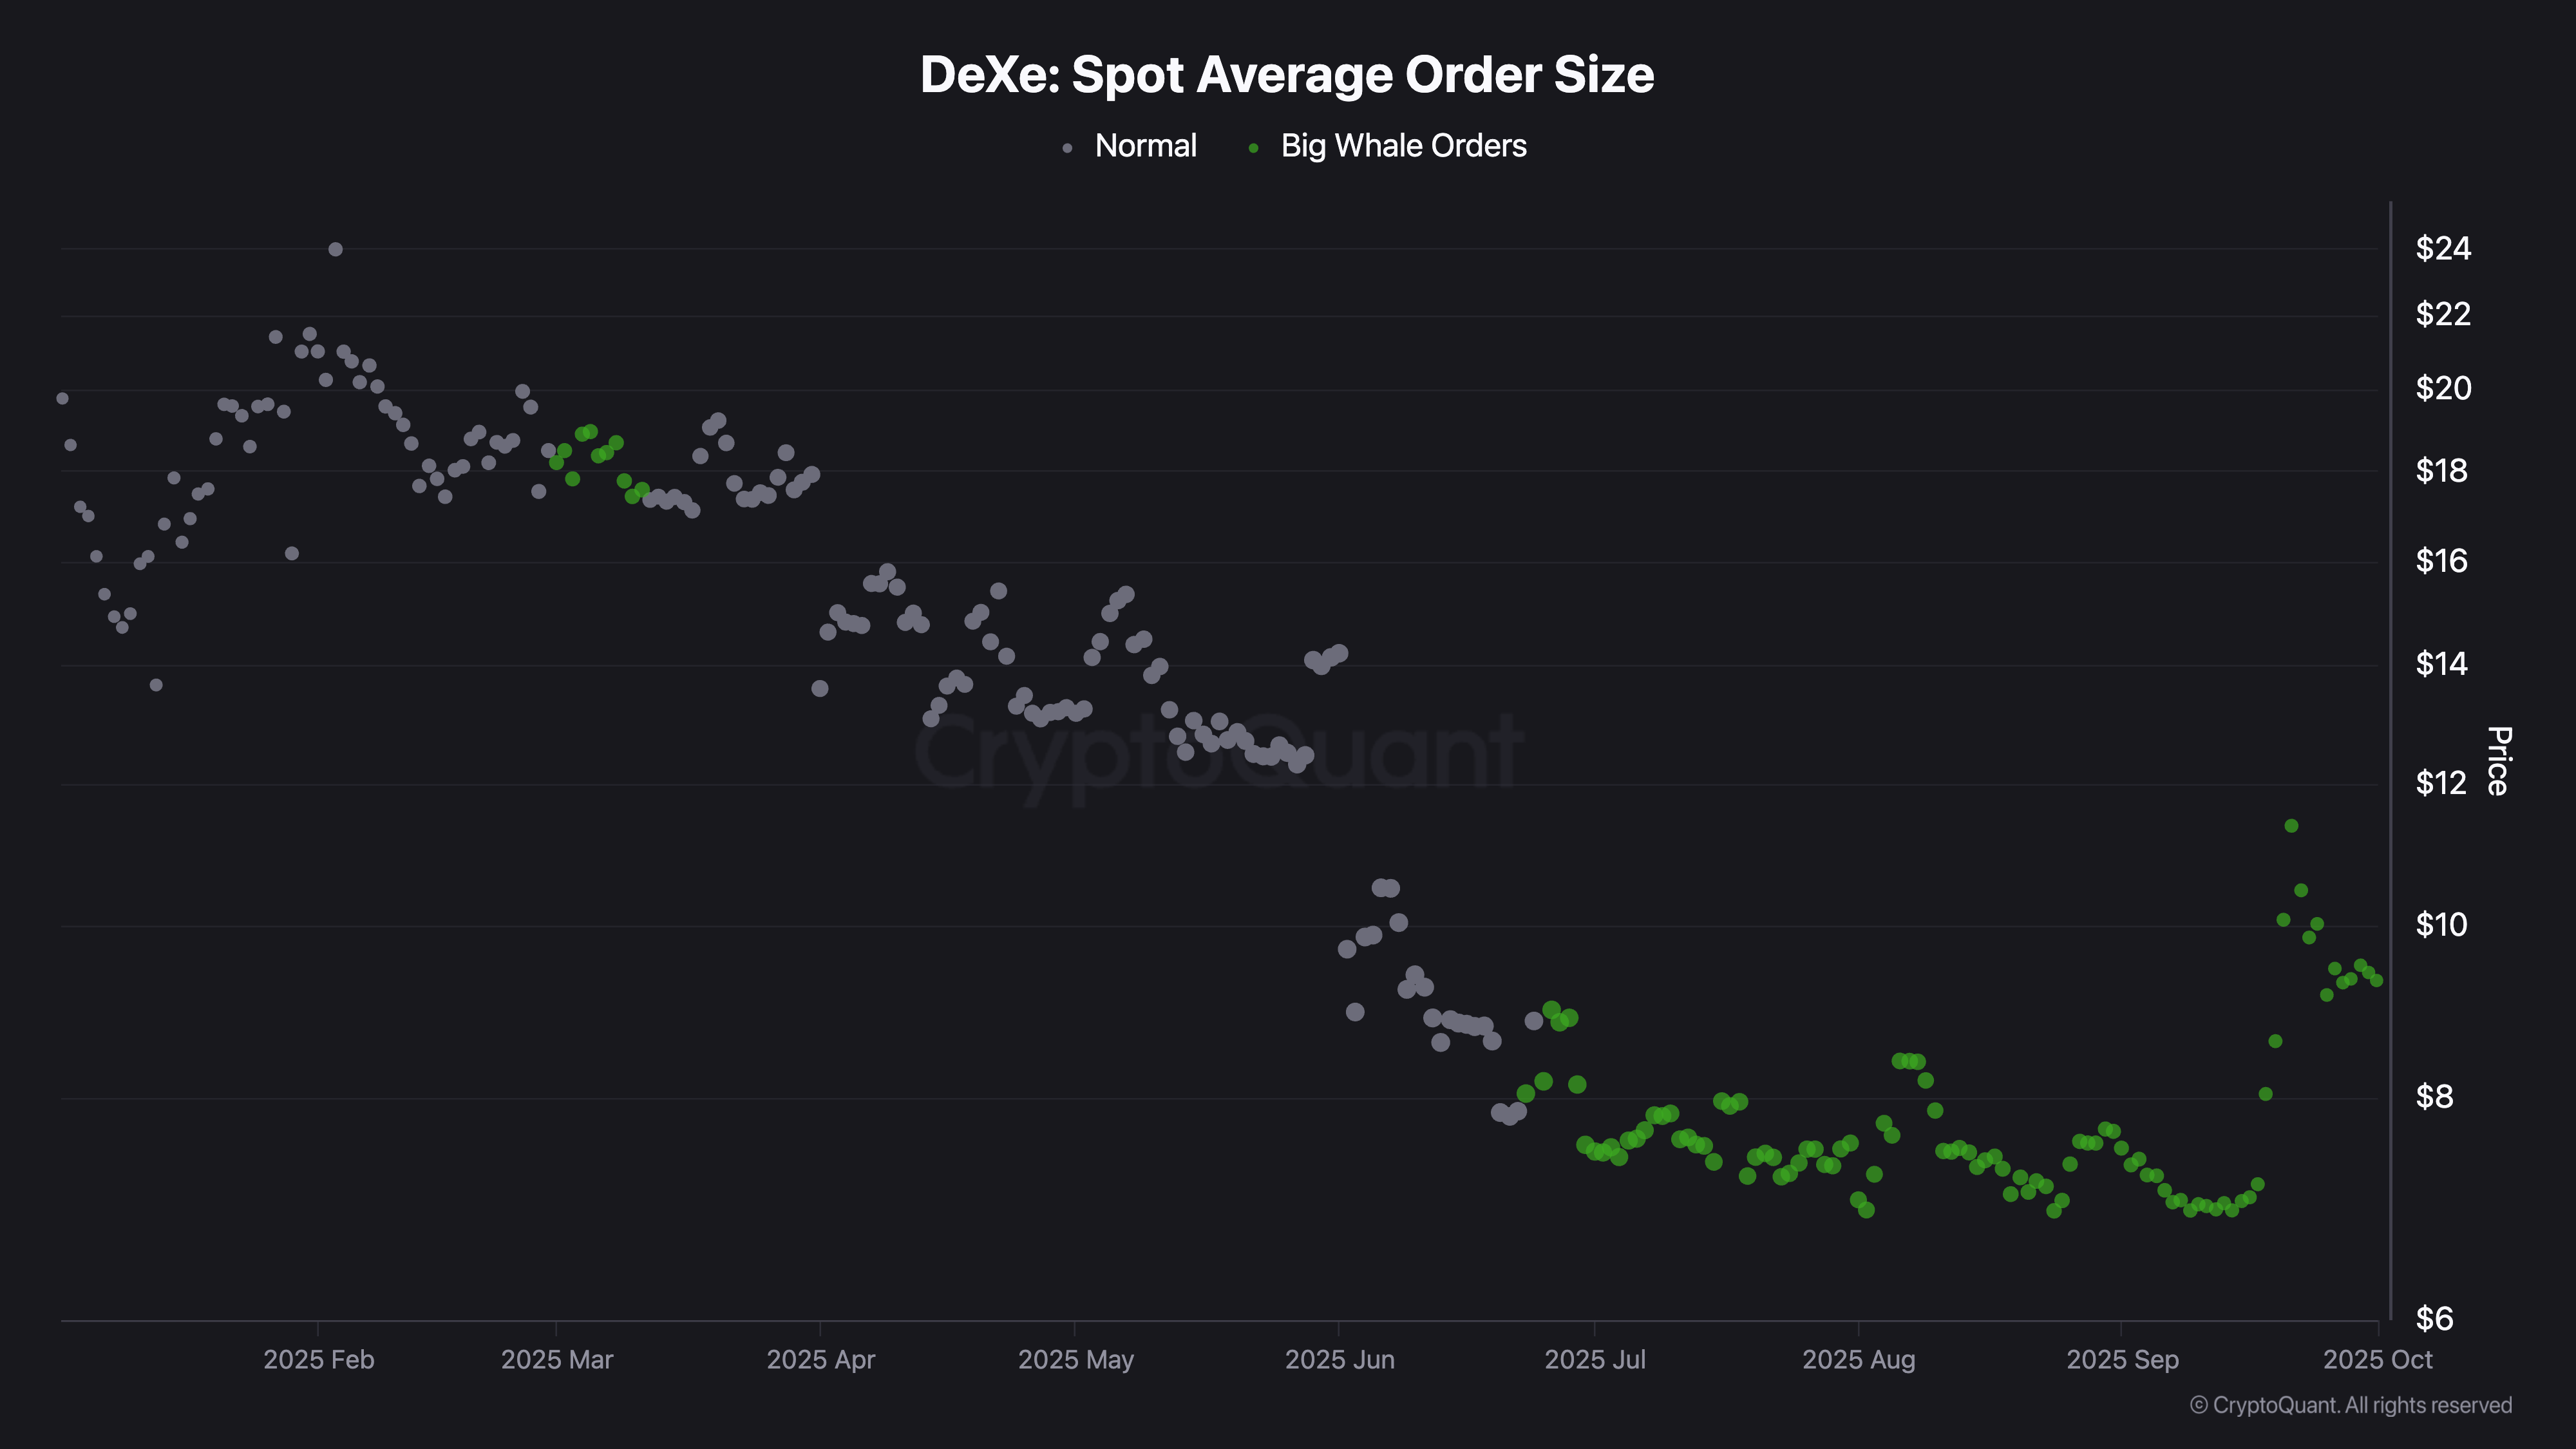
DeXe Spot Average Order Size. Source: CryptoQuant
The immediate resistance for DeXe rally lies at the R1 pivot level at $12.68. The technical indicators on the daily chart corroborate the demand surge as the RSI at 72 remains overbought. Meanwhile, the MACD bounces off its signal line, indicating a second wave of buying pressure.
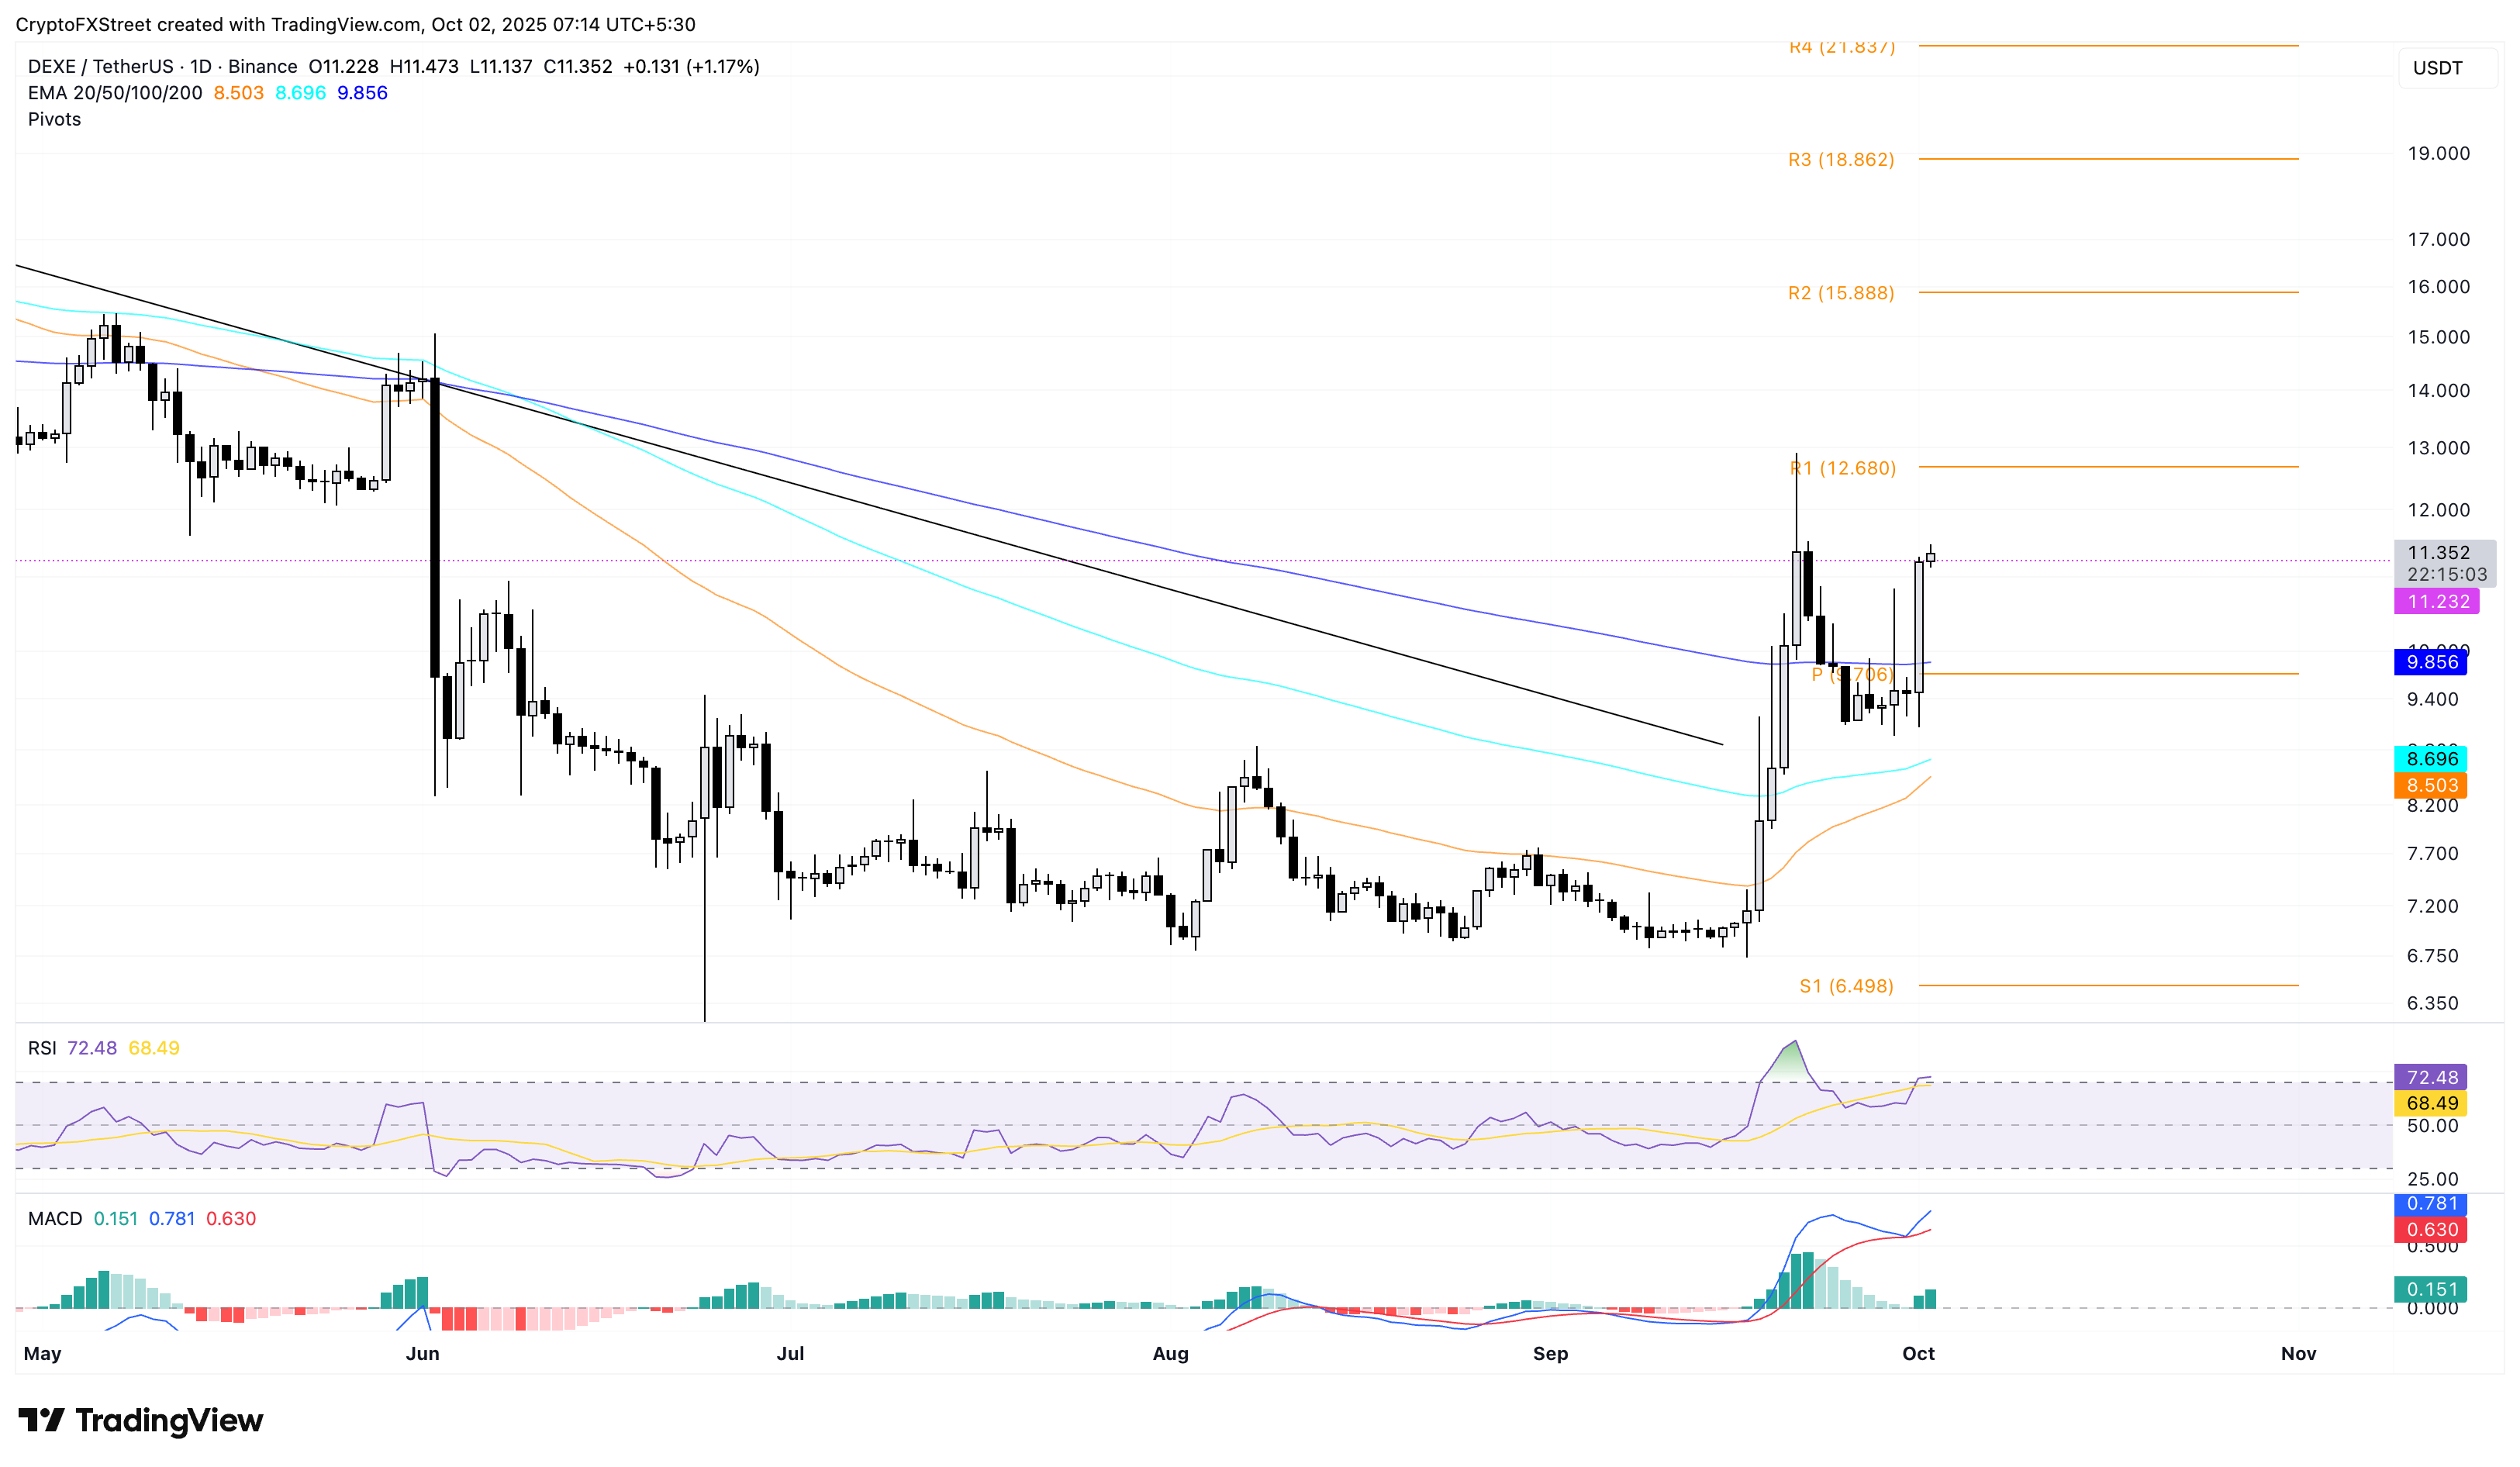
DEXE/USDT daily price chart.
If the trend flips, DeXe could find support levels at the 200-day Exponential Moving Average (EMA) at $9.856.
MYX Finance eyes a breakout rally
MYX Finance extends the reversal from the $8.20 low on September 22, inching closer to its all-time high of $19.00. At the time of writing, MYX is up nearly 3% on Thursday following the 5% gains from the previous day.
A potential daily close above $19.00 will confirm the consolidation range breakout formed with the baseline at $8.20. Pivot levels indicate the overhead resistance at $22.52 and $29.78, which align with the R1 and R2 levels, respectively.
The RSI at 67 remains flat, indicating a position under the overbought zone, which signals elevated levels of bullish momentum. Additionally, the MACD and its signal line indicate an uptrend, characterized by rising green histogram bars.
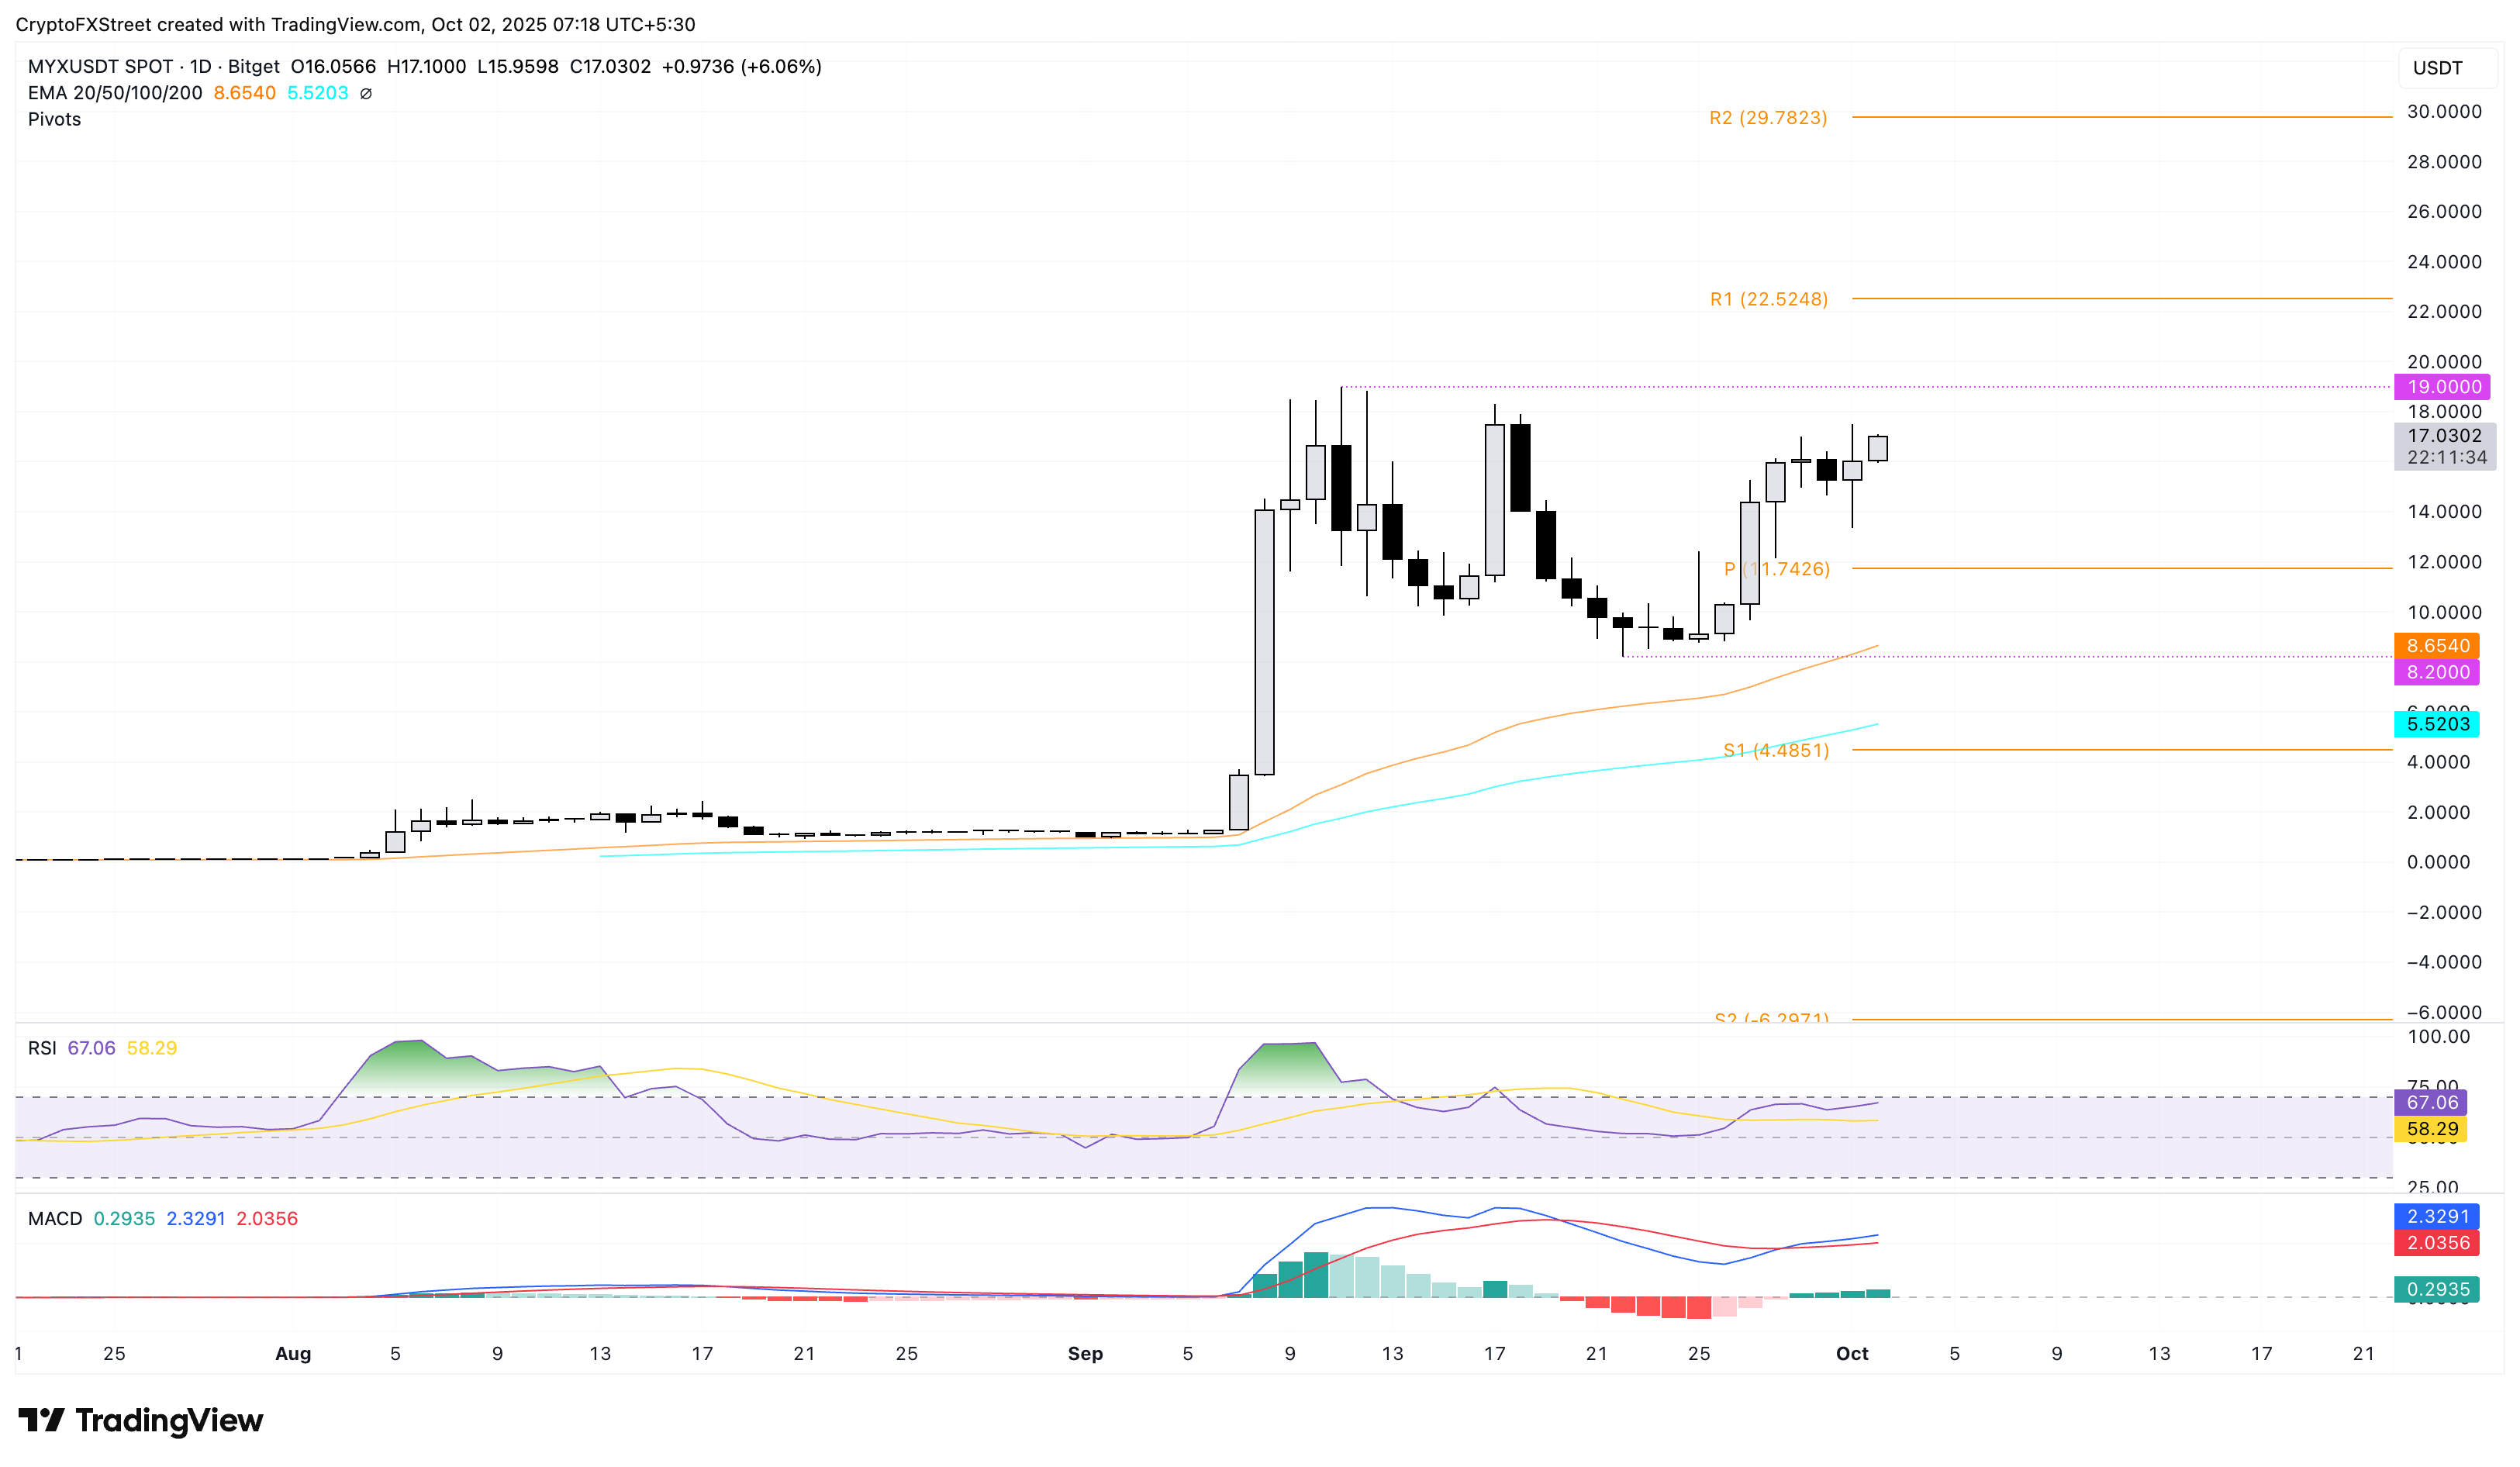
MYX/USDT daily price chart.
On the flip side, the centre pivot line at $11.74 could act as the immediate support if MYX reverses from $19.00.
Recommended Articles


